Kostenpflichtige technische Indikatoren für den MetaTrader 5 - 14

Fibonacci sequence is defined by integer sequence: 0, 1, 1, 2, 3, 5, 8, 13, 21, 34, 55, 89, 144, ... By definition, it starts from 0 and 1, the next number is calculated as a sum of two previous numbers. Instead of the standard moving average, the indicator uses the following calculation of average price: Bar0 + Bar1 + Bar2 + Bar3 + Bar5 + Bar8 + Bar13 + Bar21 + ... Input parameters: fiboNum - numbers in the following integer sequence for Fibo Moving Average 1. 5 on default. fiboNum2 - numbers i

ZigZagLW - Brief Description This is an implementation of an idea described in Larry Williams' "Long-Term Secrets to Short-Term Trading". The first figure displaying the basic principle has been taken from that book.
Operation Principles The indicator applies optimized calculation algorithms with the maximum possible speed for non-redrawable indicator. In other words, the zigzag's last shoulder is formed right after the appropriate conditions occur on the market. The shoulder does not change i
"ATR channel all MAs jm" is a indicator that allows displaying on a chart the ATR channel calculated according to the moving average selected. You can select 9 standard MAs available in MetaTrader 5 - SMA, EMA, SMMA, LWMA, DEMA, TEMA, Frama, VIDYA, AMA, TRIX, and 4 non-standard - LRMA, HMA, JMA, AFIRMA.
General Parameters: Channel type - true: channel ATR, false: channel price. Method MA - select the type of moving average to show in the current graph. Period MA - the number of bars to calcula

"Bollinger Bands all MAs" is an indicator that allows drawing Bollinger Bands calculated according to the selected moving average. You can select 9 standard MAs available in MetaTrader 5 - SMA, EMA, SMMA, LWMA, DEMA, TEMA, Frama, VIDYA, AMA, TRIX, and 4 non-standard ones - LRMA, HMA, JMA, AFIRMA.
General Parameters Method MA - select the type of moving average to be displayed in the current graph. Period MA - the number of bars to calculate the MA. Width bands - the width of the bands expresse
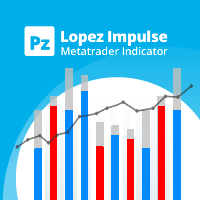
Dieser Indikator bewertet gleichzeitig die Volatilität und die Kursrichtung, wobei die folgenden Ereignisse ermittelt werden. [ Installationsanleitung | Update-Anleitung | Fehlerbehebung | FAQ | Alle Produkte ] Entscheidende und plötzliche Preisbewegungen Große Hämmer / Sternschnuppenmuster Starke Ausbrüche, die von den meisten Marktteilnehmern unterstützt werden Unentschlossene, aber volatile Marktsituationen Es ist ein extrem einfach zu verwendender Indikator ... Das blaue Histogramm repräsen
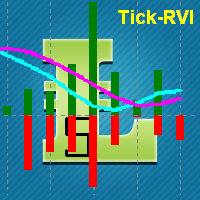
This indicator is designed for M1 time frame and shows: Sum of points when the price goes up (Green Histogram). Sum of points when the price goes down (Red Histogram). In other words, by the number and ratio of bullish points to bearish ones, you can do a technical analysis of the state of the market.
If the green histogram prevails over the red one, you can conclude that at the moment the buyers are stronger than the sellers, and vice versa, if the red histogram prevails over the green, the

A moving average is commonly used with time series data to smooth out short-term fluctuations and determine longer-term trends. The proposed indicator has an ability to increasing a smooth-effect. This indicator could play an important role in determining support and resistance. An input parameter nPeriod determines number of Bars for Moving AboveAverage calculation.

Вертикальная гистограмма объема - отображает распределение объема по уровням. Гистограмма рассчитывается от объема ( реального или тикового), при этом объем соответствующий бару переносится на уровень H-L бара.
Таким образом, при распределении объема за сутки по вертикали - формируются максимумы гистограммы показывающие области проторговки. Настройки индикатора: Timeframe Set - период в пределах которого производится расчет. (рекомендуется D1) Step's - количество отображаемых периодов. Amplit
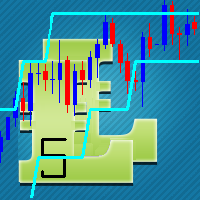
This indicator is based on the classical Envelopes indicator. The proposed indicator has the ability to increase a smooth-effect in the Envelopes Indicator. This indicator could play an important role in determining support and resistance. nPeriod input parameter determines the number of Bars for Moving Above Envelopes calculation.

Optimistic trader may enter the market when the price crosses the Aqua line. More reliable entry will be when the price crosses the Blue line. When the price comes back and crosses the Red line you can open a position in the course of price movements.

On the current chart, this indicator displays candlestick highs and lows of another time frame. Input Parameters: TimeFrame - chart time frame whose data will be displayed on the current price chart (by default, H12). Time Zone - shift of the indicator by time zone relative to the broker's time (by default, Broker-1). If the broker's time zone is UTC+1 and the Time Zone parameter is set to Broker-1, the bends of the indicator will be plotted in multiples of Greenwich Time. Indicator buffer value

This indicator is based on the classical Alligator indicator which is a trend trading indicator. Stay in the trade as long as the candlesticks ride above or below the Alligator. When the lines converge or cross, it is time to consider entering or exiting
The proposed indicator has the ability to increase a smooth-effect in Alligator Indicator. This indicator could play an important role in determining support and resistance.

The Fibonacci series. This number sequence is formed as each subsequent number is a sum of the previous two. it turns out that it refers to its neighbors in the ratio 0.618 and 1.618 The most commonly used method for measuring and forecasting the length of the price movement is along the last wave, which ended in the opposite direction
The Fibonacci Waves indicator could be used by traders to determine areas where they will wish to take profits in the next leg of an Up or Down trend.
Der Indikator erweitert die Fähigkeiten von Standardfraktalen, ermöglicht es Ihnen, sie zu finden, anzuzeigen und zu verwenden und für jede ungerade Länge zu berechnen, dh 3, 5, 7, 9 usw. Fraktale können nicht nur anhand von Balkenpreisen berechnet werden, sondern auch anhand der Werte gleitender Durchschnitte einer bestimmten Periode. Alle Arten von Warnungen werden in den Indikatoren getrennt für obere und untere Fraktale implementiert. Um die Anzahl der verwendeten Balken einzustellen, wird d

The indicator shows the angle of the DeMarker indicator line, which allows you to identify possible price extrema more accurately. Histogram bar color and size indicate the direction and angle of the DeMarker line. When the trade volume control is enabled, a yellow bar is an indication of the volume being lower than average over the past 50 bars. The color of the main indicator line shows whether the price has reached an overbought/oversold level in accordance with DeMarker indicator values. The

The indicator is designed for visual multicurrency analysis. It allows synchronous scrolling and analysis of a few charts simultaneously. The product can also be used for pairs trading. The indicator works both on Forex and Russian FORTS market. The product has a very important property - if there are skipped bars at the symbols, the synchronism of charts on the time axis is fully preserved . Each chart point is strictly synchronous with the others on the time axis at any time frame. This is esp

RBC Range Bar Chart is a classical range bar chart indicator. The indicator features price ranges for charting: High/Low price range is a classical option for analysis. It also has Open, High, Low and Close prices. In the first option, two price values are analyzed at the same time, while other options only use one price. Conventionally, range bars are drawn using tick data but since tick data is not available on the server, charting is only possible based on bar data from standard time frames.
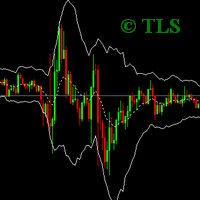
Erweiterte Version der Anzeige "Keltner Channel". Dies ist ein Analysetool, mit dem Sie das Verhältnis der Kursposition im Verhältnis zu ihrer Volatilität bestimmen können. Sie können 26 Arten von gleitenden Durchschnitten und 11 Preisoptionen verwenden, um die Mittellinie des Indikators zu berechnen. Konfigurierbare Benachrichtigungen benachrichtigen Sie, wenn der Preis die obere oder untere Grenze des Kanals berührt. Verfügbare Durchschnittstypen: Simple Moving Average, Exponential Moving Aver

Dieser Indikator findet AB = CD-Retracement-Muster. Das AB = CD-Retracement-Muster ist eine 4-Punkte-Preisstruktur, bei der das anfängliche Preissegment teilweise zurückverfolgt wird, gefolgt von einer Bewegung mit gleichem Abstand vom Abschluss des Pullbacks, und die Basis für alle harmonischen Muster ist. [ Installationsanleitung | Update-Anleitung | Fehlerbehebung | FAQ | Alle Produkte ]
Anpassbare Mustergrößen
Anpassbare AC- und BD-Verhältnisse Anpassbare Pausenzeiten Anpassbare Linie

The indicator draws lines that can serve as support/resistance levels. They work both on Forex and FORTS. The main and additional levels are displayed as lines, with the color and style defined by the user. Additional levels are only displayed for currency pairs without JPY. Please see the AUDUSD chart below. Yellow ovals indicate some characteristic points where price reaches one of the levels. The second screenshot shows a FORTS instrument chart with the characteristic points. Simply watch the

The indicator creates 2 dot lines representing an upper and lower bands and the main indicator aqua line as the price power. If the main line is swimming inside the bands, then you should wait and watch before entering the market. When the main line jumps out or in the bands, then you should make a long or a short position.

This is an open interest indicator for the Russian FORTS futures market. Now, you can receive data on the open interest in real time in МТ5 terminal. This allows you to develop brand new trading strategies or considerably improve the existing ones. The data on the open interest is received from the database (text CSV or binary one at user's discretion). Thus, upon completion of a trading session and disabling the terminal (or PC), the data is saved and uploaded to the chart when the terminal is
The concepts of trading level support and resistance one of the most highly discussed attributes of technical analysis. Part of analyzing chart patterns, these terms are used by traders to refer to price levels on charts that tend to act as barriers, preventing the price of an asset from getting pushed in a certain direction.
This indicator will draw the Support and Resistance lines calculated on the nBars distance. If input parameter Fibo = true then the Fibonacci lines will appear be

This indicator is intended to guard your open position at any time frame and currency pair.
Long position In case the current price goes above the Take Profit price or below the Stop Loss price of the opened position and the Dealing Desk does not close this position, the indicator creates an Excel file with the name: Buy-TP_Symbol_Date_PositionID.csv or Buy-SL_Symbol_Date_PositionID.csv which will be placed in the folder: C:\Program Files\ ........\MQL5\Files Excel file for Buy-TP: You will
Self Explanatory Indicator: buy when the Aqua line crossing the Yellow line upward and Sell when the Aqua line crossing the Yellow line downwards. Input parameters: Period1 = 13. Method1 = 2. MODE_SMA=0, MODE_EMA=1, MODE_SMMA=2, MODE_LWMA=3. Period2 = 5. Method2 = 0. MODE_SMA=0, MODE_EMA=1, MODE_SMMA=2, MODE_LWMA=3.

This indicator is designed for H1 timeframe and shows: Sum of points when the price goes up (Green Histogram). Sum of points when the price goes down (Red Histogram). In other words, by the number and ratio of bullish points to bearish ones, you can do a technical analysis of the state of the market.
If the green histogram prevails over the red one, you can conclude that at the moment the buyers are stronger than the sellers, and vice versa, if the red histogram prevails over the green, the s

Indicator Cloud is drawing "clouds" on the chart. If the current price is behind the cloud then no actions should be done. If the current price departs from the cloud then one should consider to go Long or Short according to the price movement. Input parameters: Period1 and Method1 could be used as indicator settings for each TimeFrame and Currency pairs.
"Support" and "Resistance" levels - points at which an exchange rate trend may be interrupted and reversed - are widely used for short-term exchange rate forecasting. One can use this indicator as Buy/Sell signals when the current price goes above or beyond Resistance/ Support levels respectively and as a StopLoss value for the opened position.

Trend is the direction that prices are moving in, based on where they have been in the past . Trends are made up of peaks and troughs. It is the direction of those peaks and troughs that constitute a market's trend. Whether those peaks and troughs are moving up, down, or sideways indicates the direction of the trend. The indicator PineTrees is sensitive enough (one has to use input parameter nPeriod) to show UP (green line) and DOWN (red line) trend.

Optimistic trader may enter the market when the price crosses the blue line. More reliable entry will be when the price crosses the yellow line. When the price comes back and crosses the red line you can open a position in the course of price movements. If the price is moving between aqua lines - stay out of the market.

Introduction Harmonic Patterns are best used to predict potential turning point. Traditionally, Harmonic Pattern was identified manually connecting peaks and troughs points in the chart. Manual harmonic pattern detection is painfully tedious and not suitable for everyone. You are often exposed under subjective pattern identification with manual pattern detection. To avoid these limitations, Harmonic Pattern Plus was designed to automate your harmonic pattern detection process. The functionality

When the bands come close together, constricting the moving average, it is called a squeeze. A squeeze signals a period of low volatility and is considered by traders to be a potential sign of future increased volatility and possible trading opportunities. Conversely, the wider apart the bands move, the more likely the chance of a decrease in volatility and the greater the possibility of exiting a trade. This indicator can be used at any time frames and currency pairs. The following input parame

The three basic types of trends are up, down, and sideways. An uptrend is marked by an overall increase in price. Nothing moves straight up for long, so there will always be oscillations, but the overall direction needs to be higher. A downtrend occurs when the price of an asset moves lower over a period of time. This is a separate window indicator without any input parameters. Green Histogram is representing an Up-Trend and Red Histogram is representing a Down-Trend.

Fibonacci Arcs in the full circles are based on the previous day's candle (High - Low). These arcs intersect the base line at the 23.6%, 38.2%, 50%, 61.8%, and 78.6%. Fibonacci arcs represent areas of potential support and resistance. Reference point - the closing price of the previous day. These circles will stay still all day long until the beginning of the new trading day when the indicator will automatically build a new set of the Fibonacci Arcs.

Support and resistance represent key junctures where the forces of supply and demand meet. On an interesting note, resistance levels can often turn into support areas once they have been breached. This indicator is calculating and drawing 5 pairs of "Support and Resistance" lines as "High and Low" from the current and 4 previous days.

The Bull and Bear Power indicators identify whether the buyers or sellers in the market have the power, and as such lead to price breakout in the respective directions. Bulls Power vs. Bears Power is a unique tool that displays on each candle the balance between the bears (sellers) and the bulls (buyers). This particular indicator will be especially very effective when the narrow histogram and the wide histogram reside on the same side (above or under the Zero line)

This indicator is a visual combination of 2 classical indicators: Bears and MACD. Usage of this indicator could be the same as both classical indicators separately or combine. Input parameters: input int BearsPeriod = 9; input ENUM_MA_METHOD maMethod = MODE_SMA; input ENUM_APPLIED_PRICE maPrice = PRICE_CLOSE; input int SignalPeriod = 5.

This indicator is a visual combination of 2 classical indicators: Bulls and MACD. Usage of this indicator could be the same as both classical indicators separately or combined. Input parameters: BearsPeriod = 9; ENUM_MA_METHOD maMethod = MODE_SMA; ENUM_APPLIED_PRICE maPrice = PRICE_CLOSE; SignalPeriod = 5.

Trend indicators tell you which direction the market is moving in , if there is a trend at all because they tend to move between high and low values like a wave
This indicator shows Up Trend (Green Histogram), Down Trend (Red Histogram) and Sideways Trend (Yellow Histogram). Only one input parameter: ActionLevel. This parameter depends of the length of the shown sideways trend.

Price Breakout pattern Scanner is the automatic scanner for traders and investors. It can detect following patterns automatically from your chart. Head and Shoulder - Common tradable pattern. Reverse Head and Shoulder - This pattern is the reverse formation of the Head and Shoulder. Double Top - When the price hits resistance level twice and decline toward the support level, the trader can anticipate sudden bearish breakout through the support level. Double Bottom - The double bottom pattern is

Der Indikator zeigt harmonische Muster auf dem Chart basierend auf Dynamic ZigZag ( https://www.mql5.com/en/market/product/5356 ) und ist fast ein vollständiges Analogon zu einer der Versionen bekannter korHarmonics. Der Indikator erkennt folgende Muster und deren Varianten: ABCD, Gartley (Butterfly, Crab, Bat), 3Drives, 5-0, Batman, SHS, One2One, Camel, Triangles, WXY, Fibo und Vibrations. In den Einstellungen ist standardmäßig nur die Anzeige von ABCD- und Gartley-Mustern aktiviert. Die u

MA Crossing displays two moving averages on the chart painting their crossing points in different colors - blue (buy) and red (sell). The indicator clearly defines the trend direction and power and simplifies the perception of market signals. The indicator may be useful in the strategies involving two moving averages' crossing method. The indicator's input parameters allow you to select the following settings for each moving average: period (Fast Period, Slow Period); smoothing period (Simple, E

Currency Power Meter shows the power of major currencies against each other. The indicator shows the relative strength of currency/pair at the current moment in a period of time (H4, daily, weekly, monthly). It is useful for day traders, swing traders and position traders with suitable period options. Currency power is the true reason of market trend: The strongest currency against the weakest currency will combine into a most trending pair. As we know, trend makes money and all traders love tre

Der Unterschied zum Standard-ZigZag-Indikator ist folgender: Anstatt neue Extremum-Punkte basierend auf der Anzahl der Balken zu berechnen, verwendet er den Abstand zwischen dem Hoch und dem Tief, um die Extremum-Punkte zu berechnen. Darüber hinaus wird diese Distanz standardmäßig dynamisch berechnet und hängt von Preisschwankungen für einen ausgewählten Zeitraum und dem Multiplikator ab. Der Abstand kann als feste Zahl eingestellt werden. Außerdem zeigt es die Umkehrlinie an, bis zu der der vor

Version for MetaTrader 5. The indicator is based on point and figure chart, but their period is equal to ATR indicator values. Displays in the form of steps. Steps above zero indicate an uptrend. Below zero on a downtrend. Parameters: ATRPeriod - ATR period for calculation of steps. Note: The indicator uses closes price, thus it is recommended to consider completed bars.

Rooster - is a handy tool that allows you to receive alerts from your favorite indicators: Supports up to 3 indicators, built-in and custom; Supports up to 4 different signals at the same time; Able to show pop-up alerts, send e-mail and push notifications. This is version for MetaTrader 5, version for MetaTrader 4 is here . Detailed manual is sent on request. Default settings demonstrate MACD lines crossing signal.
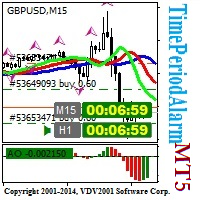
The TimePeriodAlarm indicator shows time till closure of a bar. If the 'Time period' is specified explicitly (i.e. not 'current'), the indicator displays the time till bar closure of the current period and the explicitly specified period. Ten seconds before the closure of the bar (at the period specified explicitly), a preliminary sound alert is played and a color alert is generated, then the main signal (can be set by the user) in the parameter 'Sound file(.wav)' is played. The sound file shoul

Der Heatmap-Indikator Mit diesem Heatmap-Indikator können Sie eine "Heatmap" aller in der Market Watch ausgewählten Symbole anzeigen. In dieser Version zeigt es die prozentuale Kursänderung im Verhältnis zum letzten Tagesschluss an, was einen schnellen Überblick über den Markt geben kann. Dies ist ein Tool, das Händlern hilft, herauszufinden, wie stark eine Währung im Verhältnis zu allen anderen Paaren ist. Dies ist ein visuelles Werkzeug und kann nicht in Expert Advisors verwendet werden. In d

This indicator shows the ratio of the number of buyers'/sellers' orders for the Russian FORTS futures market. Now, you can receive this information in real time in your МetaТrader 5 terminal. This allows you to develop brand new trading strategies or improve the existing ones. The data on the ratio of the orders number is received from the database (text CSV or binary one at user's discretion). Thus, upon completion of a trading session and disabling the terminal (or PC), the data is saved and u
This indicator shows the ratio of the volume of buyers'/sellers' orders for the Russian FORTS futures market. Now, you can receive this information in real time in your МetaТrader 5 terminal. This allows you to develop brand new trading strategies or improve the existing ones. The data on the ratio of the volumes of orders is received from the database (text CSV or binary one at user's discretion). Thus, upon completion of a trading session and disabling the terminal (or PC), the data is saved a

This indicator is designed for M1 timeframe and shows: sum of ticks when the price goes up divided by sum of ticks when the price goes down (red color); sum of points when the price goes up divided by sum of points when the price goes down (green color). The correlation between the number of ticks and the number of points for each and every minute will give enough data for scalping.

This indicator calculates the next possible bar for each currency pair and timeframe. If the next possible Close will be greater than Open, the next possible bar will be in Aqua color. If the next possible Close will be less than Open, the next possible bar will be in Orange color. Of course, the next possible bar will not show the big price movement. This indicator is most useful in the quiet time.
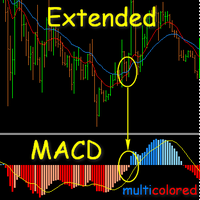
Eine erweiterte Version des bekannten Indikators Moving Average Convergence / Divergence (MACD), verteilt in 4 Farben: Wachstum, Fall über und unter 0. 26 Optionen zum Glätten von gleitenden Durchschnitten, 11 Preisarten. Deaktivierte Warnungen bei Farbwechsel mit wählbarer Alarmmodus: nur beim Überschreiten eines Nullwertes oder bei jedem Farbwechsel (steigender / fallender Wechsel und 0-Durchgang). Glättungsoptionen: Einfach, Exponential, Wilder Exponential, Linear Weighted, Sinus Weight

The Zig-Zag indicator is extremely useful for determining price trends, support and resistance areas, and classic chart patterns like head and shoulders, double bottoms and double tops. This indicator is a Multi Time Frame indicator. The indicator is automatically calculate the 3 next available TF and sows ZigZag from those TimeFrames. You cannot use this indicator for the TF greater than D1 (daily). You have to have ZigZag indicator in the Indicators/Examples tab.

Many indicators are based on the classical indicator Moving Average . The indicator All_TF_MA shows crossing of 2 MA from each TimeFrames . You will be able to change main input parameters for each MA for every TF. Example for M1 TF: Period1_Fast = 5 Method1_Fast = MODE_EMA Price1_Fast = PRICE_CLOSE Period1_Slow = 21 Method1_Slow = MODE_SMA Price1_Slow = PRICE_TYPICAL

This indicator is based on the classical indicator CCI (Commodity Channel Index) and will be helpful for those who love and know how to use not a visual but digital representation of the indicator. All TimeFrames CCI MT5 indicator shows values from each timeframe. You will be able to change the main input parameters for each CCI for every TF. Example for M1: sTF1_____ = "M1"; Period1 = 13; Price1 = PRICE_CLOSE.

This indicator is based on the classical STOCHASTIC indicator and will be helpful for those who love and know how to use not a visual, but digital representation of the indicator. All TimeFrames Stochastic MT4 indicator shows values from each timeframe (M1, M5, M15, M30, H1, H4, D1, W1 and MN1). You will be able to change the main input parameters for each Stochastic from every TF. Example for M1: sTF1_____ = M1 K_Period1 = 5 D_Period1 = 3 S_Period1 = 3 Method1 = MODE_EMA

This indicator is based on the classical indicator Parabolic SAR and will be helpful for those who love and know how to use not a visual, but digital representation of the indicator. All TimeFrames PSAR MT5 indicator shows values from each timeframe (M1, M5, M15, M30, H1, H4, D1, W1 and MN1). You will be able to change the main input parameters for each Stochastic from every TF. Example for M1: sTF1 = M1 pStep1 = 0.02 pMax1 = 0.2

Knowledge of the strength and weakness of each currency is vital for every forex trader. Our Currency Strength Meter indicator measures the strength of eight major currencies (USD, EUR, GBP, CHF, JPY, CAD, AUD, NZD) by using the Relative Strength Index indicator, also known as RSI. The Currency Strength Meter indicator shows you, simply and quickly, when a currency is oversold, overbought, or in "normal area". This way, you can identify which currency is the strongest and the weakest.
Our

This indicator is based on the classical indicator RSI (Relative Strangth Index) and will be helpful for those who love and know how to use not a visual but digital representation of the indicator. All TimeFrames RSI MT5 indicator shows values from each timeframe. You will be able to change the main input parameters for each RSI for every TF. Example for M1: sTF1_____ - label (string) of M1 TF. Period1 - number of bars used for the indicator calculations. Price1 - price used. Can be any of the p

Dies ist ein MTF-Indikator für Unterstützungs- und Widerstandsniveaus basierend auf den Extremwerten des Advanced ZigZag Dynamic und/oder Extended Fractal Indikators mit Preisetiketten (kann deaktiviert werden). Für den MTF-Modus können höhere TFs ausgewählt werden. Standardmäßig werden die Ebenen basierend auf ZigZag-Indikatorpunkten generiert. Fraktale Indikatorpunkte können auch zusammen mit ZigZag oder stattdessen verwendet werden. Um die Verwendung zu vereinfachen und CPU-Zeit zu sp

The Volume indicator is an excellent tool for measuring tick volume or real volume activity. It quickly and easily helps traders evaluate the volume's current size. The indicator for classification of the volume size uses the moving average and its multiples. Accordingly, the area where the volume is located (relative to the moving average) is labeled as ultra-low, low, average, high, very high, or ultra-high. This indicator can calculate the moving average by four methods: SMA - Simple Moving

The ATR indicator is a helpful tool for measuring the range of bars. It quickly and easily helps evaluate the ATR's current spread (range), which is especially useful for VSA traders. The indicator for classifying the range of bars (candles) uses the moving average and its multiples. Accordingly, the area where the volume is located (relative to the moving average) is labeled as ultra-low, low, average, high, very high, or ultra-high. Our ATR indicator is rendered as a histogram. This indic
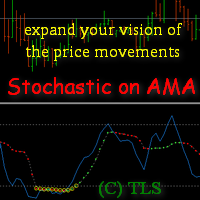
Ich biete einen Stochastischen Indikator (Oszillator) mit Signallinienfilterung mittels Adaptive Moving Average (АМА) an. Ich habe auch eine Funktion der mehrfarbigen Signallinienanzeige hinzugefügt, die nach Belieben mit Linien oder Punkten erhöht und verringert wird. Darüber hinaus können Sie Signallinienwerte hervorheben, die sich unterhalb des angegebenen Mindestpegels oder über dem angegebenen Maximalpegel befinden. Parameter: PeriodK - Periode K des stochastischen Oszillators Slowing -
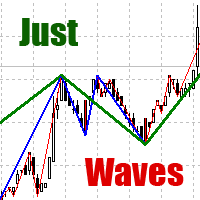
Among various methods of technical analysis of the Forex market, wave analysis is a fundamental one. Anyway, when it comes to the price change over a period of time, we are dealing with waves. According to Elliott's theory, waves are formed in a fractal way. On the same principle MT5 indicator Just Waves marks up waves of different levels (up to 8) and creates graphic lines indicating the beginning and ending points of the waves. Just Waves offers an objective criterion of a wave, thereby uncove

The Classic Pivot Points indicator is fully configurable and can be adjusted to work in different ways. If you are a manual trader and prefer a clean chart, you can configure the indicator so that it only draws pivot points for the current session. Otherwise if you are developing an expert advisor that uses pivot points, you can configure the indicator to show historical pivot points as well. Another unique feature of this indicator is that, when calculating daily pivots, it is possible to set a
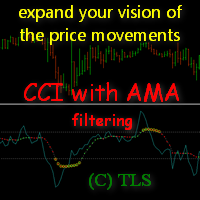
Je vous propose un indicateur Commodity Channel Index (CCI) (oscillateur) avec une filtration supplémentaire au moyen de la moyenne mobile adaptative (АМА). Cet indicateur technique détermine la force ou la faiblesse des tendances haussières et baissières. Son principe repose sur l'analyse de l'évolution actuelle de l'écart du prix par rapport à sa valeur moyenne pour une période donnée avec le filtrage des valeurs obtenues à l'aide de l'algorithme de Kaufman, construit sur la base d'une moyenne

The Camarilla Pivots indicator is fully configurable and can be adjusted to work in different ways. If you are a manual trader and prefer a clean chart, you can configure the indicator so that it only draws camarilla pivot points for the current session. Otherwise if you are developing an expert advisor that uses pivot points, you can configure the indicator to show historical camarilla pivots as well. Another unique feature of this indicator is that, when calculating daily camarilla pivots, it

The Currency Barometer indicator is a unique tool that measures the strength of two currencies represented in the pair and compares the difference between them. The result is shown as a histogram where you can simply identify which currency is the strongest. This indicator is designed to measure the strengths and weaknesses of eight major currencies (USD, EUR, GBP, CHF, CAD, JPY, AUD, and NZD) and works on 28 currency pairs. The indicator uses the CI method (Commodity Channel Index) to calc

HiLo Activator v1.02 by xCalper The HiLo Activator is similar to moving average of previous highs and lows. It is a trend-following indicator used to display market’s direction of movement. The indicator is responsible for entry signals and also helps determine stop-loss levels. The HiLo Activator was first introduced by Robert Krausz in the Feb. 1998 issue of Stocks & Commodities Magazine.
Erfahren Sie, wie man einen Handelsroboter im MetaTrader AppStore, dem Shop für Applikationen für die MetaTrader Handelsplattform, kaufen kann.
Das Zahlungssystem der MQL5.community ermöglicht Zahlungen mit PayPal, Kreditkarten und den gängigen Zahlungssystemen. Wir empfehlen Ihnen eindringlich, Handelsroboter vor dem Kauf zu testen, um eine bessere Vorstellung von dem Produkt zu bekommen.
Sie verpassen Handelsmöglichkeiten:
- Freie Handelsapplikationen
- Über 8.000 Signale zum Kopieren
- Wirtschaftsnachrichten für die Lage an den Finanzmärkte
Registrierung
Einloggen
Wenn Sie kein Benutzerkonto haben, registrieren Sie sich
Erlauben Sie die Verwendung von Cookies, um sich auf der Website MQL5.com anzumelden.
Bitte aktivieren Sie die notwendige Einstellung in Ihrem Browser, da Sie sich sonst nicht einloggen können.