 MetaTrader 5
 Experts
 Indicatori
 librerie
 Utilità
 Widget
 Regole
Guarda i video tutorial del Market su YouTube
Come acquistare un Robot di Trading o un indicatore
Esegui il tuo EA
hosting virtuale
hosting virtuale
Prova un indicatore/robot di trading prima di acquistarlo
Vuoi guadagnare nel Market?
Come presentare un prodotto per venderlo con successo
Indicatori tecnici a pagamento per MetaTrader 5 - 14
 I segnali degli indicatori tecnici giocano un ruolo cruciale nell'apertura e nella chiusura delle transazioni sui mercati azionari e Forex. L'essenza degli indicatori è una trasformazione matematica del prezzo di un simbolo finanziario, finalizzata alla previsione dei cambiamenti futuri dei prezzi. Prova gli indicatori tecnici, per prevedere al meglio il comportamento del mercato e ricavarne dei guadagni.

Descrizione CustomRSI50 Alert and Mail at Cross è un indicatore tecnico avanzato basato sul popolare Relative Strength Index (RSI), progettato per semplificare il trading automatizzato con notifiche immediate tramite alert e email quando il livello RSI incrocia la soglia 50. L'indicatore fornisce una visualizzazione chiara e personalizzabile dell'RSI, con una particolare enfasi sul livello 50, cruciale per molti trader nell'analisi del momentum. Caratteristiche Principali Invio di alert e notifi

CHoCH + BOS + Hacim Profili — Akıllı Piyasa Yapısı Göstergeleri Gerçek zamanlı piyasa yapısı dağılımı ve canlı hacim analiziyle birleştirilmiş bu gösterge sayesinde piyasa yapısı değişiklikleri (CHoCH) ve yapı kırılmaları (BOS) sinyallerini hem salınım hem de iç yapı üzerinde otomatik olarak tanımlar, emir bloklarını, eşit yüksek/düşük seviyeleri ve likidite hareketlerini işaretler ve alıcı ve bunların en aktif olduğu yerlerde tam olarak canlı bir Hacim Profili görüntüler.
"The price will be u

Fixed Range Volume Profile is an MT5 volume analysis tool that calculates and displays volume distribution across any custom price and time range using standard chart trendlines for Forex, Gold (XAUUSD), Indices, and Crypto. Designed for day trading, scalping, and swing trading, this indicator automatically maps the Point of Control (POC), Value Area boundaries (VAH/VAL), and high-volume support and resistance levels without requiring manual object naming or complex setup. Core Volume Profile Ar

Multi Timeframe Buy and Sell Power Pro MT5
The "Multi Timeframe Buy and Sell Power Pro" indicator for MetaTrader 5 is a versatile tool designed to provide traders with a clear visual representation of market pressure across nine standard timeframes, from M1 to MN1. By aggregating buy and sell strength percentages derived from recent price action and tick volume, it helps identify potential trends, reversals, and neutral market conditions in real-time.
The indicator displays this information in a
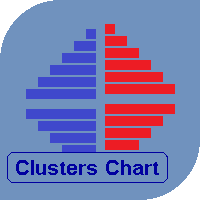
The indicator displays volume clusters or volume profiles to choose from. For trading symbols which contain the tape of deals, the indicator can perform calculations based on the tape of deals.
Input variables
StepPoint - cluster step in points, if the value is zero, the step is assigned automatically. HistoryTicks - size of tick history (for VolumeType in the mode TimeAndSales). AssociatedTimeframe - binding the indicator to the specified timeframe of the chart, if the value is equal to Cu

MTF Candle Panel displays real multi-timeframe candlesticks in a compact side panel on your chart, allowing you to instantly see price action from higher and lower timeframes without switching charts . Each timeframe is shown in its own row with properly scaled candles, so you get an accurate visual of structure, direction, and momentum at a glance. MT4 Version - https://www.mql5.com/en/market/product/163704/ Join To Learn Market Depth - https://www.mql5.com/en/channels/suvashishfx How it

Ornstein–Uhlenbeck Z-Score Regime Suite Discover not only the deviation, but whether the movement still has enough strength to continue. Two movements can reach the same Z-Score while representing completely different conditions. One may be ready to return to the mean, while the other may be developing persistence and lasting far longer than expected. The suite applies the Ornstein–Uhlenbeck process to the normalized series, combining three essential dimensions: distance, persistence, and revers

Dashboard MTF Candle Size Projection for MetaTrader 5 Dashboard MTF Candle Size Projection is a powerful, lightweight, non-repainting multi-timeframe analytical matrix for MetaTrader 5 . It calculates dynamic candle volatility metrics (Average Shadow Rejection and Average Body Size) over a user-defined historical lookback period to project critical real-time breakout, re-entry, and target levels across all 9 standard timeframes simultaneously ( M1 to MN1 ) . Designed for high-frequency scalpers
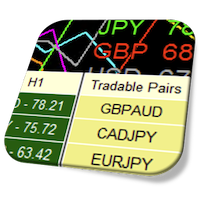
Currency Strength Meter is the easiest way to identify strong and weak currencies. This indicator shows the relative strength of 8 major currencies + Gold: AUD, CAD, CHF, EUR, GBP, JPY, NZD, USD, XAU. Gold symbol can be changed to other symbols like XAG, XAU etc. By default the strength value is normalised to the range from 0 to 100 for RSI algorithm: The value above 60 means strong currency; The value below 40 means weak currency;
This indicator needs the history data of all 28 major currency
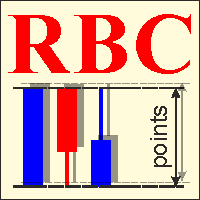
RBC Range Bar Chart is a classical range bar chart indicator. The indicator features price ranges for charting: High/Low price range is a classical option for analysis. It also has Open, High, Low and Close prices. In the first option, two price values are analyzed at the same time, while other options only use one price. Conventionally, range bars are drawn using tick data but since tick data is not available on the server, charting is only possible based on bar data from standard time frames.
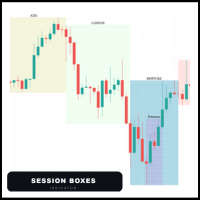
Session Boxes automatically draws the high and low range of up to 10 fully customizable trading sessions directly on your chart.
Each box captures only the candles that open within that session time range. This means the boxes are always precise regardless of the timeframe — whether M1, M5, H1 or H4, the candles always stay inside the box.
MAIN FEATURES
- Up to 10 fully customizable sessions - Works perfectly on any timeframe - Each session has its own name, color, start hour and end hou

Smart Divergence Finder Indicator In-depth Analysis: A Practical Guide to Trend, Divergence, and Resonance Indicator Introduction Smart Divergence Finder is an intelligent main-chart comprehensive indicator designed for MT4/MT5 platforms. It overcomes the fragmented limitations of traditional sub-chart divergence analysis by integrating: Trend determination Multi-indicator divergence detection Intelligent signal filtering All key trading signals are displayed directly on the price chart. Its co
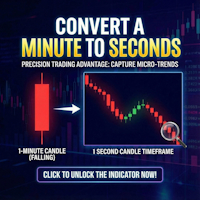
Second Timeframe Pro — See the Market Before Anyone Else!
Unlock a Hidden Level of Price Action
While other traders look at minute candles, you can see 60 candles within each minute!
What is Second Timeframe Pro?
It's a revolutionary indicator that creates full-fledged candlestick charts with second timeframes directly in MetaTrader 5.
Standard MT5 limits you to a minute chart. But the market doesn't stop every minute — it pulsates every second. Second Timeframe Pro removes this limitation

The well-known ZigZag indicator that draws rays based on the "significant movement" specified by the pips parameter. If a ray appears, it will not disappear (the indicator is not redrawn), only its extremum will be updated until the opposite ray appears. You also can display text labels on each rays describing the width of the ray in bars and the length of the ray in points.
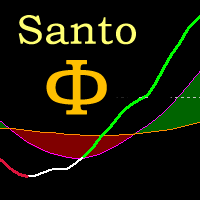
Oscilador bem próximo que o indicador SANTO mostrado pelo Bo Williams em sua metodologia PhiCube, para mim este indicador ainda é melhor que o próprio SANTO original. Ótimo para entender a força e tendência de movimentos e possíveis divergências. Preço fazendo topo e o SANTO não renovando máxima, tudo indica que teremos uma reversão ou no mínimo um drawback.
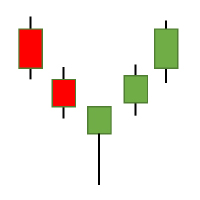
The Candlestick Patterns indicator for MT5 includes 12 types of candlestick signales in only one indicator. - DoubleTopsAndBottoms - SmallerGettingBars - BiggerGettingBars - ThreeBarsPlay - TwoBarsStrike - Hammers - InsideBars - OutsideBars - LongCandles
- TwoGreenTwoRed Candles - ThreeGreenThreeRed Candles The indicator creats a arrow above or under the signal candle and a little character inside the candle to display the type of the signal. For long candles the indicator can display the exact

RSI Arrow1 is an arrow indicator based on the RSI, is easy to use; no internal adjustments to be made. the user can change the indicator period as desired in the settings. It can be used on all markets but it will all depend on your Trade strategy. There is no better Time Frame for its use; the use will depend on the Trader himself.
Settings:
RSI Period Push Notification Email Notification Audible Alert Down levels Up levels
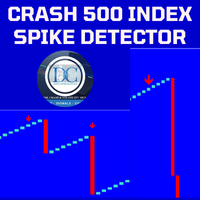
Spike Detector for Boom and Crash Indices
The Spike Detector is specifically designed to cater to the unique needs of traders in the Boom and Crash indices markets. Optimized for M1 (1-minute) and M5 (5-minute) timeframes, this tool ensures you receive timely and actionable insights. Below, you'll find a comprehensive guide on its key features, advantages, installation process, and how to use it effectively.
Key Features and Advantages
1. Non-Repainting: The Spike Detector guarantees accurac
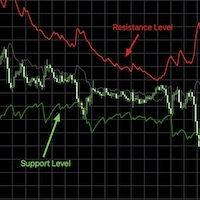
RSI bands provide an intuitive and visual method of understanding how price movements influence the Relative Strength Index (RSI) within its bounded range of 0 to 100. The upper and lower bands typically represent key thresholds—commonly set at 70 and 30—which signal potential overbought or oversold conditions. When RSI approaches or crosses these bands, it may indicate that a reversal or pullback is likely, helping traders identify potential entry or exit points. By plotting these bands on a c

Speed Alert is a professional volatility-based indicator designed to detect fast market movements and high-speed candles in real-time. When the market suddenly accelerates and a candle moves with abnormal speed compared to recent price action, Speed Alert instantly notifies the trader.
The indicator continuously analyzes recent candles to calculate the average price speed. When the current candle exceeds the defined speed threshold, it indicates strong momentum and increased volatility, which

By installing this indicator you can create a price alert line with a click of a button A = create a price alert line at the location of your mouse pointer ( no number limit ) S = delete all existing price alert lines D = delete all triggered price alert lines F = delete the line near your mouse pointer( updated vertion)
some times the S and D hot hey function may not work, just double click on the the chart and try again or try switching between charts and try again, its some kind of mt5 bug

The Non Repaint Buy/Sell Signals QCL MT5 Indicator is a powerful trading tool built on mathematical analysis. This software reduces chart noise avoids confusion when making trading decisions and provides clear market signals directly on MetaTrader 5 without repainting. Special launch discount price. Final price $149 Indicator User Manual User Manual Asset: XAUUSD Timeframe: 15 Minutes, We doing manual trading upon the signals sent by our Indicator Core Quantitative Architecture Adaptive Momentum

ATR Stop Loss Finder automatically calculates and displays dynamic stop loss levels on your chart based on the Average True Range indicator. The tool helps traders place logical, volatility-adjusted stop loss orders rather than relying on fixed pip values or arbitrary price levels.
The indicator plots two lines directly on the chart: an upper line for short positions and a lower line for long positions. Both lines update in real time with each new bar. A small information panel

Apex Market Structure is a complete Smart Money toolkit that maps market structure, order blocks, liquidity and multi-timeframe trend in real time, directly on your chart. It is built for traders who read price action the way institutions do: structure breaks, liquidity sweeps, and reaction zones, all detected automatically and confirmed at bar close.
Everything is drawn for you. No manual line drawing, no guesswork, no second indicator needed.
How It Works
The indicator con

Laser Trend Scalping Pro draws a bright neon laser trend line through the middle of the candles - green for an uptrend, red for a downtrend - and turns it into a complete, rule-based trade plan you can read at a glance.
On top of the swing pivots and the white trend-flip arrows, when the laser and the trend gate agree the indicator decides a trade and auto-draws it on the chart: ENTRY, STOP, TP1, TP2 and a dynamic EXIT, for both longs and shorts. A side panel shows the live result and the trade

VG INDICATOR
Three independent strategy engines read every closed bar. They vote. Only when they agree does VG Indicator print a signal -- and it tells you exactly how strong that agreement was.
Most signal indicators give you an arrow and nothing else. VG Indicator gives you the arrow, the entry price, the stop, a three-level target ladder, a graded confidence score, and a live dashboard that scores its own past calls on your chart, from your broker's own price history.
-------------------

ALMA Market Structure Buy Sell Signals
ALMA Market Structure Buy Sell Signals is a MetaTrader 5 indicator that combines an adaptive ALMA trend wave, BOS and CHoCH market structure analysis, confirmed swing Buy and Sell markers, smart candle coloring and a dynamic -2.5 standard deviation target.
The indicator is designed to provide several layers of price-structure information directly on the chart without automatically opening or managing trades.
Its main purpose is to help traders evaluate

HalfTrend Risk Target Signals
HalfTrend Risk Target Signals is a MetaTrader 5 trend indicator that combines a HalfTrend trend engine, ATR-based volatility channels, confirmed LONG and SHORT reversal signals, and predefined Entry, Stop Loss, TP1, TP2 and TP3 reference levels for the symbol of the current chart.
The indicator works only with the chart symbol. It does not request or depend on external symbols, making it suitable for brokers that use different symbol lists or naming conventions.

### 1. General Overview Breakout Divergent Scanner is an automated multi-currency and multi-timeframe analytical dashboard developed for the MetaTrader 5 (MT5) platform. The indicator functions as an operational technical scanner designed to detect momentum divergence between price action and the Relative Strength Index (RSI) across multiple financial instruments and chart periods simultaneously. In technical analysis, identifying momentum exhaustion and trend-continuation setups across multipl

1. Overview The UT Bot Scanner Dashboard is a multi-pair and multi-timeframe technical analysis scanner indicator developed for MetaTrader 5 (MT5). It is designed to assist traders in identifying price trend shifts and directional momentum setups across multiple financial instruments and timeframes simultaneously. The underlying engine utilizes the UT Bot trailing stop algorithm combined with a set of 17 optional confluence filters, dynamic Stop Loss (SL) distance calculations based on Average T

CCI MultiFilter Overbought Oversold Signal Pro MT5 Technical Specification & Operational Manual 1. Overview and System Identity CCI MultiFilter Overbought Oversold Signal Pro MT5 is an institutional-grade technical analysis indicator engineered natively for MetaTrader 5. Developed for quantitative analysts, systematic manual traders, and multi-asset operators, the system provides an objective algorithmic framework to identify cyclical market extremes, momentum shifts, and structural trend cont

CRT Pro Scanner Stop wasting hours watching multiple charts and missing setups while you blink. CRT Pro Scanner solves the most painful problem every trader faces: being in the wrong chart at the right moment. Instead of jumping between pairs and constantly asking yourself "did I miss something?", the scanner does the watching for you. It monitors all your symbols simultaneously, detects Candle Range Theory setups the instant they form, and alerts you immediately — so you can focus on executi

This script provides basic pivot point Support and Resistance Levels to the user whilst displaying Break signal tags. It also has the ability to let the user display more significant breaks by filtering using the Volume Oscillator.
Only more significant breaks of these basic levels are displayed to the user when optimized which avoids noise and messy signals.
It will also display breaks with candles it deems to be bullish (e.g. having a longer upper or lower wick).
Notation
The notation
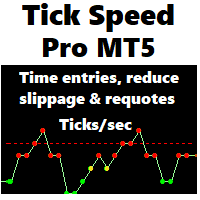
Tick Speed Pro povides a charted record of tick speed to allow you to see the ebb and flow of market activity. Observing patterns in tick speed may allow you to better time entries to reduce slippage and re-quotes.
The tick speed plot updates it's entire position to show you only the last N seconds you choose, ideal for scalping and HFT approaches. An alert is provided to signal when the instrument is getting ticks at a higher rate than the alert limit. Multiple loadings are supported to compare

QM Hunter - Quasimodo Pattern Detector with SMC Confluence ========================================================== QM Hunter detects Quasimodo (QM) reversal patterns on any symbol and timeframe, confirms them with a reversal candle gate, and scores each signal against three Smart Money Concepts (SMC) confluence factors — Fair Value Gap, Order Block, and Liquidity Sweep — that must have actively interacted with price before the signal fires. The result is a three-tier graded signal (A / B /

Kito Quad Momentum Rotation Scanner Multi-symbol and multi-timeframe scanner for Kito Quad Momentum Rotation setups, with staged status tracking, closed-bar alerts and clickable chart rows.
SPECIAL OFFER: Purchase this scanner and send me a private message to claim your FREE bonus indicator( Kito Quad Momentum Rotation Indicator ) .
Kito Quad Momentum Rotation Scanner monitors selected Market Watch or custom symbols across multiple timeframes. It applies the embedded four-speed momentum engin
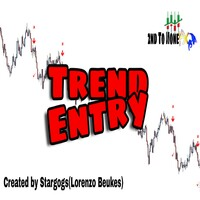
Trend Entry Indicator Your Trading will Be easier with this indicator!!! This Indicator is Developed To make our trading life easier. Get an Arrow for Entry with Take Profit and Slop Loss marks on chart. - Indicator is Based on trend, because thats what we all want we want to follow the trend "it's our friend". - Based on Levels, price action and oscillators. - It works on all currency pairs, all indices, metals and stock. - it works on all pairs/indexes on Deriv including Boom and Crash. - Tim
Why the RSI Alert Indicator is Essential for Your Trading Toolkit
In the fast-paced world of trading, timely and accurate information is crucial. The RSI Alert Indicator is a powerful tool designed to help you stay ahead of the market by providing real-time alerts when the Relative Strength Index (RSI) reaches critical levels. Whether you're a novice trader or a seasoned professional, this indicator can significantly enhance your trading strategy by pinpointing potential market reversals with

Nadaraya-Watson Envelope Indicator for MT5 Overview
This indicator expands on the original Nadaraya-Watson smoothing methods by introducing a dynamic envelope system built using kernel regression. Unlike the standard Nadaraya-Watson estimator, this tool applies a contrarian approach: the envelope boundaries are designed to identify potential reversal zones when price extends too far from its smoothed trend estimate. The indicator includes integrated alerts based on price crossings above or belo

VWAP Trend Dashboard
What It Does
Displays a compact dashboard on any MT5 chart showing the VWAP-based bias for up to 5 symbols simultaneously. For each symbol it checks the current price against four VWAP levels and summarises the overall directional bias in a single Trend column.
Dashboard Columns
Symbol: Your custom display label NY VWAP: VWAP anchored at NY session open today Day VWAP : VWAP anchored at 00:00 server time today LOD : VWAP anchored from today's Low-of-Day bar forw
Tired of drawing opening range breakout line? Maximize your trading potential with the Range Breakout Indicator and the Opening Range Breakout (ORB) Indicator for MT5, two essential tools designed to enhance your trading strategy and boost your market performance. These powerful indicators allow you to profit from the explosive price movements that often occur at the opening of major stock indices, such as the DAX, DOW, NASDAQ, and S&P500. By leveraging the Opening Range Breakout Indicator, you

The indicator displays in a separate window a price chart as Heiken Ashi candlesticks with a periodicity below a minute. Available periods (seconds): 30, 20, 15, 12, 10, 6, 5, 4, 3, 2, 1. It is possible to select the base price for calculations.
Parameters Time frames - the period of candlesticks in seconds. Price levels count - the number of price levels on a chart. Applied price - the price used in calculations. Buffer number: 0 - Heiken Ashi Open, 1 - Heiken Ashi High, 2 - Heiken Ashi Low, 3

Definition Supertrend is a trend-following indicator based on Average True Range ( ATR ). The calculation of its single line combines trend detection and volatility. It can be used to detect changes in trend direction and to position stops. History The Supertrend indicator was created by Olivier Seban. Calculations To calculate bands of the Supertrend, use the following formulas: hl2 = (high + low) / 2 basicUpperBand = hl2 + (multiplier × ATR) basicLowerBand = hl2 - (multiplier × ATR) upperBand
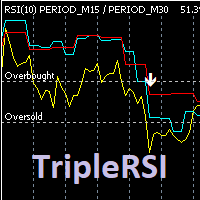
Индикатор отображает на графике данные RSI рабочего и двух старших тайм-фреймов, формирует сигналы выхода из зоны перекупленности / перепроданности кривой среднего временного периода. Опционально используется фильтр по данным старшего тайм-фрейма (расположение медленной линии выше средней для продажи и ниже средней - для покупки). Сигналы "подвального" индикатора дублируются на главном окне, отправляются сообщения во всплывающее окно, на почту и на мобильное устройство. Параметры индикатора: RSI

The CRT Indicator is a precision price-action tool designed to identify CRT candles , which represent key moments of market manipulation and reversal. This indicator highlights candles that show strong liquidity grabs , false breakouts, and aggressive rejections—often seen before major directional moves. The CRT Indicator helps traders spot high-probability reversal zones by detecting candles with clear wick expansion, strong displacement, and institutional-style price behavior. These candles fr

Cardwell Range Analyze reads trend from the range the RSI holds, not from a fixed overbought or oversold line. Andrew Cardwell's observation was that in a genuine uptrend the RSI oscillates inside a higher band and rarely breaks below it, while in a downtrend it works a lower band and rarely breaks above — so the band the RSI is respecting is itself the trend signal. This indicator turns that reading into a confirmed regime, colours the chart by it, and projects a full ATR trade the moment the r

PrimeScalping is a powerful trading companion designed to generate high-probability entry signals with dynamic TP/SL/DP levels based on volatility. Built-in performance tracking shows win/loss stats, PP1/PP2 hits, and success rates — all updated live.
Key Features: Buy/Sell signals with adaptive volatility bands Real-time TP/SL/DP levels based on ATR Built-in MA Filter with optional ATR/StdDev volatility Performance stats panel (Success, Profit/Loss, PP1/PP2) Alerts via popup, sound, push, or e

NeuronBreakout identifies volatility compression before the market expands. It waits for price to contract, anchors a breakout range to the most recent confirmed swing, tracks that range until price closes beyond it, then projects a complete trade with entry, ATR-based stop loss, and three R-multiple profit targets. Every completed breakout remains frozen on the chart, allowing you to review past setups exactly as they formed. It is an indicator for chart analysis only: it draws on the chart, it

Introducing the Kangaroo Hunter - Your Ultimate Edge in Forex Trading ATTENTION Forex Traders! Are you in constant pursuit of high-probability trade setups? Or maybe you're a novice trader struggling to pinpoint precise entry and exit points? Our solution, the Kangaroo Hunter, is about to revolutionize your trading journey. This meticulously designed indicator simplifies and refines the art of identifying the often elusive Kangaroo Tail patterns in the Forex market, pushing your trading strateg

Introducing Auto Trendline Pro : Your Ultimate Trading Companion Are you tired of manually drawing trendlines on your forex charts? Do you wish for a tool that can simplify your trading while providing timely alerts? Look no further, because Auto Trendline Pro is here to revolutionize your trading experience. In the fast-paced world of forex trading, staying ahead of the curve is essential. Identifying trends, both upward and downward, can be a game-changer. This is where Auto Trendline Pro ste

This indicator allows you to display specified Moving Averages (MAs) across multiple timeframes on a single chart. By defining your desired MAs in the settings, they will be consistently displayed in multi-timeframe (MTF) regardless of the current chart timeframe you switch to. You can freely customize the timeframe for each MA and toggle their visibility individually via the settings. When an MA goes off-screen, its label is pinned to the top or bottom edge of the chart. This allows you to ins

Read detailed blogpost here: https://www.mql5.com/en/blogs/post/772233
Features at a Glance Linear regression center line with statistically accurate curved deviation bands Three band calculation modes: RMA of High-Low Range, Standard Deviation, and True ATR Candle coloring in two modes: Heatmap (position inside the bands) and Volume-Weighted Colored Bars (VWCB) Straight regression channel (Channel 1) with up to 3 deviation levels Future projection channel (Channel 2) with optional Higher Timef

Harmonic Pattern Scanner — Gartley, Bat, Butterfly, Crab (Auto XABCD Detection) Stop manually plotting Fibonacci retracements on every swing. This indicator scans your chart in real time, identifies X-A-B-C-D structures, and tells you exactly which harmonic pattern is forming — Gartley, Bat, Butterfly, or Crab — with entry, stop loss, and four take-profit targets calculated automatically. What it does Detects confirmed harmonic patterns the moment a D-point swing closes, and previews forming pat

FlowSeeker is a custom technical indicator for MetaTrader 5 (MT5), developed by Ultron Trading Solutions ( www.ultrontradingsolutions.co.za ). It is designed to identify momentum shifts and directional changes in the market through two primary signals. Providing visual plots, optional buy/sell arrows, reversal crosses, a multi-timeframe trend panel, a candle timer, and alert notifications. It includes user-configurable settings for signals, plotting, trend trading filters, alerts, and display op

Expert Market Edge is scalping, trending, reversal indicator, with alerts . You can use it all and fit with your strategy whatever it fits you. My recommendation is to combine with my Colored RSI , and when 2 signals are matched, and pointing same direction (for example buy on this indicator, and green on RSI, you can take a long position, stop loss should be last local low, if you want to be more conservative, add ATR. ) you can take position. If you using moving averages, that's even better i

CRT Scanner MTF is a specialized indicator for traders who use the CRT — Candle Range Theory strategy. Its main purpose is to scan multiple timeframes in order to detect Mother Candles, R candles and active CRT ranges , helping traders identify which structures are currently active and which ones are aligned across different timeframes. The indicator can scan up to 9 configurable timeframes at the same time. On each selected timeframe, it searches for relevant CRT ranges and identifies four main

This indicator is best used for Trend Riding . It ensures that you only enter trades when both the short-term momentum and the medium-term trend are aligned, significantly reducing the risk of being caught in a trend reversal or a flat market. Neutral Zone Protection: When the price is stuck between (a "mixed" or sideways market), the indicator hides all signals . This keeps your chart clean and prevents trading in choppy, undecided conditions. Real-Time Dashboard: A text display in the
Trend Scanner is a trend indicator that helps to determine the current and forecast market direction using an advanced algorithm. Thanks to flexible alert settings, the indicator will promptly warn you about a trend reversal. The indicator is intuitive and easy to use, and will be an excellent filter in your trending trading strategies. The lines of this indicator are also an excellent dynamic level for stop loss, and is used as one of the types of trailing stop in Trading Panel . To fine-tune t

Accurate Buy Sell Pro System is a clean and reliable swing-based indicator designed to identify trend reversals and entry zones with high precision. The algorithm follows the original “Accurate Swing Trading System” concept from TradingView (by ceyhun) and has been fully re-engineered for MetaTrader 5. 1:1 match with TradingView behavior
Works on all symbols and timeframes
Clean non-repainting signals when used after candle close
Visual BUY/SELL arrows + colored dynamic trendline
This is a multi-symbol, multi-timeframe, table-based indicator for MetaTrader 5 that identifies 46 types of candlestick formations. Each formation has its own image for easier recognition. The indicator includes popular patterns such as Engulfing, Hammer, Three Line Strike, Piercing, and Doji-like candles. You can check the full list of patterns in the screenshots below. Also you can not only switch all bearish or bullish patterns from input, but also select formation for a specified symbols and
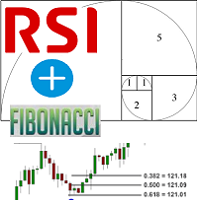
Fibonacci and RSI.
The indicator is a combination of the Fibonacci and RSI indicators.
Every time the price touches one of the fibonacci levels and the rsi condition is met, an audible alert and a text alert are generated.
Parameters number_of_candles : It is the number of candles that will be calculated. If you put 100, the indicator will give you the maximum and minimum of the last 100 candles.
sound_signal: If you want the indicator to notify you that the conditions are met using an aud

FoxWave EdgeSnap — Multi-Timeframe Reversal Scanner with Quality Filter FoxWave EdgeSnap by Fox Wave watches your symbol across every timeframe simultaneously and flags the exact moment price breaks outside its dynamic volatility envelope and snaps back inside — a well-known mean-reversion pattern — then runs each signal through a quality filter before it ever reaches your eyes, so you're not chasing every minor wobble. Key features: Multi-timeframe scan (M1 through MN1, fully toggle-able) — one

Bubbles — order flow bubbles + CVD
Tick-level order flow made visible: every trade becomes a bubble, cumulative delta reads in a separate window. Short description Bubbles plots real order flow directly on the chart: one bubble per trade, size scaled to volume, colour set by the aggressor side. A sub-window tracks session cumulative delta, exposing divergence and absorption as they build. Full description Bubbles reads the native tick stream ( TICK_FLAG_BUY / TICK_FLAG_SELL , volume_real ) a

Volume profile indicator that tells you which levels price is likely to reach today. Daily profiles with POC, VAH and VAL, naked POCs and a drag box for any range, and every level labelled with how often price reached a level at that distance on your own chart. What you see on the chart A profile for every day on M1 to H1 charts, with the value area in a stronger colour. Yesterday's POC, VAH and VAL across today, each with its odds for today, or "reached" once price gets there. Naked POCs: earli

Adaptive trend indicator with 6 selectable trading styles, built-in multi-timeframe (massive update to v3!)
Confluence Edge is a trend-following indicator for MetaTrader 5 built around one idea: a signal is only as good as the context around it. Instead of a single fixed moving average, it lets you choose how the trend engine behaves, confirms every reading against a higher timeframe and against intraday/weekly price levels, and scores its own confidence — all from one chart, one indicator ins

Woodie CCI System
The Woodie CCI System is a complete, standalone trading framework that eliminates chart noise and guesswork. Built on Ken Wood’s methodology, it combines the fast Turbo CCI (6), slow CCI (14), dynamic histogram trend colors, and key horizontal levels into a single optimized indicator.
Core Trader Questions Answered
What is the current trend? Answered by the automated histogram. The color shifts only after the signal stays on one side of the zero-line for 6 consecutive bars,

Naked Forex Tweezer Pro Indicator Tweezer Pro Indicator is a pattern recognition indicator for Forex, Stocks, Indices, Futures, Commodities and Cryptos.
The standard Tweezer is a two bar pattern. Our enhanced version is a multi-bar pattern. We filter the patterns for you so that you only get the best and most effective patterns and ignore the noise.
The Tweezer pattern is a simple and effective pattern to trade.
The strategy that comes with the Tweezer is based on price action.
The Twe
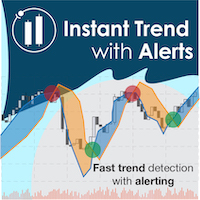
Catch major price movements, early in the trend. Alerts you to enter at the likely beginning of a trend, and if it's incorrect, quickly alerts you to exit to limit any loss. Designed to capture large, profitable price movements, with early entrance to maximize your returns. As shown in screenshots, typical behavior is several quick entrance/exists with small loss , and then capture of a large trend with high profits . The Instantaneous Trend indicator is a lag-reduced method to detect price t

OMNI DEVICE is a complete trading system in one indicator: confirmed BUY/SELL signals, a full trade plan with stop, targets and trailing, and an honest, cost-adjusted track record on a modern on-chart dashboard. Full description OMNI DEVICE – The Complete Trading System in a Single Indicator Most indicators hand you an arrow and leave the hard part to you. OMNI DEVICE goes all the way: it finds the signal, builds the trade plan, manages the stop bar by bar, tells you when to take profit, and the

Footprint Engine Pro is a professional-grade technical analysis tool that provides an "X-ray vision" look inside a standard candlestick. It is designed to reveal hidden market dynamics and track liquidity activity with accuracy and precision.
Three Visualization Modes Bid/Ask (Classic): A comprehensive two-sided profile displaying exact Bid and Ask volumes at each price level, revealing the direct battle between buyers and sellers. Delta (Net Aggression): A focused one-sided profile highlighti
Scopri come acquistare un robot di trading dal MetaTrader Market, il negozio di applicazioni per la piattaforma MetaTrader.
Il sistema di pagamento di MQL5.community supporta le transazioni tramite PayPal, carte bancarie e gli altri sistemi di pagamento più diffusi. Per essere pienamente soddisfatto, ti consigliamo vivamente di testare il robot di trading prima di acquistarlo.

Ti stai perdendo delle opportunità di trading:
- App di trading gratuite
- Oltre 8.000 segnali per il copy trading
- Notizie economiche per esplorare i mercati finanziari
Registrazione
Accedi
Accetti la politica del sito e le condizioni d’uso
Se non hai un account, registrati