Technische Indikatoren für den MetaTrader 5 - 26

Indicator that show candlestick bars with an different sampling method than time fixed. Real time data is sourced to the indicator and it may be used as substitute of the default graph. Each bar is formed when a predefined amount of ticks is received, showing in the graph the OHLC of this clusteri of ticks. The input variable is the amount of ticks of each bar. It's a different approach of sampling, the amount of bars is proportional to the amount of negotiations insted of a sample in a fixed am
FREE

Помощник для торговой системы SystZ . Чертит трендовые линии по соседним экстремумам зигзага. Условие для линии сопротивления - правый должен быть ниже левого. Для линии поддержки - правый выше левого. Не допускается, чтобы между экстремумами, по которым проводится трендовая линии были другие. Экстремумы, удовлетворяющие этим условиям, отмечены символом фрактала. Закрытие свечи за линией - сигнал для открытия позиции.
FREE

Der Martinware Closing Time Alarm Indikator dient dazu, Trader zu warnen, dass die aktuelle Periode (Balken, Kerze) bald enden wird.
Eingabeparameter: Zeitverschiebung: um wie viele Sekunden vor dem Ende der aktuellen Periode der Alarm auslösen muss Warnung mit Ton: informiert, ob die Warnung das Abspielen eines Tons beinhalten soll Soundauswahl: eine Liste der verfügbaren Sounds Benutzerdefinierter Sound: Name der benutzerdefinierten Sounddatei, die verwendet werden soll, falls "benutzerdef
FREE

RSI Currencies is an indicator that is based on the RSI concept but with a totally different approach. It calculates its values calculating all RSI values of all pairs related to the same currency and making an average between them: the goal is to obtain a more solid and trustable information about what each currency are doing lowering the impact of market noise and extreme euphory on a particular pair to analyze the whole basket. It works on 28 forex majors and minor pairs related to these curr
FREE

Good afternoon. Today we offer the maxlottomson indicator to determine the maximum volume that you can put up for purchase or sale, if you look at your deposit level. This indicator is convenient to use for News trading, when you need to determine the entry point on a high-speed movement and calculate the risk level as a percentage of the deposit, the maxlottomson indicator shows the maximum value of the LOT volume for your deposit that you can use for trading.
FREE

This is a multi frame stochastic indicator, you can attach any time frame of stoch indicator on one chart. It is very useful if you like to check multi time frame stoch data. If you are interested in EA,click below links to take a look: https://www.mql5.com/en/market/product/80170 https://www.mql5.com/en/market/product/81136
How to use: > Atach the first time frame you want on to the currency pair's chart > Atach the second time frame you want on to the currency pair's chart > Atach the thir
FREE

The best Vwap Midas coding for Metatrader 5 you can find in White Trader indicators.
The indicator has been optimized not to recalculate (improving performance) and has several visual settings for you to adapt in your own way. TRY IT FOR FREE by clicking the free demo button Where and why to use Vwap Midas (and Auto Zig Vwap Midas) can be used on a variety of indices, currencies, forex, cryptocurrencies, stocks, indices and commodities.
Many successful traders use price and volume to ge

Time And Sales Layout indicator shows traded buy and sell volumes right on the chart. It provides a graphical representation of most important events in the time and sales table. The indicator downloads and processes a history of real trade ticks. Depending from selected depth of history, the process may take quite some time. During history processing the indicator displays a comment with progress percentage. When the history is processed, the indicator starts analyzing ticks in real time. The l

Стрелочный индикатор, выдающий сигнал при пересечении канала боллинждера. Сигналы выдаются в виде стрелок и подходят для торговли бинарными опционами.
Входные параметры Period of BB - период боллинджера Shift of BB - смещение боллинджера Deviation of BB - отклонение боллинджера Inform about finding the signal - параметр, отвечающий за получение уведомлений (Alert) о найденном сигнале. По умолчанию - да
FREE

Бинарный индикатор находит свечной паттерн "Поглощение" и рисует соответствующий сигнал для входа рынок. Имеет встроенные фильтры и панель для просчета количества успешных сделок. Демо версия является ознакомительной, в ней нет возможности изменять параметры. Полная версия . Особенности Работает для всех валютных пар и любых таймфреймов. Индикатор рассматривает комбинацию из 2-х или 3-х свечей в зависимости от настроек. Имеется возможность фильтровать сигналы путем настройки количества свеч
FREE

The euro index (Euro Currency Index, EURX) is an average indicator of changes in the exchange rates of five currencies (US dollar, British pound, Japanese yen, Swiss franc and Swedish krona) against the euro. Displays a Eur X chart in a seperate window below the main chart. YOUR BROKER MUST HAVE THESE SYMBOLS FOR THE INDICATOR TO WORK Based on EUR/USD, EUR/JPY, EUR/GBP, EUR/CHF and EUR/SEK All these pairs must be added to Market Watch for the indicator to work correctly As this is calculated usi
FREE

The RFOC Symbol Background was created to display the name of the asset and the current timeframe in the background of the chart.
Displaying the name of the asset at the bottom of the chart is often used by traders who are designing the screen for spectators, making it easier to identify the asset and the timeframe during a class, for example.
It is available for the user to select the font size (small, medium or large) and select the color for better viewing according to the background colo
FREE

Dynamic Theoretical Stop
Histogram indicator that dynamically analyzes the theoretical Stop levels in real time.
Operation :
The DTS - Dynamic Theoretical Stop does a mapping of fractals in previous candles and suggests two levels of Stop: For purchase and for sale.
Suggested reading :
It is necessary to make the definition of Maximum Stop in points in the Trading Plan. In this way, the trader can decide the best entry point by analyzing the theoretical stop levels:
Stop for sales: S
FREE

This indicator can be used to study the repeating daily volatility structure, and also find deviations from the historical means. Black line tells the average volatility of current hour from last 30 days. Blue bands tell the confidence interval (2 times standard deviation). Red line tells the current volatility, ATR.
Inputs: - days: the number of days where to calculate the average volatility - atrp: the ATR period used to measure volatility
FREE

Indicator for "screenshoting" the chart at a specified interval. The files are saved in the " MQL5\Files\ScreenShots\Symbol TF\ " directory and named as the date and time the screenshot was taken ( 2017.06.20 23.56.24.png ) Settings: Width and Height — width and height of the saved screenshots, IntervalSeconds — the saving interval in seconds. Attention ! If you set a large size for screenshots and a high frequency, you may run out of space on the hard drive. Do not delete the folder where the s
FREE

Utility for show on charts the visual informations about:
- a vertical line at start of each bar of selected timeframe
- a vertical line at start of each day
- a vertical line at start of each week
- vertical lines at start / end of trading sessions selected
- bid / ask prices, spread, money value for each point (of 1 standard lot) and last tick time recived"
You can enable / disable each information and set the color for each line
FREE
Мультивалютный индикатор в отдельном окне отображает движение валютных пар в пунктах с расхождением от начала дня. Во время работы, динамически возможно включать и отключать различные пары прямо на графике. При первом запуске, возможно, потребуется продолжительное время, пока загрузиться история для основных валютных пар. Для валют CAD, CHF, JPY - график перевернут.
При повторном открытии, все настройки индикатора восстанавливаются автоматически.
FREE

Simple candle countdown - never again miss how much time is left to open a new bar!
This indicator doesn't plot any line on the chart - it uses only objects and calculates the time left to open a new bar.
You can set custom colors for the panel background and border and for the text color. Simple as that, the indicator is ready to use.
If you find any bugs, feel free to contact me.
FREE

This indicator's formula is quoted from that [NEW MARKET TIMING TECHNIQUES] by Thomas R. DeMark It consists of setup phase & countdown phase. But not Intersection & TDST. Countdown starts from the first of setup bar. It shows setup count number under the price & countdown number above the price on charts. SETUP: For buy first of setup bar; Close(4 bars ago)> Close(current)&Close(4 bars ago)< Close(previous bar). For sell first of setup bar follows opposite process. From the second bar; Close(4 b
FREE

516/5000 Average volume indicator to calculate the average volume for a given period. Useful as a filter to measure the strength of a trend, or false breaks in support or resistance.
It does not give a signal to buy or sell, it only acts as a filter to avoid entering into transactions with a drop in volume, or below-average volume, which may indicate disinterest in trading at the price level.
It has only the parameters of period, method of calculating the average and type of volume.
FREE

Only Exponential Moving Average at Close Price is used in standard Bulls Power limiting the possibilities of that indicator to some extent. Bulls Power Mod enables you to select from four Moving Averages and seven applied prices, thus greatly expanding the indicator's functionality.
FREE

Стратегия форекс «Гора» основана на одном довольно сложном индикаторе. С его помощью генерируются вполне неплохие сигналы и, в принципе, автор указывал возможность торговли и на остальных инструментах, однако, мы решили взять изначальный вариант — торговлю только по GBP/USD. Так же следует сказать, что по ходу развития тренда торговая стратегия пропускает большое количество неплохих точек входа, но это только на первый взгляд. Фильтрация сигналов показала себя достаточно неплохо и в итоге торгов
FREE

The SSD With Histogram is a custom forex indicator for Metatrader 5 that shows a slow stochastic line, a signal line, and a histogram that reflects the difference between the slow line and the signal line. The indicator and its elements are displayed in a separate window just below your main trading chart.
parameters: k period; 5 D period; 3 time frame: m1 m5 m15 m30 h1 d1
FREE
Мультивалютный индикатор в отдельном окне отображает движение валютных пар в пунктах с расхождением от начала дня. Во время работы, динамически возможно включать и отключать различные пары прямо на графике. При первом запуске, возможно, потребуется продолжительное время, пока загрузиться история для основных валютных пар. Расчет всех кроссов происходит на основе мажоров. Для валют CAD, CHF, JPY - график перевернут. При повторном открытии, все настройки индикатора восстанавливаются автоматически.
FREE

MACD ******************** MACD для платформы секундных графиков Micro . ********************* Секундный график на порядок увеличит точность ваших входов и выходов. Секундный период , в привычном формате, позволит увидеть то, что ранее было скрыто. Бесплатные индикаторы, дополнят визуальную картину, что, в совокупности выведет вашу торговлю на новый уровень. Идеально подходит как скальперам, так и трейдерам торгующим внутри дня. Индикатор MACD для платформы Micro. Входные параметры:
FREE

This indicator solves the problem of chart scaling where the bar becomes too thin and it becomes difficult to determine the bar's open and close prices.
Thick Bar indicator - allows you to change the thickness of the lines and the color of the stroke, due to which you can get a thicker bar on the chart. The default indicator has a bar thickness of 2 and preset colors that can be changed in the settings
FREE

Wolf Countdown helps you not to waste the right amount of time, it gives you back the time remaining until the candle closes.
How to use: Download and install the Wolf Countdown Indicator on your MetaTrader 5. Apply the indicator to your favorite chart.
this works on any timeframe...
Thanks to this indicator you will never miss the right moment to enter your trades.
FREE

Dies ist die MT5-Version. Holen Sie sich Q-Math MT4 hier Schauen Sie es sich an und wenn Sie es mögen, genießen Sie es einfach. Probieren Sie verschiedene Werte aus, um die Einstellung zu finden, die am besten zu Ihrem Handel passt. Aufwärtssignal, wenn der Indikator Rasen grün und bärisches Signal gefärbt ist, wenn der Indikator grau ist. Sie können die Zeile selbst verwenden, um beim Öffnen von Aufträgen einen Nachstopp zu stopen. Dies ist nur ein Werkzeug. Eine Ergänzung. Es ist keine Strateg
FREE

The Commodity Channel Index computes the deviation of the typical price of each bar from the average price over a particular time period. Multiplying the median deviation by 0.015 facilitates normalization, which makes all deviations below the first standard deviation less than -100, and all deviations above the first standard deviation more than 100. This adaptive version is based on the indicator described by John Ehlers, in the book Rocket Science for traders. The indicator uses the homodyne
FREE

Der Zeit-Ende-Balken von MMD ist ein einfacher Indikator, der die verbleibenden Sekunden in den drei ausgewählten Intervallen anzeigt. Gemäß der MMD-Methodik ist der Moment wichtig, in dem eine direktionale Preisbewegung auftritt. Dieser Indikator ermöglicht es Ihnen, diese Beziehung beim Forex- und Futures-Handel effektiver zu nutzen.
Beschreibung der Funktionalität:
Zeitrahmen 1 Periode - Definieren des ersten Zeitintervalls Zeitrahmen 1 Farbe – Angabe der Farbe für das erste Zeitinterval
FREE

Indicador que cria um painel para acompanhamento to total de posições abertas no ativo do gráfivo.
São apresentados os dados: Ativo do gráfico Total de posições de venda em aberto Quantidade do volume de posições de venda em aberto Total de posições de compra em aberto Quantidade do volume de posições de compra em aberto.
Painel simples mas eficiente para o equilíbrio das ordens
FREE

An Adaptive Moving Average (AMA) is one more moving average overlay, just like EMA. It changes its sensitivity to price fluctuations . The Adaptive Moving Average becomes more sensitive during periods when price is moving in a certain direction and becomes less sensitive to price movement when price is volatile. For more information, welcome to our Telegram Group. https://t.me/InfinXx
FREE

This indicator show color of trend. And combined with the average line, but be used on the hightest price and the lowest of the 26 period. The target entry at the level and the point of the route between 2 line for entry and exit position This is a first version, many problems is not supported and fine. Expected a contected from your friends To continue to follow the good products
FREE

Midpoint Bands is a channel-like indicator that draws two lines on the chart - an upper band and a lower band, pointing out possible reversal levels.
This is one of the indicators used in the Sapphire Strat Maker - EA Builder.
Sapphire Strat Maker - EA Builder: https://www.mql5.com/en/market/product/113907
The bands are simply calculated like this:
Upper Band = (HighestHigh[N-Periods] + LowestHigh[N-Periods])/2 Lower Band = (LowestLow[N-Periods] + HighestLow[N-Periods])/2
FREE

Market Palette ist ein leistungsfähiges Filterwerkzeug für Handelsentscheidungen, das auf Trägheit und Beschleunigung von Preisschwankungen basiert.
_________________________________
So verwenden Sie die Indikatorsignale:
Der Indikator erzeugt Histogrammsignale in drei verschiedenen Farben. Wenn blaue Spalten angezeigt werden, wird empfohlen, nur lange Positionen zu halten, wenn rote Spalten angezeigt werden, nur kurze Positionen, wenn graue Spalten angezeigt werden, und keine Handelsakti
FREE

"Elder Ray" oder "Ray" -Izator basiert auf den Oszillatoren des Dr. Alexander Elder: Bulls & Bears Power. Beide arbeiten mit einer EMA. Dieser Indikator wird von Händlern verwendet, um Divergenz, Marktrichtungen und mehr zu identifizieren ... Dr. Elders Methode verwendet im Allgemeinen eine 13-tägige EMA-Periode, dies kann jedoch anhand Ihrer persönlichen Nachfrage geändert werden.
Die Berechnungen sind: Bullen Power = High Candle - EMA Close Bears Poder = niedrige Kerze - EMA Close Die Kalkl
FREE

O indicador é uma ferramenta desenvolvida para o MetaTrader, projetada para auxiliar na análise detalhada do comportamento do preço em relação a uma média móvel específica. Ao ser anexado ao timeframe diário, o ele realiza cálculos e monitora, em timeframes menores, quantas vezes o preço toca determinados níveis de afastamento durante o dias além de calcular a média dos toques.
MT4: https://www.mql5.com/pt/market/product/111706
FREE
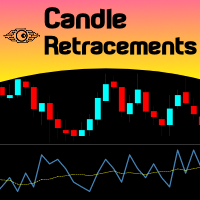
Do you want to know how much, how frequent and at what level a candlestick retraces over the previous one, just drop Candles Retracement over your chart and see it visually! Just choose your desired timeframe and the indicator will show it graphically. As simple as that... In addition you have the option to calibrate a Moving Average over this sub-window chart monitor. This indicator could be used to study candle retracements levels so you can comfortably expect during a trade what to expect fro
FREE

The indicator displays the chart of an arbitrary combination of trading instruments, described by the entered arithmetic formula. Using the indicator. Add an indicator to any chart. Enter the formula as a string in the indicator's parameters. All symbols used in the formula must exactly match the names in the table "Market Overview" of the terminal. Example of the formula: (SIBN + SNGS) / 'RTS-3.19' + 2.5 * GAZP / LKOH Start the indicator The formula must meet the following requirements: The nam
FREE

A scrolling Market Ticker that displays price changes from all symbols in the Market Watch list. Provides an easy snapshot of symbol prices, and keeps scrolling automatically while you trade and analyse the chart.
Options include: - MTF, eg choose to show price changes of the daily chart, or the hourly - use the live candle or the recently completed - font and background coloring
FREE

The MAtrio indicator displays three moving averages on any timeframe at once with a period of 50-day, 100-day, 200-day. After attaching to the chart, it immediately displays three moving averages with the parameters of simple (SMA) moving average MAmethod50 , simple (SMA) moving average MAmethod100 , simple (SMA) moving average MAmethod200 . Accordingly, with the price type MAPrice50 , MAPrice100 , MAPrice200 , by default, the price is Close price everywhere. All parameters (MA calc
FREE

Main purpose: This indicator calculates the average of previous candles (a half of candle points). This value represent the strength of market (buy/sell) in each candle.
Parameters: . Period: indicating previous candles to calculate average . Shift: draw line at a shift on chart.
Tip: We can use this value to consider TP and SL of a position before opening.
FREE

verview: Our custom Kalman Filter indicator is a sophisticated, adaptive tool designed for MetaTrader 5 (MT5), offering traders a dynamic approach to analyzing financial markets. This indicator is based on the Kalman Filter algorithm, a powerful statistical method used for linear dynamic systems estimation. It's tailored for traders who need an advanced, responsive tool to track market trends and make informed decisions. Key Features: Dynamic Trend Analysis: The Kalman Filter continuously adjust
FREE

The indicator draws a colored histogram from comparisons of the strengths of bulls and bears.
It works like this:
The values of two indicators Bears and Bulls are taken, who is stronger on the candlestick is compared, the column is filled in. It's all.
.
FREE

Hey guys.
This indicator will show you, in the volume histogram, if the candle was a Doji, a bullish candle, or a bearish candle.
The construction of this indicator was requested by a trader who uses other indicators from my catalog, and I decided to release it free to help traders who think that the indicator can contribute to their operations.
The parameters are:
Volume Type: Real Volume or Tick Volume. Color if the candle is bearish: select the color. Color if the candle is high:
FREE

RCCMA is a general moving average indicator that works with ReviewCandleChart. Original is "Custom Moving Average" provided by MetaQuotes Software Corp. Based on that source code, I corresponded to ReviewCandleChart .
Advantages When ReviewCandleChart is ON, no line will be displayed on the right side from the vertical reference line. When ReviewCandleChart is ON and you press a key such as "Z" or "X" Following that, the MA is drawn. When ReviewCandleChart is OFF, the same drawing as the origi
FREE

Numa folha qualquer
Eu desenho um sol amarelo
E com cinco ou seis retas
É fácil fazer um castelo
Corro o lápis em torno da mão e me dou uma luva
E se faço chover com dois riscos, tenho um guarda-chuva
Se um pinguinho de tinta
Cai num pedacinho azul do papel
Num instante imagino uma linda gaivota a voar no céu
Vai voando, contornando
A imensa curva norte-sul
Vou com ela viajando
Havai, Pequim ou Istambul
Pinto um barco à vela
Branco navegando
É tanto céu e mar num beijo azul
Entr
FREE

This indicator changes the standard MetaTrader 5 candles to candles at the selected BID, ASK or Average price (BID+ASK)/2. Simply attach the indicator to the chart and select the prices to plot the candles or bars. Indicator Parameters ENUM_DRAW_TYPE - plot candles or bars on the chart For the price - the price for plotting the candles or bars The chart returns to its normal visualization mode after removing the indicator.
FREE

Opening Range Indicator
Idee Die Opening Range Strategie wurde zum ersten Mal von Tobi Crabel in den 90ern publiziert. In der Zwischenzeit haben sich die Märkte verändert, jedoch scheint die Opening Range insbesondere beim Indextrading immer noch sehr signifikant zu sein. Das Prinzip ist folgendes: Man zeichnet die Grenzen der ersten Stundenkerze in den Chart. Die Länge der Range wird mit "stretch" bezeichnet. Ein Ausbruch nach oben aus der Range wird wie folgt getradet: Stopp Loss an der un
FREE

Der DuettoFXTompson-Indikator wurde entwickelt, um mit zwei Instrumenten zu arbeiten, die ein hohes Maß an Korrelation haben, der Indikator kann für den Handel mit Währungen, Aktien und anderen Finanzinstrumenten verwendet werden. Die Anzeige zeigt das Moment der werkzeugdifferenz und die Summe der beiden Werkzeuge (gelbe Linie) an, zusätzlich wird der MA-Mittelwert berechnet.
Empfohlener Zeitrahmen für M5. Kontakte für die Kommunikation 777basil@mail.ru wir bereiten einen Experten vor, ein In
FREE
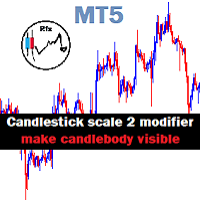
Chart Candlestick scale 2 zoom will visible instead of just a tiny unrecognized line make it look neat and tidy Instruction.
If you don't like the candles colors, you can do so by changing color. read below:
-Colors must be changed in the indicator setting.
-It won't change through the Chart properties to modify.
-After changing the color, save it as template so it wont change the colors to default value.
FREE
Fractal Reverse MTF - Indicator for determining the fractal signal to change the direction of the trend for МetaТrader 5.
The signal is determined according to the rules described in the third book of B. Williams:
- In order to become a signal to BUY, the fractal must WORK ABOVE the red line
- In order to become a signal for SALE, the fractal must WORK BELOW the red line
- Signals are not redrawn/ not repainting The main idea of the indicator:
- Determine the change in the directio
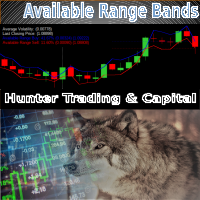
The Available Range Bands Technical Indicator draws two lines on the chart indicating the maximum limits (bands) expected for buying and selling for the current period (candle). These limits can be accessed by buffers 0 and 1 respectively.
In addition, it displays in the lower right corner the current average values of the real volatility, the last price, the predicted range of movement available for buying (% and points) and the predicted range of movement available for selling (% and points
FREE

The indicator measures and displays the difference in the number of "Bid" and "Ask" prices changes in the form of digital, analog and graphic indicators. Designed for market research and for determine the moments of position closing during scalping trade with H1 or less timeframe. Use with bigger timeframe is not prohibited, but it is not informative because of a large number of accumulated values. Theory
"Bid" and "Ask" prices do not change simultaneously for most symbols. Often you can see h

This is an original trend indicator. The indicator draws three lines in a separate window. Its values vary from -1 to +1. The closer the indicator is to +1, the stronger is the ascending trend. The closer it is to -1, the stronger is the descending trend. The indicator can be also used as an oscillator for determining the overbought/oversold state of the market. The indicator has one input parameter Period for specifying the number of bars to be used for calculations.
FREE

Indicador Regressão Linear – Par de Ativos - INTRADAY Indicador é um oscilador que faz o plot do Resíduo resultado da regressão linear entre os dois ativos inseridos como input do indicador, representado pela fórmula: Y = aX + b + R Onde Y é o valor do ativo dependente, X é o valor do ativo independente, a é a inclinação da reta entre os dois ativos, b é a intersecção da reta e R é o resíduo. O resíduo representa a quantidade da variabilidade que Y que o modelo ajustado não consegue explicar. E
FREE
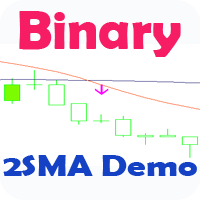
Стрелочный индикатор, выдающий сигнал при пересечении 2 SMA. Сигналы выдаются в виде стрелок и подходят для торговли бинарными опционами.
Это демо версия индикатора, в не нельзя изменять параметры. Полная версия .
Входные параметры First period- период 1 MA Second period - период 2 MA Invert signals - Возможность давать инвертированные сигналы (для работы по тренду) Candles to count - количество свечей для подсчета статистики Expiration - время экспирации сигнала Length - расстояние
FREE

Calculate the Variance of prices on the chosen time frame and compare with the price range reached. Or in other words how mutch is price moving in the recent candles? Two impots: Candle = 4 (Default) number of previous candle to calculate Backward = 500 (Default) How many candle to go backward
Variance is calculated as follow: Variance(X) = Average(X 2 ) – [Average(X)] 2
Subsequently Variance is rapported to the price range fo the chosen period (i.e. 4 candles) Indicator = Variance(X) / (
FREE

Добрый день. Сегодня добавили вспомогательный индикатор тренда DveMashkiTompson, идея взята из аналога МТ4 и перенесена на МТ5, используется совместно с индикаторами Тренда ТМА и МА, рисует красные и зеленые области в зависимости от направления рынка. Тренд вверх -зеленые области, тренд вниз -красные.Области основываются на пересечении индикатора МА, таким образом данный индикатор дает информацию графического содержания для более быстрой оценки ситуации и принятия решения.
FREE

ContiStat restricted - Free DEMO version of the ContiStat indicator
Free version of the indicator is ment as DEMO of full paid version. Full functionality is available, however The indicator work only on M30 chart period . Find the ContiStat indicator for full functionality
Brief description The ContiStat indicator calculate statistic frequency of green (up) and red (down) movement in the chart and determine movement dynamics (silver curve). There are two key parameters to understand the Conti
FREE

Dieser Indikator kann das Preisniveau bestimmen, bei dem im angegebenen Zeitraum das größte Volumen vorhanden war. In Zukunft springt der Preis häufig von solchen Niveaus ab, und dies kann erfolgreich im Handel angewendet werden. Sie werden als Linien angezeigt, einige Parameter zur Bestimmung der Pegel können angepasst werden. Dieser Indikator ist eine kostenlose Version von Volume Levels MT5 , daher werden keine Signale gemeldet, und die Erstellung von Pegeln ist auf ein Währungspaar EUR / USD
FREE

Track the historical outcome of your options operations on your favorite asset. It works for any asset in the spot market that has authorized option series on B3 (Brazilian stock exchange). Associate the robot with the asset you want to record and monitor its operation history and results. How to use the robot: 1. Enter historical data for your operations: Purchases and sales of the asset Purchases and sales of options on the asset Received dividends Cash inflows and outflows 2. Monitor the rea
FREE

Spread Indicator MT5 - NS Finanças. (http://www.nsfinancas.com.br) Auxiliary tool to give Spread visibility to all types of currency pairs and timeframes. The labels are well positioned in the upper right corner of the chart so as not to disturb the visualization during the trade, however it is also possible to drag the indicator to the best place on your screen. In addition to the current spread, this indicator also monitors the minimum, maximum and average spread of the selected currency pair
FREE

В стандартном индикаторе DeMarker используется простая скользящая средняя - Simple Moving Average, что несколько ограничивает возможности этого индикатора. В представленном индикаторе DeMarker Mod добавлен выбор из четырех скользящих средних - Simple, Exponential, Smoothed, Linear weighted, что позволяет существенно расширить возможности данного индикатора. Параметры стандартного индикатора DeMarker: · period - количество баров, используемых для расчета индикатора; Параметры индикат
FREE

The indicator draws two simple moving averages using High and Low prices. The MA_High line is displayed when the moving average is directed downwards. It can be used for setting a stop order for a sell position. The MA_Low line is displayed when the moving average is directed upwards. It can be used for setting a stop order for a buy position. The indicator is used in the TrailingStop Expert Advisor. Parameters Period - period of calculation of the moving average. Deviation - rate of convergence
FREE

Thread indicator is calculating possible values for the upcoming periods. It is built by author’s system, with ability to learn. Input data ( recommended interval ): Sensitivity to oscillatory motion (integer value, 0 - 8) increase of value shifts priority of calculation towards high-frequency vibrations (increase loads the system) Shift of diagram (integer value, 0 - 8) shifts output of indicator to the right Diagram forecast (integer value, maximum 10) defies the number of periods calculated
FREE

The indicator converts two moving averages into histograms and paints their intersection area.
There is a shift trick setting, it is used to smooth the result of calculations. You can see the changes if you reduce this parameter to 1 (minimum value).
Available averages:
MA Simple MA Exponential MA LinearWeighted MA Smoothed DEMA TEMA and
RSI - as a bonus By default, the fast MA is displayed at the top of the histogram, and the slow one at the bottom. You can swap them if you like.
shi
FREE
RSI Traffic Lights Dashboard Trend is you friend, one of the classical Trend following is the Relativ Streng Index (RSI). With RSI Traffic Light Dashboard you get an Overview how the current trend is moving for several Pairs. How many pairs you monitor, can be configured in Indicator settings. The order of symbols is equivalent to your Market Watchlist. The RSI Traffic Light Indicator alerts you if the trend is changing for your pair. Alert can be switched on/off
Important: Get informed about

A professional tool for trading - the divergence indicator between the AC and the price, which allows you to receive a signal about a trend reversal in a timely manner or catch price pullback movements (depending on the settings). The indicator settings allow you to adjust the strength of the divergence due to the angle of the AC peaks and the percentage change in price, which makes it possible to fine-tune the signal strength. The indicator code is optimized and is tested very quickly as part
FREE

This indicator helps keep track of the number of trades taken in the day. It shows losses and potential profit then the total profits which is, profits - losses. Then total profit for the week and month. Soon the indicator will be sharing some trading tips based on your trading. It really does put necessary pressure and helps you to set a goal for yourself for the day. Familiarise yourself to draw your analysis on the same chart with the indicator because it will have to alert you if price brok
FREE
Erfahren Sie, wie man einen Handelsroboter im MetaTrader AppStore, dem Shop für Applikationen für die MetaTrader Handelsplattform, kaufen kann.
Das Zahlungssystem der MQL5.community ermöglicht Zahlungen mit PayPal, Kreditkarten und den gängigen Zahlungssystemen. Wir empfehlen Ihnen eindringlich, Handelsroboter vor dem Kauf zu testen, um eine bessere Vorstellung von dem Produkt zu bekommen.
Sie verpassen Handelsmöglichkeiten:
- Freie Handelsapplikationen
- Über 8.000 Signale zum Kopieren
- Wirtschaftsnachrichten für die Lage an den Finanzmärkte
Registrierung
Einloggen
Wenn Sie kein Benutzerkonto haben, registrieren Sie sich
Erlauben Sie die Verwendung von Cookies, um sich auf der Website MQL5.com anzumelden.
Bitte aktivieren Sie die notwendige Einstellung in Ihrem Browser, da Sie sich sonst nicht einloggen können.