• Тип индикатора
  • Цена
     - 
  • Сбросить
Смотри обучающее видео по маркету на YouTube
Как купить торгового робота или индикатор
Запусти робота на
виртуальном хостинге
Протестируй индикатор/робота перед покупкой
Хочешь зарабатывать в Маркете?
Как подать продукт, чтобы его покупали

Технические индикаторы для MetaTrader 5 - 26

icon На основании сигналов технических индикаторов принимаются решения относительно открытия или закрытия сделки на фондовом и форекс-рынках. Суть индикаторов заключается в математическом преобразовании цены и/или объемов финансового инструмента для прогнозирования изменений цен в будущем. Протестируйте технические индикаторы, чтобы лучше предсказывать поведение рынка и зарабатывать на этом.
Скользящая средняя цены расстояния Это индикатор, который в режиме реального времени рассчитывает расстояние от цены до скользящей средней. С его помощью вы можете следить за максимальным отклонением цены от скользящей средней в определенный выбранный вами период времени, например отслеживать расстояние по максимальному отклонению за последние 30 дней. Можно выбрать период и тип скользящей средней. Чтобы сделать его еще лучше, мы добавили возможность двух уровней оповещения, если цена
FREE
For traders, monitoring price movements is a constant activity, because each price movement determines the action that must be taken next. This simple indicator will helps traders to display prices more clearly in a larger size. Users can set the font size and choose the color that will be displayed on the chart. There are three color options that can be selected to be displayed on the chart.
FREE
CalendarFilter
Kiyoshi Mizu Miyabi Nori
Are you having trouble with too many events in the economic calendar? This reduces to the minimum number you need. You can filter by country code importance any key words and you can receive alerts before the set time of the event. ++++++++++++++ If country code is blank, display available code on the expert tab. You need to turn off the automatic calendar update setting in MT5. Any sound file of .wav format in Sounds directory. The length of keyword characters is limited by MT5.
FREE
This indicator displays the spread with extra options Simple and easy to use and fully customisable: View as Pips or Pipettes Chart symbol can be hidden Text display can be changed Change colour and text styles Add or hide a decimal point Spacing options between inputs Default screen positions Screen position inputs Pro version includes: Drag and drop box on the screen Add an alert when the spread is too high Alert colours for text and text box changeable How to use 1. Simply use the defaul
FREE
Displays previous months Highs & Lows. You can set the number of months to display levels for, also the line style, color and width. This is very useful for traders using the BTMM and other methods like ICT. I'll be creating more indicators for MT5 for the BTMM. Send me your suggestions to my Telegram: https://t.me/JDelgadoCR Take a look at my other products at: https://www.mql5.com/en/users/jdelgadocr/seller
FREE
Test Phi Cubic
Genildo De Moura Vasconcelos
Numa folha qualquer Eu desenho um sol amarelo E com cinco ou seis retas É fácil fazer um castelo Corro o lápis em torno da mão e me dou uma luva E se faço chover com dois riscos, tenho um guarda-chuva Se um pinguinho de tinta Cai num pedacinho azul do papel Num instante imagino uma linda gaivota a voar no céu Vai voando, contornando A imensa curva norte-sul Vou com ela viajando Havai, Pequim ou Istambul Pinto um barco à vela Branco navegando É tanto céu e mar num beijo azul Entr
FREE
Nameless Stochastic
Flavio Javier Jarabeck
4.67 (3)
It is the very same classic Stochastic indicator, but with a little twist: NO NAME and data is shown in the sub window. It could be stupid, BUT, if you are running out of space in Micro windows like Mini Charts, where the indicator's name is totally useless, you came to the right place. And that's it! I know it seems stupid but I needed the classical version of Stochastic indicator without that annoying name on my Mini Chart, so I did it that way... The original formula is right from Metaquote's
FREE
Данный индикатор отображает значения доходности за выбранный период. Они отображаются как логарифм доходности, нежели значения цены или необработанные данные о доходности. Для малых значений доходности, показатели арифметической и геометрической доходности будут схожими. Преимущество использования значений доходности вместо цен заключается в нормализации. Это делает возможным сравнение всех переменных в сопоставимой метрике, несмотря на происхождение из ценовых рядов с разными значениями. Вход
FREE
Wolf Countdown
Tiziano Zambelli Sopalu
5 (1)
Wolf Countdown helps you not to waste the right amount of time, it gives you back the time remaining until the candle closes. How to use: Download and install the  Wolf Countdown Indicator on your MetaTrader 5. Apply the indicator to your favorite chart. this works on any timeframe... Thanks to this indicator you will never miss the right moment to enter your trades.
FREE
RSI Currencies is an indicator that is based on the RSI concept but with a totally different approach. It calculates its values calculating all RSI values of all pairs related to the same currency and making an average between them: the goal is to obtain a more solid and trustable information about what each currency are doing lowering the impact of market noise and extreme euphory on a particular pair to analyze the whole basket. It works on 28 forex majors and minor pairs related to these curr
FREE
This indicator emulates volume delta (buy trades vs sell trades) based on per candle volume and candle shape (direction, size of body and wicks). Artificially separated buy and sell volumes then accumulated for specified number of bars. The indicator shows a histogram of volume delta per bar, as well as a sum of the delta for the given period. What is more important, the indicator allows you to combine current symbol quotes/volumes with quotes/volumes of other related symbols (futures, indices,
FREE
This is a multi frame stochastic indicator, you can attach any time frame of stoch indicator on one chart. It is very useful if you like to check multi time frame stoch data. If you are interested in EA,click below links to take a look: https://www.mql5.com/en/market/product/80170 https://www.mql5.com/en/market/product/81136 How to use: > Atach the first time frame you want on to the currency pair's chart > Atach the second time frame you want on to the currency pair's   chart > Atach the thir
FREE
Auto Zig HTF Vwap Midas
Ricardo Almeida Branco
5 (1)
The best Vwap Midas coding for Metatrader 5 you can find in White Trader indicators. The indicator has been optimized not to recalculate (improving performance) and has several visual settings for you to adapt in your own way. TRY IT FOR FREE by clicking the free demo button Where and why to use Vwap Midas (and Auto Zig Vwap Midas) can be used on a variety of indices, currencies, forex, cryptocurrencies, stocks, indices and commodities. Many successful traders use price and volume to ge
Индикатор Time And Sales Layout показывает проторгованные объемы покупок и продаж прямо на графике. Он предлагает графическое представление хорошо известной таблице (ленте) сделок "time and sales". Индикатор скачивает и обрабатывает историю реальных тиков. В зависимости от выбранной глубины истории процесс может занять ощутимое время. Во время обработки выводится комментарий с процентом выполнения. Когда история обработана, индикатор начинает анализировать тики в реальном времени. Последний бар
Стрелочный индикатор, выдающий сигнал при пересечении канала боллинждера. Сигналы выдаются в виде стрелок и подходят для торговли бинарными опционами.  Входные параметры Period of BB -  период боллинджера Shift of BB  - смещение боллинджера Deviation of BB  - отклонение боллинджера Inform about finding the signal  - параметр, отвечающий за получение уведомлений (Alert) о найденном сигнале. По умолчанию - да
FREE
Dynamic Theoretical Stop Histogram indicator that dynamically analyzes the theoretical Stop levels in real time. Operation : The DTS - Dynamic Theoretical Stop does a mapping of fractals in previous candles and suggests two levels of Stop: For purchase and for sale. Suggested reading : It is necessary to make the definition of Maximum Stop in points in the Trading Plan. In this way, the trader can decide the best entry point by analyzing the theoretical stop levels: Stop for sales: S
FREE
Бинарный индикатор находит свечной паттерн "Поглощение" и рисует соответствующий сигнал для входа рынок. Имеет встроенные фильтры и панель для просчета количества успешных сделок. Демо версия является ознакомительной, в ней нет возможности изменять параметры. Полная версия . Особенности Работает для всех валютных пар и любых таймфреймов. Индикатор рассматривает комбинацию из 2-х или 3-х свечей в зависимости от настроек. Имеется возможность фильтровать сигналы путем настройки количества свеч
FREE
Thick Bar
Andrii Diachenko
5 (9)
Этот индикатор решает проблему масштабирования графика, при котором бар становится слишком тонким и становится трудно определить цены открытия и закрытия бара. Индикатор Thick Bar - позволит менять толщину линий и цвет обводки, за счет чего можно получить более толстый бар на графике. Индикатор по умолчанию имеет толщину бара равную 2 и предустановленные цвета, которые можно менять в настройках
FREE
Индикатор ColorLine отображает на графике цены линию (скользящую среднюю). Линия окрашивается по 100 баров тремя различными цветами, при этом каждые 5 тиков цветовавя схема меняется (всего 3 цветовых схемы). Индикатор для демонстрации стиля DRAW_COLOR_LINE . Рисует цветными кусками по 20 баров линию по ценам Close. Толщина,стиль и цвет участков линии меняется случайным.  Код индикатора опубликован в MQL5 Документации в разделе  Стили индикаторов в примерах
FREE
This is Gekko's indicator of quotations and variations. It summarizes quotations and variations of the current symbol in different timeframes as well as other correlated symbols. Keep track of all this information on your chart while you are negotiating for decision making support. Input Parameters General Settings:  configure which quotations and variations you want to keep track for current day, week, month or year as well as M1, M5, M15, M30, H1 and H4 charts; Symbols Configuration: add up to
FREE
This indicator can be used to study the repeating daily volatility structure, and also find deviations from the historical means.  Black line tells the average volatility of current hour from last 30 days. Blue bands tell the confidence interval (2 times standard deviation). Red line tells the current volatility, ATR. Inputs:  - days: the number of days where to calculate the average volatility - atrp: the ATR period used to measure volatility
FREE
Screen Shoter
Andrey Khatimlianskii
4.33 (3)
Индикатор для "скриншотирования" графика с заданным интервалом. Файлы сохраняются в директорию " MQL5\Files\ScreenShots\Symbol TF\ " и именуются датой и временем съемки ( 2017.06.20 23.56.24.png ) Настраивается: Width и Height — ширина и высота сохраняемых скриншотов, IntervalSeconds — интервал сохранения в секундах. Внимание ! Если поставить большой размер скриншотов и высокую частоту съемки, может закончиться место на жестком диске. Не удаляйте папку, в которую пишутся скриншоты, индикатор смо
FREE
MultiPlatformA
Mikhail Savenkov
5 (1)
Мультивалютный индикатор в отдельном окне отображает движение валютных пар в пунктах с расхождением от начала дня. Во время работы, динамически возможно включать и отключать различные пары прямо на графике. При первом запуске, возможно, потребуется продолжительное время, пока загрузиться история для основных валютных пар. Для валют CAD, CHF, JPY - график перевернут. При повторном открытии, все настройки индикатора восстанавливаются автоматически.
FREE
Simple Candle Countdown
Emanuel Cavalcante Amorim Filho
Simple candle countdown - never again miss how much time is left to open a new bar! This indicator doesn't plot any line on the chart - it uses only objects and calculates the time left to open a new bar. You can set custom colors for the panel background and border and for the text color. Simple as that, the indicator is ready to use. If you find any bugs, feel free to contact me. 
FREE
В стандартном индикаторе Bulls Power используется экспоненциальная скользящая средняя - Exponential Moving Average по цене закрытия - Price Close, что несколько ограничивает возможности этого индикатора. В представленном индикаторе Bulls Power Mod добавлен выбор из четырех скользящих средних и семи применяемых цен, что позволяет существенно расширить возможности данного индикатора.
FREE
Weighted WCCI
Alexey Viktorov
4.67 (3)
Стратегия форекс «Гора» основана на одном довольно сложном индикаторе. С его помощью генерируются вполне неплохие сигналы и, в принципе, автор указывал возможность торговли и на остальных инструментах, однако, мы решили взять изначальный вариант — торговлю только по GBP/USD. Так же следует сказать, что по ходу развития тренда торговая стратегия пропускает большое количество неплохих точек входа, но это только на первый взгляд. Фильтрация сигналов показала себя достаточно неплохо и в итоге торгов
FREE
Ssd with histogram
Eimert Saul Villamizar Munoz
The   SSD With Histogram   is a custom forex   indicator   for Metatrader 5 that shows a slow stochastic line, a signal line, and a   histogram   that reflects the difference between the slow line and the signal line. The   indicator   and its elements are displayed in a separate window just below your main trading chart. parameters: k period; 5 D period; 3 time frame: m1 m5 m15 m30 h1 d1
FREE
MultiPlatformC
Mikhail Savenkov
5 (2)
Мультивалютный индикатор в отдельном окне отображает движение валютных пар в пунктах с расхождением от начала дня. Во время работы, динамически возможно включать и отключать различные пары прямо на графике. При первом запуске, возможно, потребуется продолжительное время, пока загрузиться история для основных валютных пар. Расчет всех кроссов происходит на основе мажоров. Для валют CAD, CHF, JPY - график перевернут. При повторном открытии, все настройки индикатора восстанавливаются автоматически.
FREE
Introduction One of the patterns in "RTM" is the "QM" pattern, also known as "Quasimodo". Its name is derived from the appearance of "Hunchback of Notre-Dame" from Victor Hugo's novel. It is a type of "Head and Shoulders" pattern.   Formation Method   Upward Trend In an upward trend, the left shoulder is formed, and the price creates a new peak higher than the left shoulder peak . After a decline, it manages to break the previous low and move upward again. We expect the pric
MACD  ******************** MACD для платформы секундных графиков Micro . ********************* Секундный график на порядок увеличит точность ваших входов и выходов. Секундный период , в привычном формате,   позволит увидеть то, что ранее было скрыто. Бесплатные индикаторы, дополнят визуальную картину, что, в совокупности выведет вашу торговлю на новый уровень. Идеально подходит как скальперам, так и трейдерам торгующим внутри дня.  Индикатор  MACD для платформы Micro. Входные параметры:
FREE
Candle Retracements
Flavio Javier Jarabeck
2.5 (2)
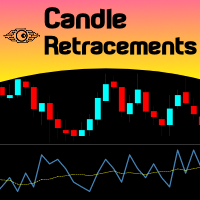
Do you want to know how much, how frequent and at what level a candlestick retraces over the previous one, just drop Candles Retracement over your chart and see it visually! Just choose your desired timeframe and the indicator will show it graphically. As simple as that... In addition you have the option to calibrate a Moving Average over this sub-window chart monitor. This indicator could be used to study candle retracements levels so you can comfortably expect during a trade what to expect fro
FREE
Q Math MT5
Dariel Iserne Carrera
4 (1)
Это версия MT5. Получить К-Математика MT4 здесь Проверьте это, и если вам это нравится, просто наслаждайтесь этим. Попробуйте различные значения, чтобы найти параметр, который лучше всего подходит для вашей торговли. Восходящий сигнал, если индикатор окрашен зеленым газоном и медвежьим сигналом, если индикатор серый. Вы можете использовать сам линию для задней остановки при открытии ордеров. Это всего лишь инструмент. Дополнение. Это не стратегия. Объедините его с собственным анализом Просто ска
FREE
Панель Time End от MMD — это простой индикатор, который показывает количество секунд, оставшихся в трех выбранных интервалах. Согласно методологии MMD важен момент, когда происходит направленное движение цены. Этот индикатор позволяет более эффективно использовать эту взаимосвязь в торговле на рынке Форекс и фьючерсами. Описание функционала: Time Frame 1 Period - определение первого временного интервала Time Frame 1 Color - указание цвета для первого временного интервала Time Frame 1 Period
FREE
One of the simplest Pivot Point indicator, easy to operate, and most complete for a single chart in determining    Resistance   and   Support  level lines. In single chart,  it will show R&S Level Line with 5 popular types of Pivot Point, Highest&Lowest of closing price Include the Trend and up to 3 Time Frames. Five   types   (Floor, Woodie, Camarilla, DeMark, & Fibonacci)   of popular   Pivot Points   in determining   Resistance   and   Support   levels. With just using simple button on th
FREE
What is this indicator? This indicator is the RSI (Relative Strength Index) supporting Virtual Trading mode of  Knots Compositor . When the mode is turned on, the indicator will be recalculated based on the displayed candlesticks. When the mode is turned off, the indicator will be recalculated based on the original chart candlesticks. Types of the applied price - Close - Open - High - Low - Median Price (HL/2) - Typical Price (HLC/3) - Weighted Price (HLCC/4) KC-Indicators -   KC-MA   (M
FREE
Moving Average  ******************* Moving Average для платформы секундных графиков Micro . ********************* Секундный график на порядок увеличит точность ваших входов и выходов. Секундный период , в привычном формате,   позволит увидеть то, что ранее было скрыто. Бесплатные индикаторы, дополнят визуальную картину, что, в совокупности выведет вашу торговлю на новый уровень. Идеально подходит как скальперам, так и трейдерам торгующим внутри дня.  Индикатор  Moving Average для платформы Micr
FREE
Bidu Position Count
Victor Borring Vieira
5 (1)
Indicador que cria um painel para acompanhamento to total de posições abertas no ativo do gráfivo. São apresentados os dados: Ativo do gráfico Total de posições de venda em aberto Quantidade do volume de posições de venda em aberto Total de posições de compra em aberto Quantidade do volume de posições de compra em aberto. Painel simples mas eficiente para o equilíbrio das ordens
FREE
Rsi Adaptive
Stanislav Shtiliyanov
An Adaptive Moving Average (AMA) is one more moving average overlay, just like EMA. It changes its   sensitivity to price fluctuations . The Adaptive Moving Average becomes more sensitive during periods when price is moving in a certain direction and becomes less sensitive to price movement when price is volatile. For more information, welcome to our Telegram Group.  https://t.me/InfinXx
FREE
This indicator show color of trend. And combined with the average line, but be used on the hightest price and the lowest of the 26 period. The target entry at the level and the point of the route between 2 line for entry and exit position This is a first version, many problems is not supported and fine. Expected a contected from your friends To continue to follow the good products
FREE
Market Palette - мощный инструмент фильтрации торговых решений, основанный на инерции и ускорении ценовых колебаний. _________________________________ Как пользоваться сигналами индикатора: Индикатор формирует сигналы гистограммы, трёх различных цветов. В стандартной схеме цветового оформления при появлении столбцов синего цвета рекомендуется держать только длинные позиции, при появлении красных столбцов - только короткие, при появлении серых столбцов - воздержаться от торговых действий. Появле
FREE
Ticks
Andrej Nikitin
4 (6)
Простой тиковый индикатор цены Bid и Ask. Разделитель периода (1 минута) отображен в виде гистограммы. Параметры Show Bid Line - включить/выключить отображение лини Bid; Show Ask Line - включить/выключить отображение лини Ask; Show Labels - включить/выключить отображение последних значений цены.
FREE
Midpoint Bands
Emanuel Cavalcante Amorim Filho
Midpoint Bands   is a   channel-like   indicator that draws two lines on the chart - an upper band and a lower band, pointing out possible reversal levels. This is one of the indicators used in the Sapphire Strat Maker - EA Builder. Sapphire Strat Maker - EA Builder:  https://www.mql5.com/en/market/product/113907 The bands are simply calculated like this: Upper Band   = (HighestHigh[N-Periods] + LowestHigh[N-Periods])/2  Lower Band   = (LowestLow[N-Periods] + HighestLow[N-Periods])/2
FREE
What is this indicator? This indicator is the Bollinger Bands supporting Virtual Trading mode of   Knots Compositor . When the mode is turned on, the indicator will be recalculated based on the displayed candlesticks. When the mode is turned off, the indicator will be recalculated based on the original chart candlesticks. Types of the applied price - Close - Open - High - Low - Median Price (HL/2) - Typical Price (HLC/3) - Weighted Price (HLCC/4) KC-Indicators -   KC-MA   (Moving Averag
FREE
Индикатор рисует цветную гистограмму из сравнений значений сил быков и медведей. Работает следующим образом:  Берутся значения двух индикаторов Bears и Bulls, сравнивается кто сильнее на свече, заполняется столбец. Это всё. .
FREE
DuettoFXTompson
Vasilii Luchnikov
4 (1)
Индикатор DuettoFXTompson  создан для работы с двумя  инструментами у которых высокий уровень корреляции, индикатор можно использовать  для парного трейдинга по валютам, акциям, и др. финансовым инструментам.  Индикатор показывает момент расхождения инструментов и  сумму двух инструментов ( желтая линия), дополнительно   рассчитывается параметр Среднего значения МА.  Рекомендуемый таймфрейм для работы М5.  Контакты для связи 777basil@mail.ru , приготовим эксперта, индикатор по вашему заданию.
FREE
Opening Range Indicator   Idea Toby Crabel introduced this way of trading in the ealy ninties in his book "Day Trading with Short Term Price Patterns and Opening Range Breakout". In simple terms this means to trade the brekouts from the limits of the first trading hour with the stop loss at the opposite side. I.e. if the first hourly candle meausres 40 points (Crabel calls this the "stretch") you set the stop loss at breakout level minus 40 points and the take profit at the breakout level plus
FREE
Volume Doji
Ricardo Almeida Branco
Hey guys. This indicator will show you, in the volume histogram, if the candle was a Doji, a bullish candle, or a bearish candle. The construction of this indicator was requested by a trader who uses other indicators from my catalog, and I decided to release it free to help traders who think that the indicator can contribute to their operations. The parameters are: Volume Type: Real Volume or Tick Volume. Color if the candle is bearish: select the color. Color if the candle is high:
FREE
Market Ticker Free MT5
John Louis Fernando Diamante
5 (1)
A scrolling Market Ticker that displays price changes from all symbols in the Market Watch list. Provides an easy snapshot of symbol prices, and keeps scrolling automatically while you trade and analyse the chart. Options include: - MTF, eg choose to show price changes of the daily chart, or the hourly - use the live candle or the recently completed - font and background coloring
FREE
Индикатор MAtrioMT5, отображает на любом таймфрейме сразу три скользящих средних с периодом 50   -дневная  ,100   -дневная , 200   -дневная . После присоединения к графику сразу отображает три скользящих средних с параметрами простой (SMA) скользящей средней   MAmethod50 ,  простой (SMA) скользящей средней   MAmethod100 ,  простой (SMA) скользящей средней   MAmethod200 .   Соответственно с типом цены  MAPrice50, MAPrice100, MAPrice200  по умолчанию везде стоит цена   Close price  . Все параме
FREE
Скалированный индикатор потрясающего осциллятора (SAO) представляет собой усовершенствованную версию индикатора потрясающего осциллятора, целью которой является установление стабильных точек опоры для выявления рыночных перегибов. В отличие от стандартного индикатора потрясающего осциллятора, который регистрирует изменения в пипсах для разных товаров, единственной неизменной точкой отсчета является нулевая линия. Это ограничение мешает инвесторам и трейдерам точно определить уровни для разворота
FREE
Индикатор "Elder Ray" или "Ray" основан на осцилляторах, разработанных доктором Александром Элдером, а именно: Bulls & Bears Power. Оба они работают с экспоненциальной скользящей средней (EMA). Этот индикатор имеет множество применений, но в основном он используется для определения расхождений на рынке, ценовых направлений и многого другого ... В методе доктора Элдера обычно используется 13-дневный период EMA, хотя с помощью этого индикатора вы можете изменять периоды по своему усмотрению. Расче
FREE
Equalizer MT5
Tiofelo Da Olga Gilbert Teles
Equalizer MT5 is a trend indicator that can be used as: trend filter tigger entry trailing stop Trend filter : with blue histogram we have bull market; with red histogram we have bear market and; with gray histogram we have consolidated market. The tigger : with the increase in the size of the histogram bars we can have possible entry points into a trend. The trailing stop : in a trend, when the size of the histogram bars increases we can move the stop loss to the price bar corresponding to the
FREE
What is this indicator? This indicator is the Moving Average supporting Virtual Trading mode of   Knots Compositor . When the mode is turned on, the indicator will be recalculated based on the displayed candlesticks. When the mode is turned off, the indicator will be recalculated based on the original chart candlesticks. Types of the moving average - Simple (SMA) - Exponential (EMA) - Smoothed (SMMA) - Linear weighted (LWMA) Types of the applied price - Close - Open - High - Low - Media
FREE
Индикатор меняет стандартные свечи МТ5 на свечи по выбранной цене BID, ASK или Average price (BID+ASK)/2 Просто прикрепите индикатор к графику и выберите по каким ценам строить свечи или бары. Параметры индикатора ENUM_DRAW_TYPE - Свечи или бары строить на графике For the price - По какой цене строить свечи или бары После удаления индикатора вид графика возвращается к предыдущему виду.
FREE
Track the historical outcome of your options operations on your favorite asset. It works for any asset in the spot market that has authorized option series on B3 (Brazilian stock exchange). Associate the robot with the asset you want to record and monitor its operation history and results. How to use the robot: 1. Enter historical data for your operations: Purchases and sales of the asset Purchases and sales of options on the asset Received dividends Cash inflows and outflows 2. Monitor the rea
FREE
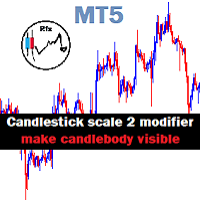
Chart Candlestick scale 2 zoom will visible instead of just a tiny unrecognized line make it look neat and tidy Instruction. If you don't like the candles colors, you can do so by changing color. read below: -Colors must be changed in the indicator setting. -It won't change through the Chart properties to modify. -After changing the color, save it as template so it wont change the colors to default value.
FREE
Fractal Reverse MTF - Индикатор определения фрактального сигнала на разворот для МetaТrader 5 Сигнал определяется по правилам, описанным в 3ей книге Б.Вильямса: - Для того, чтобы стать сигналом к ПОКУПКЕ, фрактал должен СРАБОТАТЬ ВЫШЕ красной линии  - Для того, чтобы стать сигналом к ПРОДАЖЕ, фрактал должен СРАБОТАТЬ НИЖЕ красной линии  -  Сигналы - не перерисовываются   Основная идея индикатора: Определить смену направления тренда с помощью фрактала и Аллигатора и сделать это максимально
Available Range Bands
Ricardo Alexandre Laurentino
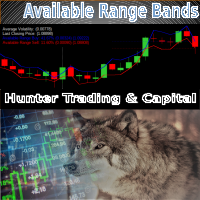
The Available Range Bands Technical Indicator draws two lines on the chart indicating the maximum limits (bands) expected for buying and selling for the current period (candle). These limits can be accessed by buffers 0 and 1 respectively. In addition, it displays in the lower right corner the current average values of the real volatility, the last price, the predicted range of movement available for buying (% and points) and the predicted range of movement available for selling (% and points
FREE
Индикатор измеряет и отображает разницу количества изменений цен "Bid" и "Ask" в виде цифровых, аналоговых и графических показателей. Предназначен для исследования рынка и для определения моментов выхода при скальпинговой торговле на периодах графиков не более одного часа (использование на старших периодах не запрещено, но не является информативным ввиду большого количества аккумулированных значений). Теория Цены "Bid" и "Ask" меняются не одновременно для большинства символов. Зачастую можно вид
Профессиональный инструмент для торговли  - индикатор дивергенции между AC и ценой, позволяющий своевременно получать сигнал о развороте тренда или ловить движения откатов цены (в зависимости от настроек). Настройки индикатора позволяют регулировать силу дивергенции за счет угла наклона пиков AC и процентного изменения цены, что даёт возможность тонко настроить силу сигнала. Код индикатора оптимизирован и в составе советника очень быстро тестируется.  Индикатор не перерисовывает, стрелки для нап
FREE
Оригинальный трендовый индикатор. Индикатор рисует в отдельном окне три линии, характеризующие текущую динамику цены. Может принимать значения от -1 до +1. Чем ближе значение индикатора к +1, тем сильнее восходящий тренд. Чем ближе к -1, тем сильнее нисходящий. Также может применяться в качестве осциллятора для определения перекупленности/перепроданности. Индикатор имеет один входной параметр Period, в котором указывается количество баров, используемых для расчета.
FREE
Consecutive candles can give us an indication as to the strength of a trend. With this indicator, you can set the number of consecutive bull or bear candles you wish to be present before achieving a valid signal of RSI crossing into overbought or oversold. With this information, you can better judge if a continuation or reversal situation is about to present. RSI has two settable levels Interesting settings: Number of consecutive candles needed before a valid signal Overbought level of RSI Ove
FREE
Данный индикатор умеет определять ценовые уровни, на которых было больше всего объёма за указанный промежуток истории.  В будущем, ч асто цена отбивается от таких уровней, и это можно с успехом применять в торговле.   Они отображаются линиями, некоторые параметры для определения уровней можно настраивать. Этот индикатор прост, поэтому не сообщает сигналы, а построение уровней делает только на EUR/USD.  Параметры HistoryBars   - количество баров для определения ближних объемных уровней; Range   -
FREE
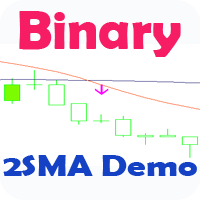
Стрелочный индикатор, выдающий сигнал при пересечении 2 SMA. Сигналы выдаются в виде стрелок и подходят для торговли бинарными опционами.  Это демо версия индикатора, в не нельзя изменять параметры. Полная версия .  Входные параметры First period-  период 1 MA Second period -  период 2 MA Invert signals -  Возможность давать инвертированные сигналы (для работы по тренду) Candles to count  - количество свечей для подсчета статистики Expiration - время экспирации сигнала Length - расстояние
FREE
Calculate the Variance of prices on the chosen time frame and compare with the price range reached. Or in other words how mutch is price moving in the recent candles? Two impots: Candle = 4 (Default) number of previous candle to calculate Backward = 500 (Default) How many candle to go backward Variance is calculated as follow: Variance(X) = Average(X 2 ) – [Average(X)] 2 Subsequently Variance is rapported to the price range fo the chosen period (i.e. 4 candles) Indicator =    Variance(X) / (
FREE
Добрый день. Сегодня добавили вспомогательный индикатор тренда DveMashkiTompson, идея взята из аналога МТ4 и перенесена на МТ5, используется совместно с индикаторами Тренда ТМА и МА, рисует красные и зеленые области в зависимости от направления рынка. Тренд вверх -зеленые области, тренд вниз -красные.Области основываются на пересечении индикатора МА, таким образом данный индикатор дает информацию графического содержания для более быстрой оценки ситуации и принятия решения.
FREE
ContiStat restricted - Free DEMO version of the ContiStat indicator Free version of the indicator is ment as DEMO of full paid version. Full functionality is available, however The indicator work only on M30 chart period . Find the ContiStat indicator for full functionality Brief description The ContiStat indicator calculate statistic frequency of green (up) and red (down) movement in the chart and determine movement dynamics (silver curve). There are two key parameters to understand the Conti
FREE
Standard PVSR is based on Pivot Points. Steps to Setup the Indicator: Install the Custom Indicator; Set all the Lines Color, Width and Styles; Set visualization to All Timeframe; and DONE It can be used for: All Pairs: Forex, Cryptocurrencies, Metals, Stocks, Indices etc. All Timeframe All Brokers All type of Trading Style like Scalping, Swing, Intraday, Short-Term, Long-Term etc. Multiple Chart -->> For any Type of Support, Guidance, Setup Issue, EA Optimization, Input Setup etc.
FREE
CSI Table
Triet Lam Minh
4.5 (2)
To calculate strength of currencies and to show in table There is 1 parameter: . Show recommended pairs: true/false -> To show top 1 of strong and weak currency Tips to trade: . To trade only with strongest vs weakest currency . When H1, M30, M15, M5 of specific currency is up or down -> consider to open BUY/SELL . It can combine: + strongest currency vs weakest currency  +  strongest currency vs 2nd weakest currency + 2nd strongest currency vs weakest currency 
FREE
NS Financas Indicador de Spread
Luiz Guilherme Neves Da Silva
4.33 (3)
Spread Indicator MT5 - NS Finanças. (http://www.nsfinancas.com.br) Auxiliary tool to give Spread visibility to all types of currency pairs and timeframes. The labels are well positioned in the upper right corner of the chart so as not to disturb the visualization during the trade, however it is also possible to drag the indicator to the best place on your screen. In addition to the current spread, this indicator also monitors the minimum, maximum and average spread of the selected currency pair
FREE

MetaTrader Маркет позволяет максимально безопасно покупать программы для платформы MetaTrader. Вы можете скачать демо-версии понравившихся роботов и индикаторов прямо из терминала и проверить их в тестере стратегий.

Протестируйте программы в различных режимах перед покупкой для получения максимального представления о продукте и оплатите понравившийся продукт через платежную систему MQL5.community.

Платежная система MQL5.community обеспечивает оплату продавцам, а возможность тестирования программ в различных режимах позволяет покупателям получить максимальное представление о продукте.