Watch the Market tutorial videos on YouTube
How to buy а trading robot or an indicator
Run your EA on
virtual hosting
virtual hosting
Test аn indicator/trading robot before buying
Want to earn in the Market?
How to present a product for a sell-through
Technical Indicators for MetaTrader 5 - 26

FFx Universal Strength Meter PRO is more than a basic strength meter. Instead of limiting the calculation to price, it can be based on any of the 19 integrated strength modes + 9 timeframes. With the FFx USM, you are able to define any period for any combination of timeframes. For example, you can set the dashboard for the last 10 candles for M15-H1-H4… Full flexibility! Very easy to interpret... It gives a great idea about which currency is weak and which is strong, so you can find the best pai

To download MT4 version please click here . This is the exact conversion from TradingView: "RSI versus SMA" By "JayRogers". This indicator lets you read the buffers for all Lines on chart. Note: This is an indicator, Not an expert. Meaning It does not take trades. If you want the EA please contact via message. You can easily use the indicator to understand the logic behind trades that the TradingView strategy takes. The strategy is profitable if this indicator is applied to the right symbol at
FREE

Что такое OsMA DA? Индикатор OsMA DA – это осциллятор, который построен на показаниях другого осциллятора – MACD. OsMA DA показывает расхождение между сигнальной линией MACD и его гистограммой. Момент пересечения гистограммы и линии – это нулевая отметка OsMA. Если гистограмма MACD поднимается выше линии, то гистограмма самого OsMA DA поднимается выше нулевой отметки. В обратной ситуации OsMA DA демонстрирует отрицательные значения. OsMA DA более узконаправленный индикатор, чем MACD. OsMA
FREE

The FFx Watcher PRO is a dashboard displaying on a single chart the current direction of up to 15 standard indicators and up to 21 timeframes. It has 2 different modes: Watcher mode: Multi Indicators User is able to select up to 15 indicators to be displayed User is able to select up to 21 timeframes to be displayed Watcher mode: Multi Pairs User is able to select any number of pairs/symbols User is able to select up to 21 timeframes to be displayed This mode uses one of the standard indicators

Стратегия форекс «Гора» основана на одном довольно сложном индикаторе. С его помощью генерируются вполне неплохие сигналы и, в принципе, автор указывал возможность торговли и на остальных инструментах, однако, мы решили взять изначальный вариант — торговлю только по GBP/USD. Так же следует сказать, что по ходу развития тренда торговая стратегия пропускает большое количество неплохих точек входа, но это только на первый взгляд. Фильтрация сигналов показала себя достаточно неплохо и в итоге торгов
FREE

Critical Trading, Omni-Channel This indicator lets you create a unique channel from a base type and a range type. Channels are great for spotting over-extensions or the start of new trends. With an ever changing market it is important to create your own edge in the market that no one else has. Let Omni-Channel add to your unique trading strategy. Please contact criticaltrading@outlook.com for more info or advice on adding any other functionality.
FREE

O indicador é uma ferramenta desenvolvida para o MetaTrader, projetada para auxiliar na análise detalhada do comportamento do preço em relação a uma média móvel específica. Ao ser anexado ao timeframe diário, o ele realiza cálculos e monitora, em timeframes menores, quantas vezes o preço toca determinados níveis de afastamento durante o dias além de calcular a média dos toques.
MT4: https://www.mql5.com/pt/market/product/111706
FREE

Support Resistance View draws horizontal lines in the current chart that define in real time the values of Supports/Resistances for the timeframe tha you choose. Inputs: Lines color: color of the lines. Timeframe: timeframe for calculations. Support and Resistance are values at which the currency usually inverts the trend or have a breakthrought, so you can use this values to define a strategy for trading.

Expert Market Edge is scalping, trending, reversal indicator, with alerts . You can use it all and fit with your strategy whatever it fits you. My recommendation is to combine with my Colored RSI , and when 2 signals are matched, and pointing same direction (for example buy on this indicator, and green on RSI, you can take a long position, stop loss should be last local low, if you want to be more conservative, add ATR. ) you can take position. If you using moving averages, that's even better i

*Used by MeditionSeed EA. Meditation is a practice in which an individual uses a technique – such as mindfulness, or focusing the mind on a particular object, thought, or activity – to train attention and awareness, and achieve a mentally clear and emotionally calm and stable state.[1][2][3][4][web 1][web 2] Plant a Meditation Seed to have wonderful future.
FREE

!! FLASH SALE !! Over 80% off !! For ONE week only. Now only $47 - normally $297! >>> Ends on 30 June 2023 - Don't miss it!
The Consolidation Breakout Alerts Indicator will revolutionize your trading strategy. Our innovative indicator offers unique buy and sell arrows when price breaks out from consolidation, allowing you to get in at the most optimal entry with minimal risk and maximum reward potential. Never again will you miss out on the lucrative trading opportunities available

Moving Average ******************* Moving Average для платформы секундных графиков Micro . ********************* Секундный график на порядок увеличит точность ваших входов и выходов. Секундный период , в привычном формате, позволит увидеть то, что ранее было скрыто. Бесплатные индикаторы, дополнят визуальную картину, что, в совокупности выведет вашу торговлю на новый уровень. Идеально подходит как скальперам, так и трейдерам торгующим внутри дня. Индикатор Moving Average для платформы Micr
FREE

Only Exponential Moving Average at Close Price is used in standard Bears Power limiting the possibilities of that indicator to some extent. Bears Power Mod enables you to select from four Moving Averages and seven applied prices, thus greatly expanding the indicator's functionality.
FREE

Functional in the Forex market. Functional in the B3 market - Bolsa Brasil Balcão.
Motivation The technical Fibonacci retraction indicator for many is essential and the basis for all market movement forecasts. The name of the tool comes from the Italian mathematician Leonardo de Pisa (13th century).
This DEMO version will work in Meta Trader with Demo and Strategy Tester.
To purchase the Full version that works on a Real account, click on: https://www.mql5.com/en/market/product/38089
FREE
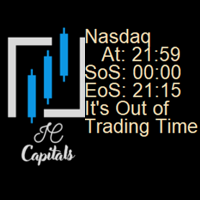
This indicator shows you the time of the opening and close of the trading time of every symbol. If it's out of the trading time it will show you a message in the screen, you can choose "PT-BR" or "ENG". For future updates i want to trigger a sound alarm in the preset value by the client for the opening of positions and closement of all positions.
If you want anything more than that just message me in the community ( https://discord.gg/P5mcttvXgw ) and I will update it for you!
FREE

--- StudentK Sync Chart --- 1. Move charts at the same time 2. Cross check among different Symbols and Timeframes 3. Plan your own trading strategies
=== Simple (Free) Version ===
1. Allow USDJPY only
2. Support M5 and M15
3. * Contact StudentK for unlocking all timeframes *
--- Context --- StudentK is not indicated as a master or K Sir for knowledgeable person who claims for winning all the time. (But lots of traders should know the fact that it is rarely truth, especially in fluctuat
FREE

The indicator has only one parameter - the number of bars for analysis. The indicator calculates statistics for when the market was moving down, when it was moving up, and the number of bars for each movement. From this data, the average number of bars is calculated, which is displayed in the indicator window. If the indicator values sharply decrease, then the market is preparing for an upward movement. If the indicator values persist at high levels for an extended period, then the market is pre
FREE

Indicators are professional data statistics, position orders, historical order analysis->>>>>> <This version is in Chinese -> English version please move>
Necessary for traders: tools and indicators Waves automatically calculate indicators, channel trend trading Perfect trend-wave automatic calculation channel calculation , MT4 Perfect trend-wave automatic calculation channel calculation , MT5 Local Trading copying Easy And Fast Copy , MT4 Easy And Fast Copy , MT5 Local Trading copying For DE
FREE

3 Moving averages crossover , with customizable Notifications and pop ups. Comment for any ideas. Its a demo version , could use some work, hope you at least find it useful. Hit me up with anything or any ideas you feel might be helpful and i will try and add them in if i get the time. Thank you. This version is free as of now . I can't promise anything about the future. But enjoy and have fun. Truly PVRPLE BLVCK. PS don't forget to share and like.
FREE

PACK 2 do Phi Cubic Fractals com opção para extender os indicadores no FUTURO, para o lado direito do gráfico Este produto contem os indicadores do PACK 2 (ROC full / SAINT 8 / SAINT 17 / SAINT 34 / SAINT 72 ) + MODO FUTURO Phi ROC - indicador do tipo oscilador, semelhante ao MIMAROC, que é capaz de mostrar a direção e a força do mercado, bem como determinar o ponto de entrada ótimo; Phi SAINT - indicador do tipo oscilador, semelhante ao SANTO do Phicube, que é capaz de mostrar a direção e a

Standard PVSR is based on Pivot Points.
Steps to Setup the Indicator: Install the Custom Indicator; Set all the Lines Color, Width and Styles; Set visualization to All Timeframe; and DONE
It can be used for: All Pairs: Forex, Cryptocurrencies, Metals, Stocks, Indices etc. All Timeframe All Brokers All type of Trading Style like Scalping, Swing, Intraday, Short-Term, Long-Term etc. Multiple Chart
-->> For any Type of Support, Guidance, Setup Issue, EA Optimization, Input Setup etc.
FREE

Non-proprietary study of Joe Dinapoli used for overbought/oversold evaluation. Uses of Detrended Oscillator indicator Profit taking. Filter for market entry technics. Stop placement. Part of volatility breakout pattern. Determining major trend changes. Part of Dinapoli Stretch pattern. Inputs lnpPeriod: Perid of moving average Method: Calculation method ********************************************************************************* If you want to know market Overb
FREE

Sometimes swaps are hidden for certain financial instruments , hence incurring unprecedented costs over night. The need to uncover hidden swap costs is vital for profitable trading. With that being said, this expert indicator helps the trader to uncover the hidden swap costs.
Features chart objects with text short and long trade swap plug and play
Advantages uncover hidden swaps plug and play, no other configurations are needed to use it. usable on all charts and symbols swaps can be easily
FREE

Tick Speed Free povides a on-chart label of tick speed to allow you to see the ebb and flow of market activity. Observing rises and falls in tick speed may allow you to better time entries to reduce slippage and re-quotes.
Options include: - colores for low-mid-high tick speeds - placement and styling - prefix & suffix to customise the speed label
Troubleshooting: - Note, in the tester environment, tick timings are limited to what is supplied by the tester environment and it's speed
- If
FREE

Calculates pivot levels. It paints the histogram depending on the location of prices relative to these levels.
Parameter values: style - select the type of display (Histogram, Line, Arrow) price - price, has little effect on the final look, but this can be customized timeframe - select a timeframe for calculating levels. color over pivot line - color of everything above the pivot level color under pivot line - color of everything below the pivot level pivot line intersection color - the color
FREE

It is the very same classic Stochastic indicator, but with a little twist: NO NAME and data is shown in the sub window. It could be stupid, BUT, if you are running out of space in Micro windows like Mini Charts, where the indicator's name is totally useless, you came to the right place. And that's it! I know it seems stupid but I needed the classical version of Stochastic indicator without that annoying name on my Mini Chart, so I did it that way... The original formula is right from Metaquote's
FREE
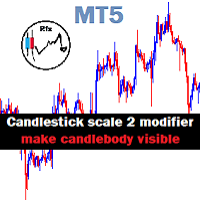
Chart Candlestick scale 2 zoom will visible instead of just a tiny unrecognized line make it look neat and tidy Instruction.
If you don't like the candles colors, you can do so by changing color. read below:
-Colors must be changed in the indicator setting.
-It won't change through the Chart properties to modify.
-After changing the color, save it as template so it wont change the colors to default value.
FREE

Indicator for "screenshoting" the chart at a specified interval. The files are saved in the " MQL5\Files\ScreenShots\Symbol TF\ " directory and named as the date and time the screenshot was taken ( 2017.06.20 23.56.24.png ) Settings: Width and Height — width and height of the saved screenshots, IntervalSeconds — the saving interval in seconds. Attention ! If you set a large size for screenshots and a high frequency, you may run out of space on the hard drive. Do not delete the folder where the s
FREE

The ColorLine indicator shows the line of the price moving average on the chart. The line has diffrent colors (100 bars have the same color). The color settings of the line is changing every 5 ticks, there are 3 color schemes. Indicator for demonstrating the DRAW_COLOR_LINE style. Draws a line at Close prices in colored pieces of 20 bars. The thickness, style and color of the line sections are changed randomly. The indicator code is published in the MQL5 Documentation in the section Indicator S
FREE

Fibonacci and RSI.
Demo versión only works with GBPUSD. For full version, please, visit visit https://www.mql5.com/en/market/product/52101
The indicator is a combination of the Fibonacci and RSI indicators.
Every time the price touches one of the fibonacci levels and the rsi condition is met, an audible alert and a text alert are generated.
Parameters number_of_candles : It is the number of candles that will be calculated. If you put 100, the indicator will give you the maximum and min
FREE

Corretora recomendada para usar esse indicador: https://tinyurl.com/5ftaha7c Indicador que pinta o candle de amarelo em pontos de muita agressão no mercado. Sempre que o mercado for se movimentar o candle irá ficar amarelo. Valido para todos ativos e todos timeframes. SEE OUR RESULTS ON INSTAGRAM: https://www.instagram.com/diogo.cansi/ TELEGRAM GROUP = https://t.me/robosdsc More information by email dscinvestimentos@gmail.com or by Whatsapp 55-991372299
FREE

Простейший индикатор для ручной торговли. Для комфортной торговли так же имеется эксперт https://www.mql5.com/ru/market/product/41133
Суть идикатора: уровни строяться на основе Moving Average с выбранным периодом по ценам High и Low. На разнице между High и Low строятся следующие уровни выше и ниже. В случае если бар не выходит за уровни, помечается зеленой меткой. Данную метку и уровни можно использовать для выставления отложенных ордеров когда цена на долго застревает между уровнями. Входны
FREE

Numa folha qualquer
Eu desenho um sol amarelo
E com cinco ou seis retas
É fácil fazer um castelo
Corro o lápis em torno da mão e me dou uma luva
E se faço chover com dois riscos, tenho um guarda-chuva
Se um pinguinho de tinta
Cai num pedacinho azul do papel
Num instante imagino uma linda gaivota a voar no céu
Vai voando, contornando
A imensa curva norte-sul
Vou com ela viajando
Havai, Pequim ou Istambul
Pinto um barco à vela
Branco navegando
É tanto céu e mar num beijo azul
Entr
FREE

Forex Indicator Arrows is an arrow Indicator used as an assistant tool for your trading strategy. The indicator analyzes the standard deviation of bar close for a given period and generates a buy or sell signals if the deviation increases. It good to combo with Martingale EA to follow Trend and Sellect Buy Only/Sell Only for EA work Semi-Automatic. You can use this Indicator with any EAs in my Products.
FREE

This indicator emulates volume delta (buy trades vs sell trades) based on per candle volume and candle shape (direction, size of body and wicks). Artificially separated buy and sell volumes then accumulated for specified number of bars. The indicator shows a histogram of volume delta per bar, as well as a sum of the delta for the given period. What is more important, the indicator allows you to combine current symbol quotes/volumes with quotes/volumes of other related symbols (futures, indices,
FREE
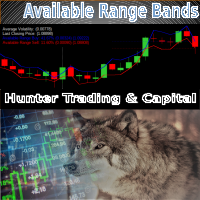
The Available Range Bands Technical Indicator draws two lines on the chart indicating the maximum limits (bands) expected for buying and selling for the current period (candle). These limits can be accessed by buffers 0 and 1 respectively.
In addition, it displays in the lower right corner the current average values of the real volatility, the last price, the predicted range of movement available for buying (% and points) and the predicted range of movement available for selling (% and points
FREE

The indicator draws a colored histogram from comparisons of the strengths of bulls and bears.
It works like this:
The values of two indicators Bears and Bulls are taken, who is stronger on the candlestick is compared, the column is filled in. It's all.
.
FREE

"Moving Ratio Candle" is used to check the distance of a candle to a theoretical pressure point. Furthermore, we have two points of interest, the first for the mean and the second for the median. This indicator uses the shape of bars and the line that crosses the bar from left to right is based on the calculation of the closing price for both sides. The rest follows a more standard calculation. The same could be done as a line, but I want to know the behavior of this indicator in relation to the
FREE

Volume Cross Over is an indicator that measure positive and negative volume flow in a financial instrument, such as a stock, commodity, or index. It is base on the idea of On-Balance Volume developed by Joseph Granville. However instead of trending lines, this indicator shows volume cross over. When the closing price of an asset is higher than the previous closing price, then the Bull volume is greater than zero and Bear volume is negative. It suggests that buying volume is dominating, and
FREE

Hello,
This is an easy symbol change panel.
The free version only can change major pairs which are "AUDUSD, EURUSD, GBPUSD, USDCHF, USDCAD, USDJPY, NZDUSD"
The full version can add your symbols.
FULL version here:
https://www.mql5.com/en/market/product/71173?source=Site+Market+MT5+Indicator+New+Rating005#description
Also, can change the TimeFrame as well.
Symbols must be active on your Market Watch list.
Parameters:
ratio - change the size LineNumber - you can set that how
FREE

What is this indicator? This indicator is the Stochastic Oscillator supporting Virtual Trading mode of Knots Compositor . When the mode is turned on, the indicator will be recalculated based on the displayed candlesticks. When the mode is turned off, the indicator will be recalculated based on the original chart candlesticks.
KC-Indicators - KC-MA (Moving Average) - KC-ENV (Envelopes) - KC-BB (Bollinger Bands) - KC-ADX (Average Directional Movement Index) - KC-MACD (Mo
FREE

This is a rate of change chart from the baseline. features. comparison of max 5 symbols. free baseline with drag. free timeframes of the sub window. reverse chart selectable if you need.
i.e. set symbols "-US100" notes In the sub window, you can't believe datetime on the chart, because the numbers of bars are different. You can check the baseline if you click symbol name. The dragged baseline is temporary. You must set it to indicator's parameter if you need.
FREE

The ColorBars Indicator paints bars with different colors depending on the volume changes. If the volume has increased, the color is green, overwise the color is red.
FREE

The best Vwap Midas coding for Metatrader 5 you can find in White Trader indicators.
The indicator has been optimized not to recalculate (improving performance) and has several visual settings for you to adapt in your own way. TRY IT FOR FREE by clicking the free demo button Where and why to use Vwap Midas (and Auto Zig Vwap Midas) can be used on a variety of indices, currencies, forex, cryptocurrencies, stocks, indices and commodities.
Many successful traders use price and volume to ge

Time And Sales Layout indicator shows traded buy and sell volumes right on the chart. It provides a graphical representation of most important events in the time and sales table. The indicator downloads and processes a history of real trade ticks. Depending from selected depth of history, the process may take quite some time. During history processing the indicator displays a comment with progress percentage. When the history is processed, the indicator starts analyzing ticks in real time. The l

This is a Price Projection for Current Candle from Time Frame M15 To Weekly, It's shows Market Trends Teji (Bullish) Or Mandi (Berries). It's Show Teji High & Low for Bullish Market and Mandi High & Low for Berries Market. We can Plan Our Trade in Well Advance for our Current Open Trade. It's Generate New Data for Every New Candle. You are requested to Please Test it with demo Ac before Use in Real Trade. Please Save it to your Mql\Indicator folder and attache to your chart. if any quay Please
FREE

A scrolling Market Ticker that displays price changes from all symbols in the Market Watch list. Provides an easy snapshot of symbol prices, and keeps scrolling automatically while you trade and analyse the chart.
Options include: - MTF, eg choose to show price changes of the daily chart, or the hourly - use the live candle or the recently completed - font and background coloring
FREE

The custom Bollinger Bands Height indicator measures and displays the current state of the Bollinger Bands indicator, showing whether the bands are widening (moving away from each other) or narrowing (starting to converge). Contraction, indicated by the narrowing of the bands, suggests that the current market movement is losing momentum and hints at the potential start of a new strong movement. This can be a signal to look for an opportune moment to enter a position, as a sharp price change ma
FREE

What is this indicator? This indicator is the ADX (Average Directional Movement Index) supporting Virtual Trading mode of Knots Compositor . When the mode is turned on, the indicator will be recalculated based on the displayed candlesticks. When the mode is turned off, the indicator will be recalculated based on the original chart candlesticks.
KC-Indicators - KC-MA (Moving Average) - KC-ENV (Envelopes) - KC-BB (Bollinger Bands) - KC-ADX (Average Directional Movement Index)
FREE

The RFOC Symbol Background was created to display the name of the asset and the current timeframe in the background of the chart.
Displaying the name of the asset at the bottom of the chart is often used by traders who are designing the screen for spectators, making it easier to identify the asset and the timeframe during a class, for example.
It is available for the user to select the font size (small, medium or large) and select the color for better viewing according to the background colo
FREE
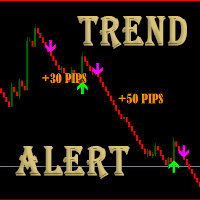
Characteristics of Trend Alert Platform: Metatrader4 Currency pairs: Any (recommended major) Trading Time: Any Timeframe: M5 or higher In-built Alert System Trend Alert is easy to use.
ITS FREE, GIVE ME A GOOD RATING!
Trend Alert indicator can be added to the existing trading systems , or used in combination with other indicators , filters its signals.
Send me a mail for further details.
FREE
The indicator displays the chart of an arbitrary combination of trading instruments, described by the entered arithmetic formula. Using the indicator. Add an indicator to any chart. Enter the formula as a string in the indicator's parameters. All symbols used in the formula must exactly match the names in the table "Market Overview" of the terminal. Example of the formula: (SIBN + SNGS) / 'RTS-3.19' + 2.5 * GAZP / LKOH Start the indicator The formula must meet the following requirements: The nam
FREE

An improved version of the standard Standard Deviation indicator.
It is now a responsive and smoothed line.
The setup is not straightforward - but I hope you can do it.
It is very easy to understand the readings of this indicator, the meaning is the same as that of the usual Standard Deviation.
//////////////////////////////////////////////// ///////////////////////////////////
I hope this indicator will be very useful to you in successful trading.
Good luck.
FREE

To calculate strength of currencies and to show in table There is 1 parameter: . Show recommended pairs: true/false -> To show top 1 of strong and weak currency Tips to trade: . To trade only with strongest vs weakest currency . When H1, M30, M15, M5 of specific currency is up or down -> consider to open BUY/SELL . It can combine: + strongest currency vs weakest currency + strongest currency vs 2nd weakest currency + 2nd strongest currency vs weakest currency
FREE

This indicator will mirror the assets in use in another metatrader, being able to choose the timeframe and a template. This is the Metatrader 5 Client, it needs the Metatrader 4 or 5 Server versions: Metatrader 4 Mirror Chart Server: https://www.mql5.com/en/market/product/88644
Metatrader 5 Mirror Chart Server: https://www.mql5.com/en/market/product/88652 Details of how it works in the video.
FREE

Wolf Countdown helps you not to waste the right amount of time, it gives you back the time remaining until the candle closes.
How to use: Download and install the Wolf Countdown Indicator on your MetaTrader 5. Apply the indicator to your favorite chart.
this works on any timeframe...
Thanks to this indicator you will never miss the right moment to enter your trades.
FREE

If your strategy requires trading during a certain period of market activity - calm or turbulent, this indicator will help you find such periods of time within a week for each currency pair using statistics.
The principle of the indicator is quite simple.
The entire trading week, from Monday 00:00 to Friday 23:59, is divided into timeslots, the duration of which corresponds to the current timeframe.
For each timeslot, activity is calculated - the average value of the difference between the
FREE

Introduction
One of the patterns in "RTM" is the "QM" pattern, also known as "Quasimodo". Its name is derived from the appearance of "Hunchback of Notre-Dame" from Victor Hugo's novel. It is a type of "Head and Shoulders" pattern.
Formation Method
Upward Trend
In an upward trend, the left shoulder is formed, and the price creates a new peak higher than the left shoulder peak . After a decline, it manages to break the previous low and move upward again. We expect the pric

This indicator show color of trend. And combined with the average line, but be used on the hightest price and the lowest of the 26 period. The target entry at the level and the point of the route between 2 line for entry and exit position This is a first version, many problems is not supported and fine. Expected a contected from your friends To continue to follow the good products
FREE

*Used by MeditionSeed EA. Meditation is a practice in which an individual uses a technique – such as mindfulness, or focusing the mind on a particular object, thought, or activity – to train attention and awareness, and achieve a mentally clear and emotionally calm and stable state.[1][2][3][4][web 1][web 2] Plant a Meditation Seed to have wonderful future.
FREE

This indicator is an utility for have always under control, how much time is left at the end of the bar setted.
The utility show on the lower right of the chart, the countdown to the end.
When the remaining seconds is = to the seconds set in the input, the color of remaining seconds on chart, change color and play a warning sound to warn you that the bar is about the end. When the remaining seconds is < to the seconds set in the input, the utility play a beep to warn you that the bar is in
FREE

Индикатор, показывающий момент преодоления нулевой отметки индикатора MACD. Индикатор стрелочный и может быть использован для торговли бинарными опционами.
Входные параметры Period of SMA1 - Период 1 скользящей средней Period of SMA2 - Период 2 скользящей средней Period of SMA3 - Период 3 скользящей средней Inform about finding the signal - подавать уведомление, при нахождении сигнала
FREE

Простой индикатор, показывающий цены Bid и Ask. Есть настройки отображения информации и возможность перетаскивать панель. Индикатор используется для наглядного отображения цен покупки и продажи актива.
Входные параметры : Support - Ссылка, на помощь проекту heigth - Высота формы width - Ширина формы size - Размер текста bidcol - Цвет текста bid askcol - Цвет текста
FREE

GeoInfo5 is one of the most informative indicators, it displays basic information about a trading instrument in a compact form. The version for the Meta Trader 4 terminal has gained wide popularity among traders. The indicator is free and will always be free. The launch version is now available for MetaTrader 5 as well.
displays information about the main parameters of the tool in a brief form in the line in the upper left corner of the chart: Spread, Swap for Buy order, Swap for Sell order,
FREE
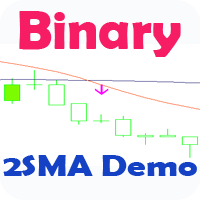
Стрелочный индикатор, выдающий сигнал при пересечении 2 SMA. Сигналы выдаются в виде стрелок и подходят для торговли бинарными опционами.
Это демо версия индикатора, в не нельзя изменять параметры. Полная версия .
Входные параметры First period- период 1 MA Second period - период 2 MA Invert signals - Возможность давать инвертированные сигналы (для работы по тренду) Candles to count - количество свечей для подсчета статистики Expiration - время экспирации сигнала Length - расстояние
FREE

Finally, the interface has become convenient. Now you can control the indicator period with the mouse. Just click on the button and scroll the mouse wheel to increase or decrease the CCI period. The button can be placed in any convenient place, fixed and used with one click. You can set several indicators on one chart and manage them individually or all at once. A simple installation on the chart allows you not to worry about renaming or changing the parameters of each indicator, the automatic
FREE

Consecutive candles can give us an indication as to the strength of a trend. With this indicator, you can set the number of consecutive bull or bear candles you wish to be present before achieving a valid signal of RSI crossing into overbought or oversold. With this information, you can better judge if a continuation or reversal situation is about to present. RSI has two settable levels
Interesting settings: Number of consecutive candles needed before a valid signal Overbought level of RSI Ove
FREE

The DuettoFXTompson indicator is designed to work with two instruments that have a high level of correlation. the indicator can be used for pair trading on currencies, stocks, and other financial instruments. The indicator shows the moment when the instruments diverge and the sum of the two instruments (yellow line). additionally, the parameter of the Average MA value is calculated.
Recommended timeframe for M5 operation. Contacts for communication 777basil@mail.ru we will prepare an expert, a
FREE

"Elder Ray" or "Ray" indicator is based on the Dr. Alexander Elder's oscillators: Bulls & Bears Power. Both of them works with an EMA. This indicator is used by traders to identify divergence, market directions and more... Dr. Elder's method generally uses a 13-day EMA Period but this can be modified based on your personal demand. The calculations are: Bulls Power= high candle - EMA close Bears Poder= low candle - EMA close Lime line represents Bulls Power and OrangeRed line, shows Bears Power
FREE
Simple RSI indicator.
User can choose TimeFrame for the RSI.
For example, you are using chart with M5 data
but want to see RSI from different fimeframe H4 drawn below the main chart window.
RSIhtf.ex5(iRSI.ex5 - another name) (h = higher, tf = timeframe) is designed specifically for this case.
Exports 1 buffer with indicator data.
The indicator is part of TS_DayTrader system.
FREE
The MetaTrader Market is a simple and convenient site where developers can sell their trading applications.
We will help you post your product and explain you how to prepare your product description for the Market. All applications on the Market are encryption-protected and can only be run on a buyer's computer. Illegal copying is impossible.
You are missing trading opportunities:
- Free trading apps
- Over 8,000 signals for copying
- Economic news for exploring financial markets
Registration
Log in
If you do not have an account, please register
Allow the use of cookies to log in to the MQL5.com website.
Please enable the necessary setting in your browser, otherwise you will not be able to log in.