Neue technische Indikatoren für den MetaTrader 5 - 72

Market Noise Market Noise ist ein Indikator, der Marktphasen auf einem Preisdiagramm bestimmt und außerdem klare, glatte Trendbewegungen von lauten, flachen Bewegungen unterscheidet, wenn eine Akkumulations- oder Verteilungsphase auftritt. Jede Phase ist für ihre eigene Art des Handels gut: Trend für trendfolgende Systeme und flach für aggressive Systeme. Wenn der Marktlärm beginnt, können Sie sich entscheiden, aus dem Handel auszusteigen. Auf die gleiche Weise und umgekehrt müssen Sie aggressi

Magic Channel Scalper ist ein Kanalindikator für das MetaTrader 5 Terminal. Dieser Indikator ermöglicht es, die wahrscheinlichsten Trendumkehrpunkte zu finden. Im Gegensatz zu den meisten Channel-Indikatoren wird der Magic Channel Scalper nicht neu gezeichnet. Das Alarmsystem (Alerts, E-Mail und Push-Benachrichtigungen) hilft Ihnen, mehrere Handelsinstrumente gleichzeitig zu überwachen. Hängen Sie den Indikator an ein Diagramm, und der Alarm wird ausgelöst, sobald ein Signal auftaucht. Mit unser
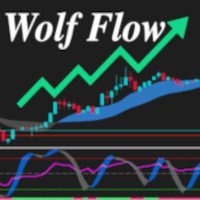
Der Wolf Flow Indicator für MetaTrader 5 ist die perfekte Lösung für Händler, die nach sofortiger Klarheit und Präzision in ihrer Marktanalyse suchen. Dieses einfach zu bedienende und sofort sichtbare Tool bietet Ihnen einen vollständigen Überblick über die Marktdynamik auf einen Blick.
Stärken :
Absolute Einfachheit: Eine übersichtliche und intuitive Benutzeroberfläche garantiert eine mühelose Nutzung, auch für weniger erfahrene Trader. Unmittelbar und schnell: Die wichtigsten Daten we
Pick Trend ist ein zuverlässiger Indikator ohne Redrawing, der keinen Händler gleichgültig lassen wird.
Pick Trend Werkzeug, das, basierend auf mathematischen Berechnungen, alle fünf Aspekte zu analysieren: Eröffnungskurs, hoch, niedrig, Schlusskurs und Volumen. Mit dem Algorithmus des Pick Trend Forex-Indikators können Sie schnell verstehen, welcher Trend sich gerade auf dem Markt entwickelt. Als Ergebnis der Berechnungen wird der technische Indikator Pick Trend auf dem Chart in Form einer Re

Der Indikator IRush verwendet eine modifizierte Version des beliebten Indikators RSI (Relative Strength Index), um auf einem Tageschart oder darunter nach Einstiegsmöglichkeiten zu suchen. Der Indikator wurde mit den wichtigsten Symbolen eingerichtet und getestet: AUDUSD, EURUSD, GBPUSD, USDCAD, USDCHF, und USDJPY. Ein automatisierter Handel mit diesem Indikator ist im Expert Advisor Intraday Rush implementiert. Dieser Expert Advisor kann seine Trades öffnen, verfolgen und schließen. Probieren S
FREE

Trend Channel ist ein Forex-Trendpfeil-Indikator zur Identifizierung potenzieller Einstiegspunkte. Ich mag ihn vor allem, weil er einen einfachen Funktionsmechanismus hat, der sich an alle Zeiträume und Handelstaktiken anpasst. Er wurde auf der Grundlage eines Regressionskanals mit Filtern erstellt. Wir zeigen die Signale des Trendkanal-Indikators auf dem Preisfunktionsdiagramm an und verwenden dabei einen mathematischen Ansatz.
Funktionsweise: Wenn der Kurs die überkaufte/überverkaufte Zone (

Ein- und Ausstiegssignale aus der IFR2-Strategie von Larry Connors in seinem Buch "Short Term Trading Strategies That Work".
Larry behauptet, dass diese Strategie die kurzfristige Richtung des S&P 500 von 1995 bis 2007 in 83,6 % der Fälle korrekt vorhersagte.
Wie funktioniert sie? Der Indikator löst ein Kaufsignal aus, wenn der Kurs über dem gleitenden 200-Tage-Durchschnitt schließt und der 2-Perioden-IFR unter 5 liegt. Das Verkaufssignal ist das Gegenteil davon.
Wie wird er verwendet? Eröff
Wir stellen Ihnen diese manuelle Handelsstrategie vor, die Ihre Herangehensweise an Finanzierungstests verändern wird! Unser Indikator wurde sorgfältig entwickelt, um Ihren Erfolg zu maximieren, und bietet eine beeindruckende Genauigkeitsrate von 83 % bei Eingängen . Stellen Sie sich vor, Sie hätten ein Werkzeug zur Verfügung, das Sie präzise durch die Finanzmärkte führt und Ihnen einen unvergleichlichen Wettbewerbsvorteil verschafft. Mit unserer innovativen Technologie sind Sie bei jedem Vorgan
FREE

Der Beta-Index, auch bekannt als Beta-Indikator, ist einer der wichtigsten Referenzindikatoren für Hedging-Institutionen. Er ermöglicht es Ihnen, das relative Risiko einzelner Vermögenswerte, wie Währungen und Rohstoffe, im Vergleich zu Marktportfolios, Währungspaaren, dem US-Dollar-Index und Aktienindizes zu messen. Wenn Sie verstehen, wie sich Ihre Vermögenswerte im Vergleich zu Marktbenchmarks entwickeln, können Sie Ihr Anlagerisiko besser einschätzen. Hauptmerkmale: Genaue Risikobewertung: D
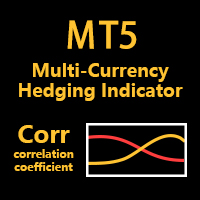
Der Corr-Indikator, auch als Korrelationsindikator bekannt, dient als Referenzindikator für Hedge-Institute. Er wird verwendet, um den Grad der Beziehung zwischen zwei oder mehr Finanzprodukten zu messen. Im Finanzbereich, insbesondere auf dem Währungsmarkt, werden Korrelationskoeffizienten häufig verwendet, um die Korrelation und den Grad der Beziehung zwischen verschiedenen Währungen zu untersuchen. Korrelationskoeffizienten werden in der Regel durch Werte zwischen -1 und 1 dargestellt. Im Fol

Der Tiko Trend-Indikator signalisiert nicht nur sofortige Käufe oder Verkäufe. Er zeigt den kurzfristigen und langfristigen Trend an. Die einfachste Art, den Indikator zu verwenden, besteht darin, einen Handel in Richtung des bestehenden Trends zu eröffnen. Der Indikator ermöglicht es Ihnen, reale und historische Markttrends genauer zu studieren! Zeigt die Punkte für die Eröffnung von Transaktionen zu verkaufen oder zu kaufen, und zeigt auch die Richtung des Trends in: kurzfristige und langfris

Verwendet den eingebauten Nachrichtenkalender des MT5-Terminals oder der Website Investing.com (im letzteren Fall ist das Dienstprogramm Get news5 erforderlich) Verfügt über den Parameter Scale={100%, 110%, 125%, ...}, um die komfortable Größe des Textes und der Bedienelemente einzustellen
Sagt Ihnen, in welcher Richtung es sicherer ist, Positionen zu eröffnen 3 in 1: Nachrichten + Trends + Prognose
Nachrichten für den gewählten Zeitraum: aktuell und in Tabellenform
Aktuelle Trends für 5 anpa

Fair Value Gap (FVG) Indikator: Meistern Sie die ICT-Methode im Devisenhandel
Was Trader sagen: "Hat meinen Handelsansatz mit seiner präzisen Gap-Erkennung verändert ..." - J. Doe "Die Warnfunktion ist ein Lebensretter, ich verpasse nie wieder eine Handelsmöglichkeit ..." - Alex P. " Ein unverzichtbares Werkzeug für jeden, der die ICT-Methoden im Forex-Handel verfolgt... " - Samantha R. Entschlüsseln Sie die Geheimnisse der Preisbewegung auf dem Forex-Markt mit dem revolutionären Fair Value Ga

Dr. Trend basiert auf der Erkennung von Markttrends. Mit diesem Indikator kann jeder leicht den Markttrend verstehen und entsprechend handeln. Es wird sehr hilfreich sein, um perfekt zu handeln und die Genauigkeit zu erhöhen.
Empfehlung: Verwenden Sie diesen Indikator zusammen mit meinem anderen Indikator --->>> Dr. Trend Alert ; Verwenden Sie diesen Indikator zusammen mit meinem anderen Indikator --->>> My PVSR <<<--- Klicken Sie hier ; Good_Luck
Es kann verwendet werden für: Alle Paare: Fo
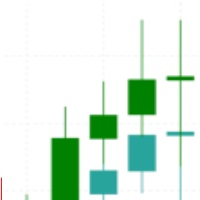
Haben Sie genug von der Unsicherheit, die entsteht, wenn Ihre Aufträge aufgrund des Spreads nicht an einer bestimmten Linie stoppen? Suchen Sie nicht weiter! Wir stellen Ihnen unseren Indikator vor, der Candlesticks auf der Grundlage des Ask-Preises anstelle des traditionellen, in MQL4 verwendeten Bid-Charts anzeigt. Mit diesem Indikator können Sie sich von den Frustrationen verabschieden, die durch das bid-basierte Chart verursacht werden, da es Ihnen eine genauere Darstellung der Marktbewegung

Mein PVSR basiert auf allen Arten von Pivot-Punkten. Verwenden Sie diesen Indikator, um die richtige Support / Resistance Zone und Handel entsprechend zu erhalten.
Empfehlung: Verwenden Sie diesen Indikator zusammen mit meinem anderen Indikator --->>> Dr. Trend <<<---Klick hier ; Um das beste Ergebnis zu erhalten, können Sie mich gerne kontaktieren; Best of Luck
Es kann verwendet werden für: Alle Paare: Forex, Cryptocurrencies, Metalle, Aktien, Indizes etc. Alle Zeitrahmen Alle Makler Alle A

Die Magische Neun besagt, wie der Name schon sagt, dass immer dann, wenn die Zahl 9 erscheint, eine hohe Wahrscheinlichkeit besteht, dass der Markt eine Umkehrung erfährt, und Sie sollten zu diesem Zeitpunkt auf die Gewinnmitnahme achten. Es ist ein sehr effektiver Indikator. Bei der Sequenzanzeige und -bildung verschwindet die vorherige Zahlenfolge, sobald die Auslösebedingungen nicht erfüllt sind, die Struktur der Neunerkurve existiert nicht. Wenn die Auslösebedingungen an neun aufeinanderfol

Die Supply and Demand Order Blocks:
Der Indikator "Supply and Demand Order Blocks" ist ein anspruchsvolles Tool, das auf den Konzepten des Smart Money basiert und für die technische Analyse im Devisenhandel unerlässlich ist. Er konzentriert sich darauf, Angebot und Nachfrage Zonen zu identifizieren, entscheidende Bereiche, in denen institutionelle Händler deutliche Spuren hinterlassen. Die Angebotszone, die Verkaufsaufträge anzeigt, und die Nachfragezone, die Kaufaufträge anzeigt, helfen Händl
FREE

Beherrschen Sie Markttrends mit dem SuperTrend Alert MT5, einem leistungsstarken Indikator, der präzise Trendfolgesignale für den Handel mit Forex, Aktien, Kryptowährungen und Rohstoffen liefert. In Handelsgemeinschaften wie Forex Factory und Reddit’s r/Forex gefeiert und in Diskussionen auf Investopedia und TradingView für seine robuste Trenddetektion gelobt, ist dieser Indikator ein unverzichtbares Werkzeug für Trader, die zuverlässige Ein- und Ausstiegspunkte suchen. Nutzer berichten von bis
FREE

Erstellen Sie Ihre Strategie selbst Dieses Tool ermöglicht es Ihnen, Ihre Strategien mit allen nativen Indikatoren in MetaTrader und allen aus dem Internet heruntergeladenen Indikatoren zu entwickeln, die Puffer verwenden, um Daten auf dem Bildschirm anzuzeigen. Dieses Tool ist ein weiterer Grund, MetaTrader in Betracht zu ziehen, um Ihre Handelsstrategien zu automatisieren. Damit können Sie Ihre eigenen Strategiesignale auf einfache und intuitive Weise erstellen, indem Sie jeden MetaTrader-Indi
FREE
ALGO-KARTE
MERKMALE
- EINSTIEGSSTUFE
- ÜBERNEHMEN SIE GEWINNSTUFEN
- REVERSAL-EINTRAGSPUNKTE
- UMKEHRSTRATEGIE
- TREND-TRADING-STRATEGIE
- KAUFEN UND VERKAUFEN SIE SWING-HANDELSSIGNALE IN JEDEM ZEITRAHMEN
DIE BESTE HANDELSSOFTWARE SCHLÄGT MIT DIESER MT5-SOFTWARE JEDEN MARKT, JEDEN TAG!
WOLLEN SIE AN PROP-FIRMEN PASSIEREN, ALGO MAP IST PROP-FIRMENFREUNDLICH!
Sie sind neu im Handel und möchten eine Strategie, die langfristig funktioniert? Nutzen Sie unsere in Algo Map integrierte Umkeh
Erhöhen Sie Ihre Trading-Strategie mit dem Keltner Channel Indicator MT5 , einem zeitlosen Volatilitätswerkzeug, inspiriert von Chester Keltner's Innovationen der 1960er Jahre, das exponentielle gleitende Durchschnitte mit dem Average True Range (ATR) kombiniert, um dynamische Preisspannen zu schaffen. Seit seiner Wiederbelebung im digitalen Zeitalter in Trading-Kreisen gefeiert, hat dieser Indikator auf Plattformen wie TradingView und MQL5 an Popularität gewonnen, da er zuverlässig Breakouts
Verbessern Sie Ihren Handelsvorteil mit dem Squeeze Momentum Indicator Alert MT5, einem vielseitigen Tool für Volatilität und Momentum, inspiriert von John Carters renommierter TTM Squeeze-Strategie. Anfang der 2000er Jahre entwickelt und durch Plattformen wie Thinkorswim und TradingView populär geworden, kombiniert dieser Indikator Bollinger Bands und Keltner Channels, um "Squeezes" zu identifizieren – Perioden niedriger Volatilität, die potenzielle explosive Breakouts signalisieren. Trader we
Beherrschen Sie die Marktdynamik mit dem Directional Volatility and Volume Oscillator MT5, einem hochentwickelten Indikator, der Richtungsmomentum, Volatilitätsmessung und Volumenanalyse kombiniert, um umsetzbare Erkenntnisse für den Handel mit Forex, Aktien, Kryptowährungen und Rohstoffen zu liefern. In Handelsgemeinschaften wie Forex Factory und Reddit’s r/Forex hochgelobt und in Diskussionen auf Investopedia und TradingView für seine Fähigkeit, komplexe Marktbewegungen zu entschlüsseln, hervo
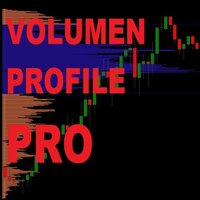
Du willst deinen Profit maximieren, um deine Ziele schneller zu erreichen? Denn schau dir unser Volumenprofil einmal näher an. Denn durch die grafische Darstellung der Volumenverteilung ist es dir problemlos möglich, die Verteilung und Verschiebung des Gesamtvolumens zu erkennen. Das führt zweifelslos zu besseren Trades und steigert so deine Performance deutlich. Mit unserem leistungsstarken Volumen Profile, das den Metatrader 5 in seiner Geschwindigkeit und effizient auf keinester Weise einsch

Ich denke, Sie alle kennen Donchian Channels. Deshalb werde ich nicht darüber schreiben.
Mit diesem Indikator habe ich versucht, Donchian Trend Ribbon zu erstellen, indem ich Donchian Channels verwende.
Wie funktioniert es?
- Es berechnet die Haupttrendrichtung, indem es die Länge verwendet, die benutzerdefiniert ist. Sie können sie also nach Belieben ändern
- dann berechnet es die Trendrichtung für jede der 9 unteren Längen. Wenn Sie die Länge = 20 einstellen, sind die Längen 19, 18,...11
FREE
Der Scanner ist so konzipiert, dass er Signalpuffer von Indikatoren (Pfeilen) abtastet und den nächstgelegenen Signalbalken auf dem Panel in Farbe und digitaler Anzeige anzeigt. Es werden die zu scannenden Symbole, Zeitrahmen und die Anzahl der zu scannenden Balken angegeben, beginnend mit dem aktuellen (0.) Balken. Es gibt auch ein komplexes Signal, das eine Liste von Zeitrahmen angibt, auf die das Indikatorsignal passen muss.
Sie können den Indikator einklappen, indem Sie mit der linken Maus

Name des Indikators : Fourier-Transformationskurven-Indikator Beschreibung : Der Fourier-Transformationskurven-Indikator für MetaTrader 5 ist ein leistungsstarkes Tool, das die Fourier-Analyse nutzt, um Kurven direkt auf Ihrem Preisdiagramm darzustellen. Er wurde entwickelt, um wertvolle Einblicke in die zugrunde liegenden harmonischen Komponenten der Kursdaten zu geben. Parameter : Eingabe Candle Count : Mit diesem Parameter können Sie die Anzahl der Kerzen angeben, die in die Berechnung der F

Dieser Indikator stellt den Standard Heikin Ashi Candle Converter von normalen Kerzen dar. Sie werden auf ein anderes Diagramm angewendet, so dass Sie beide Preise leicht identifizieren können. Sie können die Kerzen auch in Ihre Lieblingsfarben ändern. Wenn Sie möchten, können Sie diesen Indikator in einen iCostum verwenden, so dass Sie andere Indikatoren darüber anwenden können, denn es gibt hervorragende Indikatoren, die mit diesem Kerzentyp kombiniert werden
FREE

Vierteljährliche Zyklen
Quarterly Cycles basiert auf der von Daye entwickelten Quarterly-Theorie ( traderdaye auf X ). Dies ist ein Hilfsmittel für den Benutzer, um Zyklen zu finden, und es wird NICHT automatisch erkannt. Der Benutzer kann AMDX oder XAMD in jedem Zyklus auswählen und es wird visuell auf dem Chart gezeichnet. Vierteljährliche Zyklen: Jährlich , Monatlich, Wöchentlich, Täglich, 6 Stunden (90 Minuten)
- Jährlicher Zyklus : Das Jahr ist in vier Abschnitte von je drei Monaten unter

Der GGP Williams Vix Fix MT5 Indikator basiert auf der Volatilität des Marktes und bietet eine große Unterstützung, um herauszufinden, wann eine Korrektur zu Ende geht. Dieser Indikator ist eine MT5-Konvertierung des CM_Williams_Vix_Fix Finds Market Bottoms Indicator von "ChrisMoody " auf der Trading View Website. Es wurden einige Warnmethoden hinzugefügt, um Echtzeit-Warnungen zu liefern, wenn ein Handelssignal generiert wird, damit Händler schnell und effizient handeln können. Für die MT4-Vers
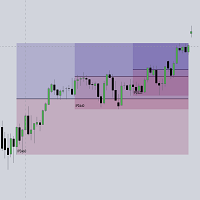
Dieses Skript berechnet und aktualisiert automatisch die täglichen IPDA-Rückblick-Zeitintervalle und die entsprechenden Abschläge/Gleichgewichte/Aufschläge, damit Sie das nicht tun müssen :) IPDA steht für Interbank Price Delivery Algorithm. Dieser Algorithmus bezieht sich auf die Intervalle der letzten 20, 40 und 60 Tage als Bezugspunkte für die Definition von Spannen und zugehörigen PD-Bereichen. Intraday-Händler können den größten Wert in der 20-Tage-Look-Back-Box finden, indem sie Ungleichge

Der GGP Wave Trend Oscillator MT5 Indikator ist ein Volatilitäts- und Momentum-Indikator, der entwickelt wurde, um Händlern zu helfen, ihre Handelsperformance zu optimieren und die genauesten Marktumkehrungen zu finden. Dieser Indikator ist eine MT5-Konvertierung des Indikators: WaveTrend Oscillator [WT] von " LazyBear " auf der Trading View-Website. Es wurden einige Warnmethoden hinzugefügt, um Echtzeit-Warnungen zu liefern, wenn ein Handelssignal generiert wird, damit Händler schnell und effiz
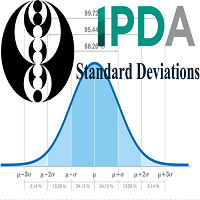
> Einleitung und Danksagung
Das IPDA-Tool für Standardabweichungen umfasst die Beziehung zwischen Zeit und Preis, wie sie von Dexter untersucht wurde . Ich bin nicht der Schöpfer dieser Theorie, und ich habe nicht die Antworten auf alle Fragen, die Sie vielleicht haben; ich empfehle Ihnen, sie anhand von Dexters Tweets, Videos und Material zu studieren. > Tool-Beschreibung Dies ist ein rein grafisches Hilfsmittel für Trader, um schnell Fractal IPDA Time Windows zu bestimmen und die potenziellen

Der GGP ADX und DI MT5 Indikator wird zur Quantifizierung der Trendstärke verwendet. ADX Berechnungen basieren auf einem gleitenden Durchschnitt der Preisspanne Expansion über einen bestimmten Zeitraum. Dieser Indikator ist eine MT5-Konvertierung des ADX- und DI-Indikators von "BeikabuOyaji" auf der Trading View-Website. Es wurden einige Warnmethoden hinzugefügt, um Echtzeit-Warnungen zu liefern, wenn ein Handelssignal generiert wird, damit Händler schnell und effizient handeln können. Für die M
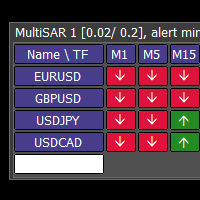
Dieses Tool überwacht Parabolic SAR-Indikatoren auf allen Zeitrahmen in den ausgewählten Märkten. Zeigt eine Tabelle mit Signalen zum Eröffnen eines KAUFEN-Geschäfts (grün) oder VERKAUFEN (rot) an. Sie können problemlos Marktnamen/Symbole hinzufügen oder löschen. Wenn die Bedingungen für die Eröffnung eines Handels auf mehreren Zeitrahmen erfüllt sind, können Sie per E-Mail oder Telefon benachrichtigt werden (entsprechend den Einstellungen im MT5-Menü Extras - Optionen...). Sie können auch die B

Wenn Sie mehr Informationen als nur ein paar Zahlen im iExposure-Index benötigen, ist dieser Indikator genau das Richtige für Sie.
Der bessere iExposure-Indikator ist eine Verbesserung gegenüber den ursprünglichen Informationen, wie z. B.:
Getrennte Gewinnspalte für KAUFEN und VERKAUFEN Separate SL-Spalte für KAUFEN und VERKAUFEN Getrennte TP-Spalte für KAUFEN und VERKAUFEN Durchschnittspreis als horizontale Linie im Chart Pip-Wert Gewinn https://www.facebook.com/groups/prop4y
iExposure zeigt

Zeichnen Sie mit diesem speziellen Indikator so viele benutzerdefinierte Kerzen wie möglich auf einem einzigen Chart. Ihre Analysefähigkeiten werden nie wieder dieselben sein, wenn Sie die Macht kennen, die eine Hawkeye-Ansicht aller Preisaktionen auf einmal bietet. Optimiert für Leistung und ermöglicht die Anpassung des Aussehens von Kerzenkörpern und Dochten. Dies ist ein integraler Bestandteil der Analyse an unseren Schreibtischen, und wir hoffen, dass es auch Ihre Charts nie mehr verlassen w
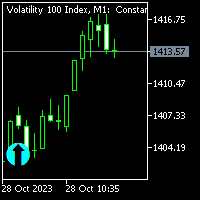
Dieser Indikator funktioniert gut mit synthetischen Paaren gibt es Marktrichtung. es ist gut für Anfänger, wenn die Show auf dem Diagramm können Sie Trades platzieren. Arbeitet mit Märkten Richtung so, wenn der Markt ändert, ein neuer Pfeil erscheint das Diagramm. Wenn der Indikator malt bitte nicht in den Handel stürzen Sie könnten Handel falsches Signal alles, was Sie brauchen, ist, Geduld zu haben.
Für weitere Informationen kontaktieren Sie mich bitte auf telegrame und facebook @ (Mountain f

Der Trend Forecaster-Indikator verwendet einen einzigartigen proprietären Algorithmus, um Einstiegspunkte für eine Breakout-Handelsstrategie zu bestimmen. Der Indikator identifiziert Preiscluster, analysiert die Preisbewegung in der Nähe von Niveaus und liefert ein Signal, wenn der Preis ein Niveau durchbricht. Der Trend Forecaster-Indikator ist für alle Finanzwerte geeignet, einschließlich Währungen (Forex), Metalle, Aktien, Indizes und Kryptowährungen. Sie können den Indikator auch so einstel

Der Double Stochastic RSI Forex Indikator ist eine Modifikation des stochastischen Oszillators für die MetaTrader 5 Plattform.
INFORMATIONEN ZUM INDIKATOR Der Double Stochastic Forex Indikator implementiert eine doppelte Stochastik, die auf den RSI angewendet wird, wobei gleitende Niveaus anstelle von festen verwendet werden, um überverkaufte und überkaufte Werte zu bewerten.
In Fällen, in denen die RSI-Periode <= 1 ist, erhalten Sie nur eine doppelte Stochastik. Sie können eine zusätzliche
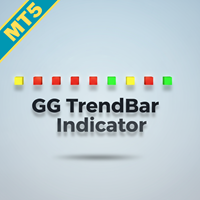
Erhöhen Sie Ihre Trading-Präzision mit dem GG TrendBar Indicator MT5 , einem leistungsstarken Multi-Zeitrahmen-Tool, das ADX und Parabolic SAR nutzt, um konsolidierte Trend-Signale über bis zu 9 Zeitrahmen hinweg zu liefern. Entstanden aus fortschrittlichen Trendanalyse-Konzepten, die in den frühen 2010er Jahren auf Plattformen wie Forex Factory und MQL5 populär wurden, hat dieser Indikator für seine Fähigkeit, Rauschen durch die Anforderung einer Ausrichtung über ausgewählte Zeitrahmen hinweg

Der psychologische Oszillator MT5 Forex Indikator ist eine großartige Modifikation des klassischen Oszillators, der Ihnen beim Handel mit MetaTrader 5 hilft.
INFORMATIONEN ZUM INDIKATOR Forex Der psychologische Oszillator MT5 Indikator wird als Farbbalkendiagramm dargestellt und hat alle Eigenschaften von Forex-Oszillatoren.
Es gibt auch Zonen, wann und in welchen Zonen sich der Markt befindet.
Alles ist einfach und so klar wie möglich gemacht, damit alle Händler es ohne Schwierigkeiten ve

Möchten Sie wissen, wie sich ein wirtschaftliches Ereignis auf den Kurs auswirken wird? Was wird mit dem Preis nach der Nachricht passieren? Wie hat sich eine Wirtschaftsnachricht in der Vergangenheit auf den Kurs ausgewirkt? Dieser Indikator kann Ihnen dabei helfen.
Mögen Sie die technische Analyse? Macht es Ihnen Spaß, die Geschichte zu studieren, um die Zukunft vorherzusagen? Aber was könnte Ihrer Meinung nach wichtiger sein als die technische Analyse, was könnte die technische Analyse verb

RAD KRITISCHE NIVEAUS Der RAD-Indikator verfolgt das "relevante Volumen" in Echtzeit, identifiziert Akkumulations- und Distributionsprozesse und projiziert sie im Chart als SUPPORT- oder RESISTANCE-Zonen. Natürliche Unterstützungs- und Widerstandsniveaus werden durch Volumenakkumulations- und -verteilungsprozesse erzeugt. Wenn sich diese Prozesse entwickeln, werden die Niveaus, an denen sich das relevante Volumen auf dem Markt befindet, zu schwierigen Bereichen, die nach oben oder unten durchbr

Indikator für Mehrfachregression Der Indikator stellt die Renditekurve sowie den oberen und unteren Kanal einer Regression für die Schlusskurse des Vermögenswerts im Diagramm dar. Die Ertragskurve ist die Mittellinie des Indikators und stellt den Bereich des Preisgleichgewichts zwischen Verkäufern und Käufern dar. Bei diesem Indikator wählt der Benutzer die Art der Regression, die aus 3 Typen bestehen kann: erster Grad, zweiter Grad oder dritter Grad. Die Diagramme des Indikators sind Mittlere L
FREE

LuXiwu Trend Trading spezielles Wellenmarkierungswerkzeug
0.Haupttabelle einblenden ausblenden Klicken Sie auf den unteren 10%-Bereich der Preisachse, um die Haupttabelle ein- oder auszublenden, oder drücken Sie standardmäßig die Taste Q.
1. QJT-Suche Klicken Sie auf den Hoch- oder Tiefpunkt der Hauptwelle, um automatisch die QJT zu finden. Wenn es Überschneidungen zwischen den inneren und äußeren Intervallen gibt, klicken Sie auf die Schaltfläche << oder >>, um die linke und rechte Seite anz

In dieser Version funktionieren die Alarme, und in der von Ihnen geposteten Version war die atr-Totzone nur eine Totzone ohne atr, also haben Sie sie auch zu einer atr-Totzone gemacht.
Eingabeparameter des Indikators input int Fast_MA = 20; // Zeitraum des schnellen gleitenden MACD-Durchschnitts input int Slow_MA = 40; // Periode des langsamen gleitenden MACD-Durchschnitts input int BBPeriod=20; // Bollinger-Periode input double BBDeviation=2.0; // Anzahl der Bollinger-Abweichungen input int Se
FREE

Der von Charles Le Beau entwickelte und in den Büchern von Alexander Elder vorgestellte Chandelier Exit setzt einen nachlaufenden Stop-Loss auf der Grundlage der Average True Range (ATR). Der Indikator wurde entwickelt, um Händler in einem Trend zu halten und einen vorzeitigen Ausstieg zu verhindern, solange der Trend anhält. Typischerweise liegt der Chandelier Exit während eines Abwärtstrends über den Kursen und während eines Aufwärtstrends unter den Kursen.
Berechnung
Die ursprüngliche Ch
FREE

Es handelt sich um einen Indikator, der nicht neu gezeichnet wird und den kurzfristigen Trend anzeigt. Er enthält die folgenden Funktionen: Visueller Modus MA-Periode MA-Methode MA-Preis
ATR-Zeitraum Volatilitätsfaktor Offset-Faktor Break verwenden Hüllkurven verwenden Verwenden Sie Alert
irgendwelche Vorschläge lassen Sie mich in den Kommentaren wissen und auch Sterne zu posten mehr aktualisierte Inhalte, Indikatoren und Berater.
FREE

Der Trend Envelopes-Indikator wird auf der Grundlage eines Prozentsatzes der Preisänderung berechnet. Dieser Prozentsatz wird dann verwendet, um festzustellen, ob es einen neuen Trend gibt oder der Trend gleich bleibt.
Diese Version verwendet stattdessen die Standardabweichung für die Berechnung der Preisänderung und fügt eine Preisglättung hinzu, die in den Berechnungen verwendet wird. Die Glättung kann mit einem der 4 Durchschnittstypen erfolgen:
* Einfacher gleitender Durchschnitt
* Expo
FREE

Der GGP Squeeze Momentum MT5 Indikator ist ein Volatilitäts- und Momentum-Indikator, der entwickelt wurde, um Händlern zu helfen, ihre Handelsperformance zu optimieren und ihnen verwertbare Erkenntnisse zu liefern, um gut informierte Handelsentscheidungen zu treffen. Dieser Indikator ist eine MT5-Konvertierung des Squeeze Momentum Indikators von "LazyBear" auf der Trading View Website. Es wurden einige Warnmethoden hinzugefügt, um Echtzeit-Warnungen zu liefern, wenn ein Handelssignal generiert w

================ // Durchschnittlicher Zeitraum ma_Sma, // Einfacher gleitender Durchschnitt ma_Ema, // Exponentieller gleitender Durchschnitt ma_Smma, // Geglätteter MA ma_Lwma // Linear gewichteter MA =============== // Durchschnittsmethode // Alarme einschalten? // Warnung zum aktuellen Balken? // Meldungen bei Alarmen anzeigen? // Ton bei Alarmen abspielen? // E-Mail bei Alarmen senden? // Push-Benachrichtigung bei Alarmen senden?
FREE

Unlock the Power of Scalping with this Essential Indicator for Any Currency Pair! Experience Crystal-Clear Buy/Sell Signals and Activate Instant Alerts for Maximum Precision.
Wir stellen den ultimativen Scalping-Begleiter vor: Ihr Schlüssel zu präzisen Gewinnen! Transformieren Sie Ihre Handelsstrategie mit einem Indikator, der den Test der Zeit besteht! In der sich ständig weiterentwickelnden Welt des Tradings hängt der beständige Erfolg von einem intelligenten Risikomanagement ab. Zwar kann
FREE
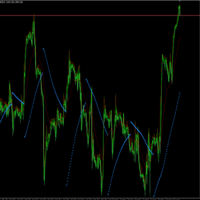
Die Idee dieses Indikators ist die folgende: Ersetzen Sie die Höchst- und Tiefstkurse des SAR-Indikators durch die Werte des Indikators Gleitender Durchschnitt. Am Ende erhalten wir das folgende Bild:
D.h. der SAR-Indikator ändert seine Richtung, nachdem er den Moving Average-Indikator berührt hat.
Eingabeparameter SAR: Schritt - Parameter "Schritt" des SAR-Indikators; SAR: Maximum - Parameter "Maximum" des SAR-Indikators; MA: Periode - Parameter "Mittelungsperiode" des MA-Indikators; MA: Vers
FREE

Dies ist kein herkömmlicher gleitender Durchschnittsindikator. Mit diesem Indikator können Sie Ihren gleitenden Durchschnitt vollständig personalisieren. Sie können den "Quell"-Preis (nicht nur die Standardpreise, die mit Metatrader geliefert werden), den "Zeitraum" und die "geglättete" Berechnung auswählen, die Sie anwenden möchten. Es gibt viele davon, wie SMA (Simple Moving Average), SMMA (Smoothed Moving Average), EMA (Exponential Moving Average), DEMA (Double Exponential Moving Average), TE

Unlock the Power of Scalping with this Essential Indicator for Any Currency Pair! Experience Crystal-Clear Buy/Sell Signals and Activate Instant Alerts for Maximum Precision.
Wir stellen den ultimativen Scalping-Begleiter vor: Ihr Schlüssel zu präzisen Gewinnen! Transformieren Sie Ihre Handelsstrategie mit einem Indikator, der den Test der Zeit besteht! In der sich ständig weiterentwickelnden Welt des Tradings hängt der beständige Erfolg von einem intelligenten Risikomanagement ab. Zwar kann

Beschreibung Hilft Ihnen, die Struktur des Marktes zu erkennen, indem es verschiedene Arten von Smart Money-Konzepten verwendet. Dies sollte Ihnen helfen, Ihre Handelsstrategie in jeder Hinsicht zu verbessern. Smart Money Eigenschaften: Farbige Kerze zur Anzeige der Art der Struktur Zeigt CHOCH und BOS Gleiche Tiefs und Hochs Order Blocks Intern und Swings Schwache und starke Hochs und Tiefs Fair Value Lücken Hochs und Tiefs im täglichen, wöchentlichen und monatlichen Zeitrahmen Premium- und Dis

Gold Venamax – das ist der beste technische Indikator für Aktien. Der Indikatoralgorithmus analysiert die Preisbewegung eines Vermögenswerts und spiegelt die Volatilität und potenzielle Einstiegszonen wider. Indikatorfunktionen: Dies ist ein Super-Indikator mit Magic und zwei Blöcken von Trendpfeilen für komfortables und profitables Trading. Auf dem Diagramm wird eine rote Schaltfläche zum Wechseln von Blöcken angezeigt. Magic ist in den Indikatoreinstellungen eingestellt, sodass Sie den Indika

Mit diesem Indikator können Sie Fibonacci-Level-Beschriftungen in großer Schriftgröße anzeigen
. Es unterstützt bis zu 25 Fibonacci-Stufen
- Sobald Sie Fibonacci zeichnen, werden die Ebenen, die Sie als Eingabeparameter hinzugefügt haben, in großer Schriftgröße mit der von Ihnen gewählten Farbe und Schriftart angezeigt.
Anpassbare Optionen:
1. Fibo-Textschriftart
2. Fibo-Textgröße
3. Fibo-Textfarbe
3. Fügen Sie jeder Ebene eine Beschreibung hinzu
4. Weitere Optionen wie Anker und Grade

Gold Trend - dies ist ein guter technischer Indikator für Aktien. Der Algorithmus des Indikators analysiert die Preisbewegung eines Vermögenswerts und spiegelt die Volatilität und mögliche Einstiegszonen wider.
Die besten Indikatorsignale:
- Für VERKAUFEN = rotes Histogramm + roter SHORT-Zeiger + gelber Signalpfeil in dieselbe Richtung + roter Trendrichtungspfeil . - Für KAUFEN = blaues Histogramm + blauer LONG-Zeiger + aquafarbener Signalpfeil in dieselbe Richtung + blauer Trendrichtungspfe

SSL-Indikator für MetaTrader 5 – Leistungsstarkes Trendfolge-Werkzeug Der SSL-Indikator ist ein äußerst effizientes und zuverlässiges Trendfolge-Tool, das entwickelt wurde, um Tradern zu helfen, Markttrends mit Leichtigkeit und Präzision zu erkennen. Basierend auf gleitenden Durchschnitten ändert der SSL (Step Stop Line)-Indikator seine Farbe und bietet klare visuelle Hinweise, wenn eine potenzielle Trendwende bevorsteht. Dieses Tool ist ideal für Trader, die von starken Markttrends profitieren

Multiwährungs- und Multi-Timeframe-Indikator MACD. Das Dashboard kann sowohl den traditionellen (echten) MACD als auch den in MetaTrader eingebauten MACD anzeigen. Auf dem Panel können Sie den aktuellen Status des Indikators sehen - die Bewegungsrichtung der MACD-Linien, ihren Schnittpunkt und ein Pop-up-Fenster mit dem Indikator-Chart. In den Parametern können Sie beliebige Paar-Symbole und Zeitrahmen angeben. Der Scanner kann auch Benachrichtigungen über sich kreuzende Linien und über Linien,

Der Indikator „ Market Session Times “ zeigt die Zeit von vier Handelssitzungen an: Asien, Europa, Amerika und Pazifik. Die Zeit der Handelssitzungen wird im Format festgelegt GMT und ist daher überhaupt nicht vom Handelsserver abhängig. Dabei werden folgende Daten verwendet: Handelssitzung
Stadt
mittlere Greenwich-Zeit
Asien Tokio
Singapur
Shanghai 00:00–06:00
01:00–09:00 Uhr
01:30–07:00 Uhr Europa London
Frankfurt 07:00–15:30 Uhr
07:00–15:30 Uhr Amerika New York
Chicago 13:30–

Die Kenntnis der Niveaus des Vortages oder der Vorwoche ist eine sehr wichtige Information für Ihren Handel.
Mit diesem Indikator können Sie Vortag Hoch/Tief Hoch/Tief der Vorwoche
Congifuration Hoch & Tief für: Vortag, Woche Linienstil, Farbe Etikettenposition, Größe, Farbe Wenn Sie Fragen oder Kommentare haben, senden Sie mir eine direkte Nachricht hier https://www.mql5.com/en/users/mvonline
FREE

Sessions sind im Handel sehr wichtig und oft ein guter Bereich, in dem man nach einem Setup suchen kann. Im SMC, ICT werden wir nach der asiatischen Session suchen, die als Liquidität dient.
Dieser Indikator zeigt an: Hoch und Tief der asiatischen Sitzung Eröffnungslinie um Mitternacht New Yorker Zeit
Kongifuration Linienart, Farbe Position, Größe und Farbe des Labels Beginn des Levels (Beginn des Tages, Beginn der Sitzung, höchster oder niedrigster Punkt der Sitzung)
Wenn Sie Fragen oder Kom
FREE

Der Market Structures Pro Indikator findet und zeigt 5 (fünf) Muster des Smart Money Concepts (SMC) Systems auf dem Chart an, nämlich:
Bruch der Strukturen (BoS ) Wechsel des Charakters (CHoCH) Gleiche Hochs und Tiefs Premium, Equilibrium und Discount Zonen mit Fibo-Gitter Hoch-Hoch, Tief-Tief, Hoch-Tief und Tief-Hoch Extremwerte
Die Muster werden in zwei Modi angezeigt - Swing und Internal - und sind durch die Farbe auf dem Chart leicht zu unterscheiden. Der interne Modus zeichnet sich durch k

Der Indikator basiert auf der Methodik von Robert Miner, die er in seinem Buch "High probability trading strategies" beschrieben hat, und zeigt Signale zusammen mit dem Momentum von 2 Zeitrahmen an. Ein Stochastik-Oszillator wird als Momentum-Indikator verwendet.
Die Einstellungen sprechen für sich selbst Periode_1 ist der aktuelle Zeitrahmen, 'current' period_2 wird angezeigt - der übergeordnete Zeitrahmen ist 4 oder 5 Mal größer als der aktuelle Zeitrahmen. Wenn der aktuelle Zeitrahmen beisp
FREE

Switch Tray ist ein Shortcut-Tray-Tool für häufig verwendete Handelspaare, das Händlern zur Verfügung steht. Es kann am unteren Rand des Charts platziert werden, und häufig verwendete Handelspaare können selbst festgelegt werden. 1. Sie können die Shortcut-Schaltfläche für Ihre häufig verwendeten Handelspaare festlegen. Die Standardeinstellung ist [EURUSD/GBPUSD/XAUUSD/USDJPY/USDCHF/USDCNH]. / Schrägstrich ist das Trennzeichen. 2. Die Schaltfläche jedes Handelspaares ist auch mit der Anzahl der
FREE

Engulfing-Kerzen-Detektor
Erkennbare Muster Double Candlestick-Muster Bullish Engulfing
Die erste Kerze ist eine schwarze Kerze. Die zweite Kerze eröffnet mit einer Lücke unter dem realen Körper der schwarzen Kerze, erholt sich aber nach oben und schließt über dem realen Körper der schwarzen Kerze. Mit anderen Worten, der reale Körper der zweiten Kerze verschlingt den realen Körper der ersten Kerze vollständig. Bearish Engulfing
Die erste Kerze ist eine weiße Kerze. Die zweite Kerze eröffnet m
FREE
Der MetaTrader Market ist eine einzigartige Plattform für den Verkauf von Robotern und technischen Indikatoren.
Das Merkblatt für Nutzer der MQL5.community informiert Sie über weitere Möglichkeiten: nur bei uns können Trader Handelssignale kopieren, Programme bei Freiberuflern bestellen, Zahlungen über das Handelssystem automatisch tätigen sowie das MQL5 Cloud Network nutzen.
Sie verpassen Handelsmöglichkeiten:
- Freie Handelsapplikationen
- Über 8.000 Signale zum Kopieren
- Wirtschaftsnachrichten für die Lage an den Finanzmärkte
Registrierung
Einloggen
Wenn Sie kein Benutzerkonto haben, registrieren Sie sich
Erlauben Sie die Verwendung von Cookies, um sich auf der Website MQL5.com anzumelden.
Bitte aktivieren Sie die notwendige Einstellung in Ihrem Browser, da Sie sich sonst nicht einloggen können.