Neue technische Indikatoren für den MetaTrader 5 - 60

Trendstärke-Visualisierer Ein einfaches Werkzeug für die Trendanalyse Dieser Indikator hilft Ihnen, die Stärke von Markttrends anhand von schnellen und langsamen gleitenden Durchschnitten schnell zu beurteilen. Er wurde entwickelt, um Ihnen eine klare visuelle Darstellung des Trends zu geben, damit Sie bessere Handelsentscheidungen treffen können. ~Anzeigen: Grüne Linie : Starker Aufwärtstrend (potenzielle Kaufgelegenheiten). Rote Linie : Starker Abwärtstrend (potenzielle Verkaufsgelegenheiten).

Checklisten-Indikator für MT5 Optimieren Sie Ihren Handelsprozess mit dem Checklisten-Indikator - einem leistungsstarken Tool, das Ihnen hilft, diszipliniert und organisiert zu handeln. Mit diesem Indikator können Sie eine personalisierte Checkliste direkt auf Ihrem Chart erstellen und verwalten, um sicherzustellen, dass Sie Ihre Handelsregeln befolgen, bevor Sie eine Position eingehen. ️ Passen Sie Ihre eigene Handels-Checkliste an
️ Bleiben Sie konsistent und vermeiden Sie impulsive Trades

Der Indikator Previous High Low Levels zeigt den Höchst- und Tiefststand der vorherigen Kerze in einem ausgewählten höheren Zeitrahmen an. Dies hilft Händlern, wichtige Unterstützungs- und Widerstandszonen beim Handel auf niedrigeren Zeitrahmen zu identifizieren. Features:
Zeigt das vorherige Hoch und Tief eines höheren Zeitrahmens an
Funktioniert auf allen Zeitrahmen und Instrumenten
Hilft bei der Identifizierung starker Unterstützungs- und Widerstandsniveaus
Leichtgewichtig und wi
FREE

Der Matrix Series-Indikator analysiert die Kursentwicklung, die gleitenden Durchschnitte und die Volatilität, um Trendbedingungen zu erkennen. Aufwärtstrend: Grüne Zonen oder Aufwärtssignale weisen auf einen starken Aufwärtstrend hin, ideal für Long-Positionen. Baisse-Trend: Rote Zonen oder Abwärtssignale deuten auf einen Abwärtstrend hin und sind ideal für Short-Positionen. Seitwärtstrend/Neutraler Markt: Nicht hervorgehobene oder graue Zonen zeigen Perioden der Marktkonsolidierung oder geringe

Eine der genauesten Methoden zur Vorhersage von Kursbewegungen ist die Ermittlung von Ungleichgewichten. Wenn wir signifikante Preisungleichgewichte (auch bekannt als Fair-Value-Gaps oder fvgs/ifvgs) erkennen, ist es relativ einfach, auf der Grundlage von Fortsetzungen und Rücksetzungsbewegungen Trades zu platzieren. Ein gleitender Durchschnitt bietet einfach nicht annähernd die Präzision, die wir finden, wenn wir die Reaktion des Preises auf ein Ungleichgewicht beobachten. Es gibt einige Produk
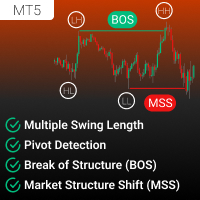
Der 1TF BOS/MSS Indikator ist ein leistungsstarkes Werkzeug, das entwickelt wurde, um die Marktstruktur direkt in einem einzelnen Zeitrahmen auf Ihrem Chart zu analysieren und zu visualisieren. Dieser Indikator ermöglicht die präzise Erkennung von Marktstrukturbrüchen (BOS) und Marktstrukturverschiebungen (MSS), wodurch Händler Schlüsselwendepunkte und Trendfortsetzungen mit Leichtigkeit identifizieren können. Dank seiner anpassbaren Einstellungen und detaillierten Anmerkungen ist er ein unverzi

MACD Classic: Konvergenz/Divergenz-Indikator für gleitende Durchschnitte für MT5 Entwickelt für fortgeschrittene Trader, die Präzision und Anpassungsfähigkeit in ihren Handelsstrategien suchen. Der MACD Classic ist ein maßgeschneiderter technischer Indikator, der mit MQL5 für MetaTrader 5 entwickelt wurde und optimiert ist, um Ihnen klare Signale für die Konvergenz und Divergenz von gleitenden Durchschnitten zu bieten. Er hilft Ihnen dabei, Trends und Ein-/Ausgangspunkte effizienter zu identifiz

Dieser Indikator zeichnet Angebots- und Nachfragezonen in das Diagramm ein. In Kombination mit Ihren eigenen Regeln und Techniken können Sie mit diesem Indikator Ihr eigenes leistungsstarkes System erstellen (oder verbessern). Bitte sehen Sie sich auch die kostenpflichtige Version an, die viel mehr bietet. Ich empfehle, nach Handelsmöglichkeiten zu suchen, bei denen der erste Zonentest nach mindestens 25 Balken erfolgt. Merkmale Die Zonen haben 3 Farben (durch Eingabe einstellbar). Dunkle Fa
FREE
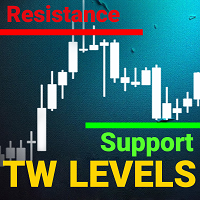
support resistance levels indicator mt5:
Dieses Tool ist ein Multi-Zeitrahmen-Indikator, der Support- und Widerstandslinien sowie Fibonacci-Niveaus mit der gleichen Genauigkeit wie das menschliche Auge auf einem Chart identifiziert und darstellt. Die TW-Support- und Widerstandsniveaus für Forex verfügen über einen komplexen Algorithmus, der das Chart scannt, um frühere Preisstabilisierungs- und Rückprallniveaus zu identifizieren und die Anzahl der Berührungen aufzuzeichnen.
Sind Sie es leid
The Channel Sgnals ProfRoboTrading Indicator for MT5 is an effective Forex trading tool designed to track market movements. The MT5 signal point indicator effectively detects trend reversals after they have already occurred. This Indicator is a fully automated technical tool that includes a number of parameters to track market trends. It automatically examines the ever-changing price dynamics of the market, compares the information with earlier data and generates a trading signal. Because
FREE

VWAP FanMaster: Perfektioniere deine Pullback-Strategie!
Der VWAP FanMaster ist das ultimative Werkzeug für Trader, die nach präzisen Einstiegen und effizienten Pullbacks suchen. Er kombiniert die Stärke von VWAP (Volume Weighted Average Price) mit Fibonacci-Fächerlinien und bietet eine klare Karte der wichtigsten Preisbereiche im Markt. Hauptfunktionen Einfach und leistungsstark : Ziehe die vertikalen Linien, und der Indikator zeichnet automatisch VWAP und Fibonacci-Fächer .
Effizie
FREE
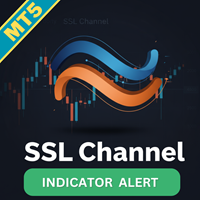
Erhöhen Sie Ihre Trading-Präzision mit dem SSL Channel Indicator MT5 , einem dynamischen Tool, das entwickelt wurde, um Preistrend-Dynamiken durch den innovativen Semaphore Signal Level (SSL)-Ansatz zu visualisieren. Verwurzelt in technischen Analysekonzepten, die in Trading-Communities wie MQL5 und Forex Factory populär wurden, verwendet dieser Indikator zwei 10-Perioden einfache gleitende Durchschnitte (SMAs)—einen für Hochs und einen für Tiefs—um einen anpassungsfähigen Preiskanal zu bilden

The Forex Gangster Indicator allows you to determine the current trend. If the Forex Gangster Indicator line has moved below the price and turned blue, then you should open deals for an increase. If the Forex Gangster Indicator line has appeared above the price and turned red, then you should open deals for a decrease: The indicator is suitable for any time frames, but it needs to be supplemented with filtering indicators, since by itself it is late and does not have time to give an accurate si
FREE
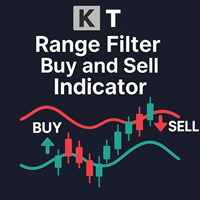
Der KT Range Filter Buy and Sell-Indikator vereinfacht kleinere Preisbewegungen und Schwankungen, indem er sie in einen gleichmäßigeren und klar definierten Trend umwandelt. Während die QQE-Glättung normalerweise auf den RSI angewendet wird, überträgt dieser Indikator das Konzept direkt auf den Preis und bietet so einen einzigartigen und effektiven Ansatz zur Marktanalyse.
Er verfügt über eine Drei-Band-Struktur, bestehend aus einer zentralen Durchschnittslinie sowie einer oberen und einer unt

The Teamtrader Channel Stop indicator allows you to determine the current trend. If the Teamtrader Channel Stop indicator line has moved below the price and turned blue, then you should open deals for an increase. If the Teamtrader Channel Stop indicator line has appeared above the price and turned red, then you should open deals for a decrease: The indicator is suitable for any time frames, but it needs to be supplemented with filtering indicators, since by itself it is late and does not have
FREE

SlopeChannelB – ein technisches Analysewerkzeug, das einen geneigten Preisbewegungskanal erstellt und einzigartige Möglichkeiten bietet, den aktuellen Marktstatus zu bewerten und Handelssignale zu finden. Hauptmerkmale des Indikators: Geneigter Preisbewegungskanal :
Der Indikator hilft dabei, Unterstützungs- und Widerstandsniveaus zu visualisieren, die mögliche Umkehrpunkte oder die Fortsetzung des Trends anzeigen können. Verschiedene Linienfarben und Hintergrundhervorhebung :
Geneigte Unte

The GoldenBufferPattern indicator uses several indicator buffers (Candles+Fractals+ZigzagColor+ColorMaLine).
The indicator is recommended to be used together with other indicators or using the Martinheim Method. We use this method with this indicator, as well as some of our other proprietary filters and trading strategies in particular, in our Experts Advisors on ProfRoboTrading.
Revolutionsieren Sie Ihr Trading, entschlüsseln Sie die Geheimnisse der Marktdynamik mit dem Predator Expansion Contraction Candles-Indikator: Stellen Sie sich vor, Sie könnten die geheime Sprache der Märkte entschlüsseln und die Flüsse und Strömungen der Preisbewegungen mit erstaunlicher Präzision vorhersagen. Willkommen beim Predator Expansion Contraction Candles-Indikator, einem bahnbrechenden Werkzeug, das Ihr Trading auf neue Höhen hebt, indem es unvergleichliche Einblicke in die Phasen de
Grundlegende Informationen. Um seine Arbeit zu verrichten, nimmt der Indikator Daten über Volumina aus einem niedrigeren Zeitrahmen, erstellt Marktprofile für einen höheren Zeitrahmen und ein Histogramm für den aktuellen Zeitrahmen. Der Indikator startet in mehreren Stufen. In diesem Fall werden Meldungen wie: "Build Source & Target TF. Step: ..." werden im Protokoll ausgegeben. Der Prozess kann beschleunigt werden, indem der Eingabeparameter Millisekunden zwischen den Schritten - die Initialisi

Pfeil-Indikator für den Forex-Handel mit Scalping-Strategie auf beliebte Währungspaare, Bitcoin, Gold, auf m1-Zeitrahmen und andere. Der Indikator verfügt über Einstiegspunkt-Einstellungen, Trend-Einstellungen für höhere Zeitrahmen und verschiedene Indikator-Filter, es ist auch möglich, Zeit-Handelsintervalle für sich selbst einzurichten, in denen Sie Signalpfeile über den Kerzen erhalten, sowie Pop-up-Fenster mit Alarmen oder Benachrichtigungen auf Ihrem Telefon über ID. Die Einstellungen sind
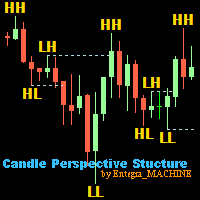
Candle Perspective Structure Indicator MT5 ist ein einfacher Indikator, der die Candlestick-Struktur des Marktes definiert und anzeigt. Dieser Indikator eignet sich sowohl für erfahrene Trader als auch für Anfänger, denen es schwer fällt, die Struktur visuell zu verfolgen.
Wenn Sie weitere hochwertige Produkte sehen oder die Entwicklung/Umsetzung Ihrer eigenen Produkte in Auftrag geben möchten, besuchen Sie die Website meiner Partner: 4xDev
Erhalten Sie 10% Rabatt auf manuelle Strategien, Aut
FREE

Das Opportunity System: Forex-Gold-Indikator Das Opportunity System ist ein leistungsstarker und intuitiver Forex-Gold-Indikator, der Händlern helfen soll, erstklassige Einstiegs- und Ausstiegspunkte für den Goldhandel (XAU/USD) zu identifizieren. Dieser fortschrittliche Indikator kombiniert die Stärken von zwei der beliebtesten technischen Analyseinstrumente - dem Stochastik-Oszillator und dem MACD (Moving Average Convergence Divergence) - um präzise Echtzeit-Einblicke in Markttrends und potenz
If you love this indicator, please leave a positive rating and comment, it will be a source of motivation to help me create more products <3 Wichtigste Erkenntnisse VWAP ist eine Handelsbenchmark, die in der Regel für kurzfristige Händler am nützlichsten ist. Der VWAP wird von Händlern auf unterschiedliche Weise genutzt : Händler können ihn als Trendbestätigungsinstrument nutzen und Handelsregeln darauf aufbauen . Auch Wenn die Kurse unter dem VWAP liegen und sich darüber bewegen, kann dies von
FREE
Adaptive Trend-Metrix Adaptive Trend Metrix ist ein fxtool zur Beurteilung der aktuellen Marktlage, das sich an Veränderungen der Volatilität anpasst und dabei hilft, die Richtung und Stärke des Trends unter Berücksichtigung der Preisdynamik zu bestimmen. Ein Aspekt dieser Strategie ist die Fähigkeit, verschiedene Parameter auf der Grundlage des Preisverhaltens zu ändern und zu verwenden. So berücksichtigt sie beispielsweise die aktuelle Marktvolatilität, um die Empfindlichkeit gegenüber Kurssc
r-Trend Sync Indikator ist ein manuelles Handelssystem für Märkte mit hoher Volatilität. Hauptmerkmale des Systems : Der Algorithmus des Indikators basiert auf der Analyse umfangreicher historischer Daten (ab 1995 für EURUSD & EURJPY und ab 2004 für XAUUSD), die die Identifizierung allgemeiner Muster im Verhalten dieser Paare über eine breite Palette von Zeitrahmen gewährleistet. Durch die Analyse historischer Daten konnte das System lernen, Marktauslöser für mittelfristige Trends und Zyklen zu
SynRhythmic Points Oscillator ist ein innovatives manuelles Handelssystem, das auf der Kombination von zwei analytischen Ansätzen beruht, von denen sich der eine auf kurzfristige Preisänderungen und der andere auf die Identifizierung stabiler Trends und Abhängigkeiten konzentriert. Diese Synergie ermöglicht es, hervorragende Signale für den Einstieg in den Markt zu erhalten und gleichzeitig den Einfluss zufälliger Schwankungen zu minimieren und falsche Signale zu reduzieren. Darüber hinaus kann
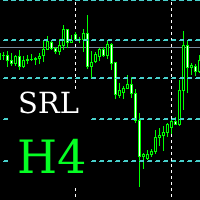
Ein Indikator zur Bestimmung und Anzeige von Unterstützungs- und Widerstandsniveaus auf dem H4-Chart über die letzten 180 Tage. Der Algorithmus sucht nach lokalen Minima und Maxima, filtert die Niveaus, um eng beieinander liegende Werte zu eliminieren, und visualisiert sie dann in einem Diagramm. Definition von Schlüsselniveaus Unterstützungsniveaus: Tiefststände, bei denen sich der Kurs verlangsamt oder nach oben gedreht hat. Widerstandsniveaus: Höchststände, bei denen der Kurs nur schwer weite

Der Market Master ist ein umfassender All-in-One-Handelsindikator, der zur Verbesserung Ihrer Handelsstrategie entwickelt wurde
Funktionen:
Trend-Filter VWAP Bruch der Strukturmuster Tägliche, wöchentliche, monatliche Hochs/Tiefs Fraktale Kanäle Volumen-Profil Währungsstärke-Meter Fair-Value-Lücke Nachrichten-Filter
Die Idee hinter diesem Indikator war es, ein Handelsinstrument zu schaffen, das alles hat, was ein Trader braucht

Der KT Dynamic Price Oscillator (DPO) bietet einen speziellen Ansatz zur Analyse von Trend, Momentum und Volatilität von Finanzinstrumenten. Er zeichnet sich dadurch aus, dass er Trendfortsetzungen, überkaufte oder überverkaufte Bedingungen und potenzielle Umkehrpunkte präzise identifiziert. Er wurde speziell entwickelt, um Händler bei der Identifizierung kurzfristiger Kurszyklen und potenzieller Umkehrpunkte zu unterstützen, indem er langfristige Trends effektiv herausfiltert.
So verwenden Si
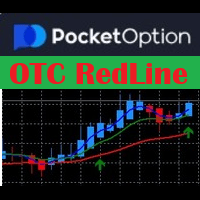
Benutzerdefinierter Heiken Ashi und auf gleitenden Durchschnitten basierender Signalindikator Übersicht
Dieser auf Heiken Ashi und gleitenden Durchschnitten basierende Indikator wurde entwickelt, um trendfolgende Kauf- und Verkaufssignale zu identifizieren, indem er die Beziehung zwischen drei exponentiellen gleitenden Durchschnitten (EMAs) analysiert. Er wendet die Heiken Ashi-Glättung an, um Marktgeräusche zu filtern und die Trendklarheit zu verbessern. EMA-Crossovers zur Trenderkennung - Ve

Dieser Indikator zeigt die tägliche Spanne eines ausgewählten Paares direkt auf Ihrem Chart an und bietet so einen klaren und präzisen Überblick über die Bewegung des Paares während des Tages. Er vereinfacht die Verfolgung der Bewegung eines Paares und bietet Händlern einen praktischen Vorteil bei der Analyse der Marktaktivitäten. Diese Funktion ist besonders nützlich, um schnellere und präzisere Handelsentscheidungen zu treffen. Egal, ob Sie Anfänger oder erfahrener Händler sind, es hilft Ihne
FREE
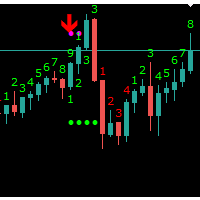
Anzeiger Sequential Durch einen mehrstufigen Kursvergleichsprozess, der aus den Indikatoren Setup und Countdown besteht, analysiert der Sequential-Indikator ansonsten inkongruente Kursdaten, um einen Einblick in die Stärke oder Schwäche des Markttrends und die Wahrscheinlichkeit einer Umkehr zu geben Die Mechanik des Sequential-Indikators Wir haben die Nummer des Marktes Die meisten DeMARK-Indikatoren sind so konzipiert, dass sie eine Preiserschöpfung vorwegnehmen, anstatt dem Trend zu folgen.
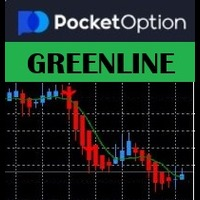
ocket Options GreenLine Strategie - SMA(7) Crossover & Trend Alert Indikator Letzte Aktualisierungen: Verkaufswarnungen innerhalb eines Aufwärtstrends hinzugefügt - Wenn MA1 unter MA2 kreuzt, ohne unter MA3 zu fallen, wird eine Verkaufswarnung ausgelöst. Verbesserte Alarmlogik - Verhindert doppelte Kauf- und Verkaufssymbole auf jeder Kerze. Verbessertes Druckstatement - Alarme werden jetzt direkt in der Datei alerts.txt gespeichert, damit Sie sie später nachlesen können. Jetzt kompatibel mit Hei

Session Liquidity ist die am meisten erwartete Handelsstrategie unter den ICT-Händlern. Mit diesem Indikator können Sie den Handel einrahmen, indem Sie ihn einfach auf dem Chart einsetzen. Geben Sie einfach die asiatische Eröffnungszeit und die New Yorker Eröffnungszeit ein und wählen Sie die gewünschte Farb- und Anzeigeoption aus, dann wird die Sitzung auf dem Diagramm angezeigt. Sie können wählen, ob die Session als Box oder als horizontale Linie angezeigt werden soll. Ich persönlich handele m

Sind Sie bereit, Ihr Handelsspiel zu verbessern und unvergleichliche Genauigkeit bei Marktvorhersagen zu erleben? Der Scalping Range Grid Indicator ist nicht nur ein Werkzeug, sondern Ihre Hauptwaffe, um die nächste Bewegung an den Finanzmärkten zu erkennen. Dieser hochmoderne Indikator wurde für Händler entwickelt, die nur das Beste wollen. Er nutzt die Kraft der gitterbasierten Analyse, um künftige Preisdurchgangszonen mit unübertroffener Präzision zu scannen. Stellen Sie sich vor, Sie wüsste

Wir stellen Ihnen unseren fortschrittlichen Indikator vor, ein bahnbrechendes Tool zur Identifizierung von Unterstützungs- und Widerstandszonen mit unübertroffener Präzision. Verbessern Sie Ihre Handelsstrategie mit einer Vielzahl von Funktionen, einschließlich eines zweifarbigen oberen und unteren Kastensystems, das eine einfache visuelle Erkennung von Markttrends ermöglicht.
Hauptmerkmale: Zweifarbige Box für die Unterstützungs- und Widerstandszonen Passen Sie Ihre Analyse mit der zweifarbige

Haven Volume Profile ist ein multifunktionaler Indikator für die Analyse des Volumenprofils, der dabei hilft, wichtige Preisniveaus basierend auf der Verteilung des Handelsvolumens zu identifizieren. Er wurde für professionelle Trader entwickelt, die den Markt besser verstehen und wichtige Einstiegspunkte sowie Ausstiegspunkte für ihre Trades erkennen möchten. Andere Produkte -> HIER Hauptfunktionen: Berechnung des Point of Control (POC) - des Niveaus mit der höchsten Handelsaktivität, um die l
FREE

BESCHREIBUNG
ICSM (Impulse-Correction SCOB Mapper) ist ein Indikator, der die Preisbewegung analysiert und gültige Impulse, Korrekturen und SCOBs (Single Candle Order Block) identifiziert. Es ist ein leistungsstarkes Werkzeug, das mit jeder Art von technischer Analyse verwendet werden kann, da es flexibel, informativ und einfach zu bedienen ist und das Bewusstsein des Händlers für die liquidesten Interessenzonen erheblich verbessert.
EINSTELLUNGEN
Allgemein | Visuals
Farbthema — definiert d
MT4-Version: https://www.mql5.com/en/market/product/129411 MT5-Version: https://www.mql5.com/en/market/product/129412
Dashboard-Scanner Kalman – Multi-Paar- und Multi-Zeitrahmen-Scanner
All-in-One-Scanner für intelligente Trenderkennung mit Kalman-Filter-Technologie
Der Dashboard-Scanner Kalman ist ein fortschrittlicher Scanner, der auf dem modifizierten Kalman-Filter-Trendlevel-Algorithmus basiert und Trendrichtung, Signallevel und Trendstärke über mehrere Zeitrahmen und mehrere Symbole hin
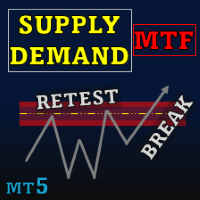
Special offer : ALL TOOLS , just $35 each! New tools will be $30 for the first week or the first 3 purchases ! Trading Tools Channel on MQL5 : Join my MQL5 channel to update the latest news from me Supply Demand Retest and Break Multi Timeframe , dieses Tool zeichnet Angebots- und Nachfragezonen basierend auf starken Momentum-Kerzen und ermöglicht es Ihnen, diese Zonen über mehrere Zeitrahmen hinweg mit der Funktion timeframe selector zu identifizieren. Mit Retest- und Break-La
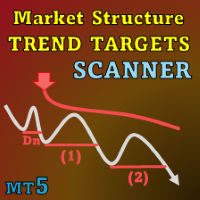
Special offer : ALL TOOLS , just $35 each! New tools will be $30 for the first week or the first 3 purchases ! Trading Tools Channel on MQL5 : Join my MQL5 channel to update the latest news from me I. Einführung
Market Structure Trend Targets Scanner ist ein leistungsstarkes Werkzeug zur Analyse von Markttrends, zur Identifizierung von Ausbruchspunkten und zur Risikomanagement über einen dynamischen Stop-Loss. Durch die Verfolgung vorheriger Hochs und Tiefs zur Identifizierung von

This indicator works by plotting fractals on the chart as arrows that can be used as buy or sell signals. It is a great tool for both new and experienced traders as it provides a clear visual representation of the market and helps traders identify fractals. Although it repaints, it can be used quite effectively in conjunction with other tools to filter trading strategies.
We use this indicator in this way in our Royal Fractals EA, which you can purchase on the MQL5 Market: https://www.mql5.com
FREE

Pivot Math Support and Resistance Lines indicator — indicator showing pivot lines, which will definitely help every trader who knows how to trade with resistance, support and pivot lines. It shows 8 different lines (additional lines are also possible) on the main chart, helping you find the best points to buy, sell and exit positions. Input parameters: P (default = 64) — period in bars or other periods (set using MMPeriod), on which the lines will be calculated. The smaller this number, the "f
ParabolicSAR_Fibo_Channel is an indicator built not on the price deviation from the last extremum, as in a regular similar filter, but on the readings of Parabolic SAR and its intersection with the price chart. As a result, the indicator has a smaller delay in determining a new reversal point. In addition, the filter very conveniently built in Fibonacci levels, which are built on the basis of three consecutive ZigZag peaks, as well as a channel built on the same points. As a result, this indicat
Regression_Channel_mod Indicator that expands our standard linear regression channel by adding support and resistance lines. Easy to integrate into other indicators.
The linear regression channel consists of several parallel lines equidistant from the upper and lower part of the linear regression trend line. The distance between the channel boundaries and the regression line is equal to the deviation of the maximum closing price from the regression line.
FiboPivotsIndicator is the indicator for intraday traders looking for key breakout levels and target levels on the chart. It uses automatic Fibonacci extensions and pivot points to highlight price event areas. FiboPivotsIndicator is a unique combination of Fibonacci extensions and pivot points for price action traders.
This breakout trading tool is suitable for both trend following and swing trading strategies. Indicators such as moving averages, stochastics and RSI are well suited for this

Um Zugang zur MT4-Version zu erhalten, klicken Sie bitte auf https://www.mql5.com/en/market/product/130055 - Dies ist die exakte Umsetzung von TradingView: "Ut Alart Bot Indikator". - Für weitere Änderungen, die Sie benötigen, können Sie eine Nachricht im privaten Chat senden. Hier ist der Quellcode eines einfachen Expert Advisors, der auf den Signalen von Ut Bot Indicator basiert. #property copyright "This EA is only education purpose only use it ur own risk" #property link " https://site
FREE
Heat Map Indicator - Erweiterte Volumenanalyse
Wir stellen den Heat Map Indicator vor - ein professionelles Tool zur Analyse des Marktvolumens!
**Schlüsselmerkmale**
**Visuelle Heat Map** - Sofortige Visualisierung der Volumenintensität durch Farben - Blau: Geringes Volumen - Grün: Mittlere Lautstärke - Gelb/Orange: Zunehmende Lautstärke - Rot: Hohe Lautstärke
**Intuitive Schnittstelle** - Dynamische Farbskala - Echtzeit-Prozentanzeige - Anzeige des aktuellen Füllstands - Anpassbare Farben

Chronolines - Zeitliche Unterstützungs- und Widerstandsniveaus für MetaTrader 5 Einführung in Chronolines
Chronolines ist ein grafischer Indikator, der zeitliche Unterstützungs- und Widerstandsniveaus anhand der Höchst- und Tiefstwerte von vier vordefinierten Perioden identifiziert und visualisiert. Er ist mit allen auf dem MetaTrader 5 verfügbaren Vermögenswerten kompatibel, einschließlich Aktien, Währungen, Rohstoffen, Indizes und Kryptowährungen, und bietet einen logischen und strukturierten
FREE

wenn Sie es testen wollen: private Nachricht an mich (MT5-Demotest funktioniert nicht ) Entwickelt, um Händlern zu helfen, ein tieferes Verständnis für die tatsächliche Dynamik des Auftragsflusses am Markt zu erlangen . Durch die Visualisierung der " Fußabdrücke ", die von den Kerzen hinterlassen werden, zeigt dieser Indikator, wie sich das Delta ( die Differenz zwischen Kauf- und Verkaufsdruck ) während der Kerzenbildung verändert und wie das Volumen bei verschiedenen Kursniveaus schwankt. Dies

Das Wechseln zwischen Charts zur Analyse von Markttrends über mehrere Zeitrahmen hinweg kann schnell zu einer lästigen Aufgabe werden. Um fundierte Handelsentscheidungen treffen zu können, ist es unerlässlich, eine Übereinstimmung zwischen den verschiedenen Zeitfenstern zu finden. Dieser innovative Indikator vereinfacht diesen Prozess, indem er es Ihnen ermöglicht, Trends auf mehreren niedrigeren Zeitrahmen direkt von einem Chart mit höherem Zeitrahmen aus zu sehen. Mit diesem Indikator können S
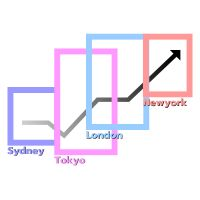
Zeitzonen und der Devisenmarkt
Der Devisenmarkt ist rund um die Uhr in Betrieb, was durch seine weltweite Verteilung über verschiedene Zeitzonen erleichtert wird. Der Markt wird von vier Haupthandelsplätzen beherrscht: Sydney , Tokio , London und New York . Jeder Handelsplatz hat spezifische Öffnungs- und Schließungszeiten, die sich nach seiner jeweiligen Zeitzone richten. Diese Unterschiede wirken sich erheblich auf die Marktvolatilität und die Handelsmöglichkeiten während jeder Sitzung aus.
FREE
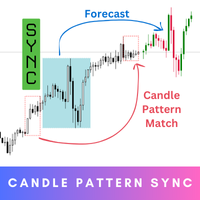
Candle Pattern Sync ist Ihr ultimatives Werkzeug für Präzision und Einblick in den Handel. Treten Sie ein in die Zukunft des Handels mit diesem innovativen Indikator, der Ihnen hilft, das Marktverhalten zu verstehen, indem er historische Muster analysiert und Ihnen eine Vorstellung davon gibt, was als nächstes kommen könnte. Die Prognosen liefern zwar wertvolle Wahrscheinlichkeiten, die auf der Geschichte basieren, sind aber keine Garantien - betrachten Sie sie als einen leistungsstarken Leitfad
Es ist unser Jahrestag! Um uns zu revanchieren, gibt es für die nächste Woche 60% Rabatt (Originalpreis $239)
Wir haben alle unsere geliebten Indikatoren wie z.B.: Key-Level-Order-Block , Key-Level-Angebot und -Nachfrage , Key-Level-Liquiditätsgrab und Key-Level-Keil in einem einzigen Indikator und Dashboard.
Was ist neu? Dashboard : Es gibt ein leicht zugängliches Dashboard für alle Ihre Bedürfnisse. Multi-Timeframe-Schaltfläche : Es gibt jetzt eine Multi-Timeframe-Option für Order-Blöcke und
BBVectorDynamics_indicator ist ein innovatives Handelssystem, das speziell für volatile Märkte entwickelt wurde. Basierend auf einzigartigen Algorithmen zur Analyse von Marktkräften und zur Identifizierung von Ungleichgewichten zwischen Käufern und Verkäufern, hilft Ihnen dieses System, präzise und wohlüberlegte Entscheidungen im Handelsprozess zu treffen. Hauptmerkmale des bb vector dynamics_indicator:
Berechnung von dynamischen Vektoren. Das System ermittelt die Differenzen zwischen den extr
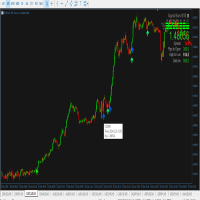
Dynamischer Center of Gravity-Indikator Revolutionäres Price Action Trading System Nutzen Sie die Kraft des Kursmomentums mit dem Dynamic Center of Gravity-Indikator - einem fortschrittlichen Price-Action-Trading-Tool, das für ernsthafte Trader entwickelt wurde. Dieser innovative Indikator identifiziert starke Gravitationszonen, die rasche Kursbewegungen anziehen, und schafft so hochwahrscheinliche Handelsmöglichkeiten, wenn das Momentum aus diesen Zonen ausbricht. Wichtigste Merkmale Reine Prei
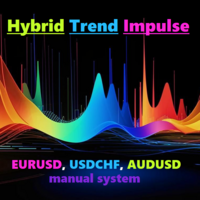
Der Hybrid-Trend-Impuls-Indikator ist ein fortschrittliches Instrument, das moderne Ansätze zur Trend- und Impulsanalyse kombiniert und einzigartige Möglichkeiten für ein effektives Depotmanagement bietet. Die wichtigsten Vorteile des HybridTrendImpulse_Indikators: Nichtlineare Dynamik: Die Methode der Interaktion zwischen den Eröffnungskursen bildet ein einzigartiges nichtlineares Modell, das besonders empfindlich auf signifikante Kursschwankungen reagiert, was deren Bedeutung erhöht und den I

Golden Trend Pulse - ein Trendindikator, der speziell für Gold entwickelt wurde und auch für die Märkte für Kryptowährungen und Aktien anwendbar ist. Der Indikator wurde für die präzise Bestimmung von Markttrends mithilfe fortschrittlicher Analysemethoden entwickelt. Das Tool kombiniert eine multifaktorielle Analyse der Preisdynamik und eine adaptive Filterung des Marktrauschens, was eine hohe Genauigkeit bei der Identifizierung von wichtigen Ein- und Ausstiegspunkten gewährleistet. Dank seines
CrossPoint5 ist ein Indikator, der unerfahrenen Händlern hilft.
Neben der Standardfunktion "Fadenkreuz" (Strg + F) zeigt Ihnen CrossPoint5 , wie Sie die StopLoss- und TakeProfit-Levels unter Berücksichtigung des zulässigen Mindestniveaus richtig einstellen, die Anzahl der Punkte zwischen zwei Punkten berechnen und diese in die Währung des Kontos umrechnen, wobei das erwartete Lot der Transaktion berücksichtigt wird.
Manchmal vergisst ein unerfahrener Händler bei der Eröffnung eines Geschäfts

Präsentation: Entdecken Sie eine fortgeschrittene Version des Stochastik-Oszillator-Indikators, die für anspruchsvolle Trader entwickelt wurde. Dieses Tool integriert akustische und visuelle Warnungen bei Überkreuzungen auf bestimmten Niveaus und liefert präzise Analysen und klare Signale zur Optimierung Ihrer Handelsentscheidungen. Hauptmerkmale: Akustische Warnungen: Automatisches akustisches Signal bei einem zinsbullischen Crossover (%K kreuzt %D nach oben) zwischen den Niveaus 0 und 60. (Ein
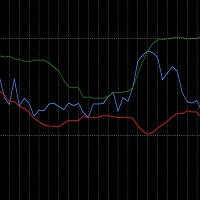
Der RSI_BBands ist ein benutzerdefinierter Indikator, der den Relative Strength Index (RSI) und die Bollinger Bands (BB) für eine verbesserte Marktanalyse kombiniert. Er berechnet den RSI unter Verwendung eines bestimmten Zeitraums (Standardwert 14) und legt Bollinger-Bänder über die RSI-Werte, wobei die Parameter für den Zeitraum und die Abweichung der Bollinger-Bänder einstellbar sind. Sie können mehr finden kostenlos e Produkte finden Sie HIER . Wenn Sie auf der Suche sind nach einem geringe
FREE

If you love this indicator, please leave a positive rating and comment, it will be a source of motivation to help me create more products <3 Wichtigste Erkenntnisse Bulls Bears Eyes ist eine andere Version des Laguerre RSI. Verwenden Sie Bull/Bear Power zum Berechnen. Ein Verwendungszweck des Bulls Bears Eyes ist es, Trends zu erkennen. Dies geschieht, indem man nach anhaltenden Perioden sucht, in denen der Indikator über oder unter der 0,5-Linie liegt. Außerdem wird ein Kaufsignal generiert, w
FREE
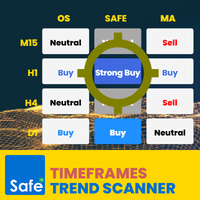
Timeframes Trend Scanner ist ein Trend-Analysator oder Trend-Screener-Indikator, der Ihnen hilft, den Trend in allen Zeitrahmen des ausgewählten Symbols, das Sie beobachten, zu erkennen .
Dieser Indikator liefert klare und detaillierte Analyseergebnisse auf einem schönen Dashboard, so dass Sie diese Ergebnisse sofort nutzen können, ohne dass Sie eine zusätzliche Analyse durchführen müssen. Wie es funktioniert
Schritt 1: Berechnen Sie die Werte von 23 ausgewählten und bewährten technischen Indik

Der Pivot-Indikator ist ein wichtiges Instrument für die technische Analyse, das von Händlern an den Finanzmärkten verwendet wird. Dieser Indikator wurde entwickelt, um potenzielle Umkehrpunkte oder Trendwechsel zu erkennen, und bietet wertvolle Einblicke in die Schlüsselpositionen auf dem Markt. Zu den wichtigsten Merkmalen des Pivot-Indikators gehören: Automatische Berechnungen: Der Pivot-Indikator berechnet automatisch den Pivot-Punkt sowie die Unterstützungs- und Widerstandsniveaus auf der G
FREE
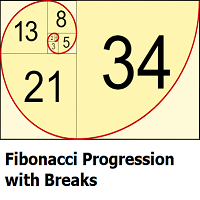
Dieser Indikator hebt Punkte hervor, an denen der Preis erheblich von einem zentralen Niveau abweicht. Diese Abweichung wird durch einen vom Benutzer festgelegten Wert oder durch ein Vielfaches einer Periode 200 Atr bestimmt und mit den aufeinanderfolgenden Werten der Fibonacci-Folge multipliziert. Einstellungen
Methode: Abstandsmethode, Optionen sind "Manuell" oder "Atr"
Größe: Abstand in Punkten, wenn die ausgewählte Methode "Manuell" ist, oder Atr-Multiplikator, wenn die ausgewählte Methode
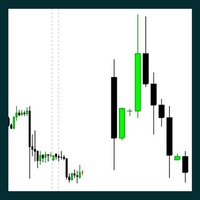
Der Indikator ist nützlich für professionelle Trader, wie z.B. ICT, Smart Money Concept Trader, die eine Top-Down-Analyse durchführen und die Kerzen des höheren Zeitrahmens auf dem niedrigeren Zeitrahmen anzeigen möchten. Er ermöglicht es Ihnen, in Ihrem Einstiegszeitrahmen zu bleiben, während Sie die Erzählung des höheren Zeitrahmens verfolgen. Hier sind einige einfache Eingaben: Anzahl der Bars: Die Gesamtzahl der HTF-Kerzen, die Sie anzeigen möchten. Automatischer Zeitrahmen: Wenn dies der Fa
Dies ist das Parabolic Dashboard MT5. Dieses Dashboard scannt mehrere Zeitrahmen und Symbole in MT5-Plattform, von M1 Chart zu D1 Chart. Es sendet die Kauf-/Verkaufssignale durch eine Warnung auf der Plattform oder eine Benachrichtigung an Ihr Telefon oder eine Nachricht per E-Mail.
Das Kaufsignal wird generiert, wenn der SAR seine Position von oben nach unten der Kerze ändert. Das Verkaufssignal wird generiert , wenn der SAR seine Position von unten nach oben der Kerze ändert . Die Farbe des Au
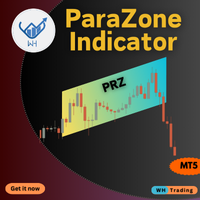
Der ParaZone-Indikator MT5 hilft Ihnen dabei, Bereiche zu erkennen, in denen sich Kurstrends wahrscheinlich umkehren werden. Er markiert diese Zonen auf Ihrem Chart mit einer einzigartigen Parallelogrammform, die es Ihnen erleichtert, die besten Einstiegs- und Ausstiegspunkte für den Handel zu finden. Ob Sie Anfänger oder erfahrener Trader sind, dieses Tool kann Ihnen helfen, Ihre Handelsentscheidungen zu verbessern. Hauptmerkmale: Präzise Erkennung von Umkehrungen: Identifiziert Schlüsselzonen,
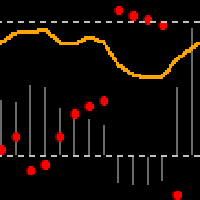
Der Stochastik-Indikator selbst erzeugt falsche Signale. Eine Möglichkeit, um festzustellen, dass der Preis in eine Richtung tendiert, ist die Verwendung des parabolischen SAR-Indikators. In der Regel wird er auf dem Chart eingezeichnet.
Die Projektion des SAR in den Stochastik-Indikator ist nicht kompliziert (pSAR-min)/(max-min). Auf diese Weise können Sie die Kursbewegung von zwei Ansichten aus an einem Ort verfolgen.
Es hängt sehr stark von den Parametereinstellungen ab.
Wenn sich der Kurs in
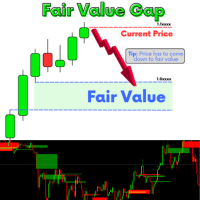
Ein Fair Value Gap (FVG) ist eine vorübergehende Kurslücke, die auftritt, wenn der Kurs einer Aktie oder eines Wertpapiers nicht mit seinem fairen Wert übereinstimmt. Diese Lücke wird häufig durch ein Ungleichgewicht zwischen Käufern und Verkäufern verursacht. Wie es funktioniert Preisungleichgewicht Wenn ein Ungleichgewicht zwischen Käufern und Verkäufern besteht, kann sich der Kurs eines Wertpapiers zu schnell bewegen. Kurslücke Dadurch entsteht ein unangepasster Bereich auf dem Kursdiagramm,
Der MetaTrader Market ist eine einzigartige Plattform für den Verkauf von Robotern und technischen Indikatoren.
Das Merkblatt für Nutzer der MQL5.community informiert Sie über weitere Möglichkeiten: nur bei uns können Trader Handelssignale kopieren, Programme bei Freiberuflern bestellen, Zahlungen über das Handelssystem automatisch tätigen sowie das MQL5 Cloud Network nutzen.
Sie verpassen Handelsmöglichkeiten:
- Freie Handelsapplikationen
- Über 8.000 Signale zum Kopieren
- Wirtschaftsnachrichten für die Lage an den Finanzmärkte
Registrierung
Einloggen
Wenn Sie kein Benutzerkonto haben, registrieren Sie sich
Erlauben Sie die Verwendung von Cookies, um sich auf der Website MQL5.com anzumelden.
Bitte aktivieren Sie die notwendige Einstellung in Ihrem Browser, da Sie sich sonst nicht einloggen können.