Neue Handelsroboter und Indikatoren für den MetaTrader 4 - 190

As the name implies, TIL Daily OHLC is a simple, straightforward yet effective tool to keep track of yesterday’s last Open, High, Low and Close prices. Any experienced trader knows the importance of these price levels – they are often used to navigate and predict the current day’s trend and price action as strong support and resistance. When applied to a chart, the indicator shows 4 plots that projects the 4 price levels from the previous day to the next one. Each price level is color coded and
FREE

This tools is design to easily forecast the projection of the current trend through the inputs of Zigzag and get out of the market when the trend do not the ability to maintain it's volatility to go further... the indicator gets the initial and final price from the value of zigzag automatically by adjusting the intdepth of zigzag. You can also switch from Projection to Extension from the inputs tab of indicator.
FREE

GOOD LUCK Please contact me The indicator allows you to trade binary options. The recommended time frame is М1 and the expiration time is 2, 3, 5 minutes. The indicator suitable for Auto and Manual trading. A possible signal is specified as a arrows above/under a candle. You should wait until the candle closes! Arrows are not re-painted Trade sessions: Any Currency pairs: Any Working time frame: M1,M5 Expiration time: 1,2,3,4, 5, 10, 15 minute With auto trading with Bot, buffer

SYMBOL POWER based on inputted 5 time frames and Compared to 20 Other Symbols !! Great Indicator YOU DON'T HAVE TO SHIFT ON ALL TIME FRAMES FOR EACH CURRENCY PAIR TO CONCLUDE ITS TREND AND ITS POWER YOU HAVE IT ALL IN ONE TABLE , 20 CURRENCY PAIR WITH 5 TIME FRAMES ALSO , COMPARE BETWEEN CURRENCIES STRENGTH AND ALERTS THE STRONGER /WEAKER PAIR BASED ON 5 TIMEFRAMES CALCULATIONS ALEERTS enable /disable using 5 time frames M5 M30 H1 H4 and D1 ( latest version You SELECT you own 5 timeframes from
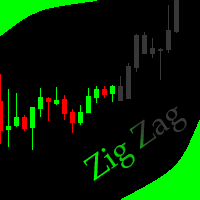
This indicator allows to hide ZigZag indicator (on all MT4 timeframes) from a date define by the user with the panel ("Hidden Candles"). This indicator can be use with other "Hidden Indicators". Indicator Inputs: Depth Deviation Backstep Information on "ZigZag" indicator is available here: https://www.mql5.com/en/articles/1537 ************************************************************* Hey traders!! Give me your feeds! We are a community here and we have the same objective.... make some mo
FREE

The chart bucket indicator primarily creates custom candlesticks which comes with adjustable colors, color themes and sizes and even comes with a demo. Also included are trade details relevant to trading and binary options.
If your a binary options trader this may be useful for timing of bars with actual price that you can compare with your binary options broker.
Key Features Custom Candlestick Themes, Custom Colors & Sizes. Ask/Bid Point Difference.
Open/Close Point Difference of current
FREE
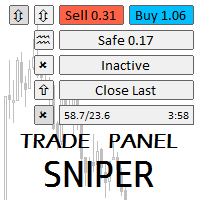
Простая в управлении Торговая панель обеспечит безопасную торговлю. Вычислит объём сделки от заданного уровня Stop Loss и величины убытка. Поможет рассчитать сейф, и в ноль закрыть неверную сделку. Интуитивно понятный интерфейс делает панель удобной в управлении, освобождая внимание трейдера для принятия решения о входе в сделку. Программа сделает все расчёты за вас. Поэтому работа с помощью панели Снайпер - оптимальное решение для торговли с соблюдением Мани-менеджмента. А это главный ключ к по

Moment - авторский индикатор, имеющий простые настройки, и несколько типов сигналов. Каждый пользователь сможет настроить его показания под свой стиль торговли, и валютную пару. Индикатор не меняет свои показания.
Со всеми моими продуктами можно ознакомиться по ссылке https://www.mql5.com/ru/users/slavakucher/seller
Параметры индикатора Основные настройки ( Main Settings ): HistoryBars - количество баров для отображения. CalculationPeriod - период для расчетов. IndicatorDelta - дельта. In

Zone Recovery Hedging Strategy What to do when the market goes against you? No matter how good you are at taking the entry points, no matter how good you are at predicting the market, it is a matter of time before the market goes against your trade. What do you do when the market goes against you? Do you just take the loss and try to recover the loss later from other trades? Or, do you just sit there and watch in dismay as this one bad trade eats up your hard earned profit and the money you inv

Trading Binary ? No problem, Scorpion Binary custom indicator helps you spot the entry points to the binary options (call / put).
Indicator Inputs : - Signal arrow distance from the candle (in pips) - Signal arrow size (from 1 to 5) - call / put put signal color - Window pop up alert - Email alert - Push notifications
Recommended Settings : - Timeframe : M1, M5, and M15 - Expiry time : 3 candles (3 minutes for M1, 15 minutes for M5, 45 minutes for M15)
For any suggestion, issues, or questi
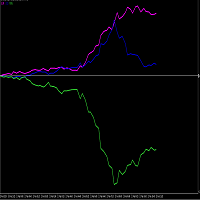
PLEASE NOTE THAT LIKE MANY SUCH INDICATORS ON THIS MARKET, THIS INDICATOR WILL NOT WORK AS A DEMO DOWNLOAD FOR STRATEGY TESTER. Therefore the 1 month option at the lowest cost allowed of $10 is available for you to test. One of the better ways to trade is to analyze individual currencies rather than currency pairs. This is impossible with standard chart indicators on MT4. This currency strength meter allows one to trade the USDMXN or EURMXN. Each currency (not pair) is measured constantly ag

This Indicator is made on the behalf of traders to trade inside the Gann angles. The indicator has the inside function of auto adjusting the chart window zooming in/out when the terminal is connected to the internet and new Tick come to draw the angles on the proper way of price and time. The angle would be not drawn until the suitable zooming is not achieved upon tick by tick.
The starting value of angle drawn is calculated the Zigzag indicator. The zigzag can be adjusted through the back-can

Virtual Bot Pro will open virtual trades, using them to monitor the market to determine the entry point(according to the inputs parameters), at which point Virtual Bot Pro will start opening real trades. It is recommended to test this Expert on demo account or cent account.
Input Parameters TF - the choice of time frame Start - choose whether you want to trade long or short positions only or both.
Trend Disabled Enabled TF Trend - the choice of Time Frame for trend.
Spread - for 5 d

Many traders, especially the beginners, get tired of manual trading and start using robots. Of course, advertising plays a significant role in choosing the algorithm. Often, system and EA vendors hide information about their product until the customer buys it. Profit Hunter EA is no exception, so in our review we will try to find out whether this robot is efficient or you should better search for its counterparts.
Profit Hunter EA
A variation of the "martingale" technique used in the EA is

In the financial world, risk management is the process of identification, analysis and acceptance of uncertainty in investment decisions. Essentially, risk management occurs when an investor or fund manager analyzes and attempts to quantify the potential for losses in an investment, such as a moral hazard, and then takes the appropriate action given his investment objectives and risk tolerance. This tool should be the success key before you lost your capitals due to the unawareness of market beh

This EA Automatically sets stop loss and take profit levels on limit orders. It is fully adjustable : you can set the amount of pips for your SL or TP level Helps limit your risk Automatically Just drag and drop onto your MT4 chart and it start working for you You can save different pip levels to drag onto the chart You only have to drag it onto the chart once and it will automatically set your SL and TP level Every time you enter a Pending Order

ECN Scalping is a trading adviser using an algorithm based on the ability to adapt to the current market situation. All orders are opened with a strictly fixed Stop Loss. How it works?
Buy our advisor. Download to your terminal. Set on the chart of any currency pair (for example EURUSD). Turn on the Autotrade button and "Allow live trading". Do not change the settings, Advisor is automatic! Please notice that the performance of the EA depends heavily on your choice of Broker and VPS. Key Opti

Trade Copier ist ein professionelles Dienstprogramm zum Kopieren und Synchronisieren von Trades zwischen Handelskonten. Das Kopieren erfolgt vom Konto / Terminal des Lieferanten auf das Konto / Terminal des Empfängers, das auf demselben Computer oder vps installiert ist. Vor dem Kauf können Sie die Demoversion auf einem Demokonto testen. Demoversion hier . Vollständige Anweisungen hier . Hauptfunktionalität und Vorteile: Unterstützt das Kopieren von MT4> MT4, MT4> MT5, MT5> MT4, einschließlich M

Unsere Unterstützungs- oder Widerstandsniveaus werden gebildet, wenn sich die Preisbewegung eines Marktes umkehrt und die Richtung ändert und einen Höchst- oder Tiefpunkt (Swing Point) im Markt hinterlässt. Unterstützungs- und Widerstandsniveaus können Handelsspannen ausmachen. Der Indikator identifiziert das Swing High und Swing Low basierend auf der Anzahl von X Balken (Periode), die im Indikatorsatz definiert sind.
Hinweis: Wenn Ihnen unser Preisaktionsindikator gefällt, probieren Sie unse
FREE

Ein benutzerdefinierter MT5-Indikator (Metatrader 5), der den Trend- und Volatilitätsanalysator-Indikator analysiert. Darüber hinaus identifiziert es den Anfang und das Ende des Trends, der für die meisten Währungspaare und Zeitrahmen funktioniert.
Zusammenfassend haben wir es basierend auf der Super Trend Formula codiert, um durch Hinzufügen eines Volatilitätsanalysators genauer zu sein.
Suchen Sie nach einem guten und zuverlässigen Unterstützungs- und Widerstandsindikator, probieren Sie u
FREE

Lucky Price Action Lucky Price Action – fully automated Expert Advisor that trades volatility breakouts ( Price Action ). Lucky Price Action (LPA) Expert Advisor has a number of filters that significantly decrease the market entries at false breakouts. Lucky Price Action supports the following currency pairs: EURUSD, EURAUD, GBPUSD; YOU NEED TO PLACE LPA EA only on 1 chart (EURUSD M5 timeframe). Lucky Price Action has high expectance (in pips, as per the backtests) and therefore is not ve

BOOSTER FOR MT4 ist ein professioneller Scalper-Berater für die tägliche Arbeit im FOREX-Markt. Im Handel, zusammen mit der Erfahrung, verstehen Trader normalerweise, dass das Ausmaß der Ansammlung von Stop-Orders, der Preis und die Zeit eine bedeutende Rolle auf dem Markt spielen. Diese Strategie wird in diesem FOREX Expert Advisor umgesetzt, und ich hoffe, dass Sie nicht nur Freude an diesem Produkt haben, sondern auch an seiner Entwicklung teilhaben - hinterlassen Sie hier Ihr Feedback mit I

EA Boat GoodLine
Boat GoodLine Advisor arbeitet, indem er zwei Stochastik mit auswählbaren und anpassbaren Parametern mit der Begrenzung von Geräuschen und geringfügigen "falschen" Bewegungen mit der Lim -Parameter. Expert Advisor ist leicht für die Auswahl aller Einstellungen optimiert.
Der Roboter berechnet den Trend und macht Geschäfte in seine Richtung. Der Berater hat zwei Modi zum beenden von Transaktionen.
Der normale Modus ( Net = false ) beendet den deal Advisor von TakeProfit o

I slippage=0; - zulässiger Schlupf, 0-nicht verwendet S cmt=""; - Kommentar zu Orders I Magic=20200131; - medzhik, die id der Orders des Beraters S WorkTime="00:00-24:00"; - Format wie HH: MM-HH: MM, ganzer Tag 0-24 oder 00: 00-24: 00 D fix_lot=0.01; //fix lot - Arbeits viel D order_tp=100.0; / / TP. Ich empfehle-10.0-take Profit in Punkten wie für 4 Zeichen! im Expert Advisor werden die 5-Zeichen-Tools automatisch erkannt und der Wert wird automatisch um das 10-fache erhöht. D orde

Ship Cruise
Der Ship Cruise Advisor handelt nach den Signalen des RSI -Indikators. Trades werden in die eine oder andere Richtung gemacht, wenn der Indikator Werte von 30 oder 70 erreicht.
Profitable Transaktionen werden auf take-Profit geschlossen. Unrentable Ratgeber behandelt nach der Methode der Mittelwertbildung, baut ein Netz von Transaktionen in die gleiche Richtung, berechnet bezubytka und wenn der Preis dieser Ebene das Netzwerk schließt auf take-Profit .
Der Berater hat ein

EURGBP; EURUSD; GBPJPY; GBPUSD; XAUUSD; GBPCAD usw.
Hinweis: Bevor Sie diesen Scalper-ProfiTrader Roboter verwenden, müssen Sie wissen, dass er optimiert ist und mit ein paar Parametern standardmäßig, verwenden Sie es in Trendcharts, suchen Sie nach starken Trends und setzen Sie es, Sie müssen auch wissen, dass es sehr gut auf hohe Volatilität Charts geht, seine mehr Erfolg basiert auf Volumen auch, das trägt eine Volumen-Strategie mit Abdeckung von 80% und eine kleine 20% Martingale nur für d

Lizard Scalper Pro is a trading robot for the trading on forex. This is a Counter Trend system that trades mainly during Asian and NY sessions. Expert advisor not use grid, martingale , arbitrage o high frequency trading . Fix and Visible Stop loss and Take Profit
Important Information Revealed By purchasing this Expert Advisor you are entitled to receive a free copy of Eagle Scalper Pro ! (All future updates included) -> To Receive it, Please Contact me by mql5 or email !
The

Der Berater " Treasure "handelt nach den Signalen des Indikators"CandlestickPatternsRecognition". Die Grundlage sind kerzenformationen der Umkehr. Das Handelsvolumen, das verwendet wird, um eine Position zu öffnen, hängt von den Ergebnissen früherer trades ab. Es ist möglich, die Funktion des autolot Oder den Handel mit festen lot zu aktivieren, es gibt auch eine Funktion von Schleppnetz und Break-even. Es ist möglich, die maximale Größe des Risikos (in % der Anzahlung) zu begrenzen. Der Handel

The EA automatically opens orders both when the price moves in the direction of an open position, and against it, depending on the settings. He will always open the necessary additional orders in time for you if you suddenly find yourself not at the terminal. And it will also automatically close them when the specified profit margin is reached. Functions: manual opening of any types of orders; automatic opening of market orders in accordance with the settings; the ability to set a lot multipli
FREE

The informer provides information on the current state of open market positions. The visual presentation consists of two parts. The left side contains the latest transactions executed on the account. Transactions are sorted by time. The right part shows the current state of the aggregate positions of the instruments. Sorting of positions is carried out in descending order of the margin load on the account. Updating and recalculating the status of positions is performed automatically and/or by

The EA automatically opens orders both when the price moves in the direction of an open position, and against it, depending on the settings. He will always open the necessary additional orders in time for you if you suddenly find yourself not at the terminal. And it will also automatically close them when the specified profit margin is reached. Functions: manual opening of any types of orders; automatic opening of market orders in accordance with the settings; the ability to set a lot multipli
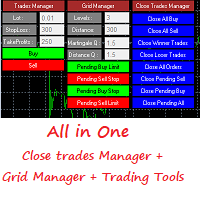
This is a demo version . Download the full version from this link https://www.mql5.com/fr/market/product/84850
Full version Allows you to : Set the number of levels (trades). Lot size and you can do Martingale to raise the lot size for each level. Set distance between levels, and you can manage the distance for each level using Distance Q. Static TP and SL for each level. You can open : BUY STOP / BUY LIMIT / SELL STOP / SELL LIMIT (levels in one click). Close all buy orders. Close all
FREE

PREDATOR MT4 is a # FOREX advisor with an advanced adaptive strategy. It is assumed that if the price has been fluctuating in a narrow range for a long time, then orders of large players are collected there, and the price will bounce several times in the opposite direction from this level. Suitable for both experienced traders and beginners. The # ADVISER should be used on highly liquid currency pairs with a small spread and commission. MT5 version: https://www.mql5.com/en/market/produ

V O L A T I L I T Y W A T C H E R A highly powerful Market Volatility Detector. It gives current situation of market technical sentiment.
V E R Y I M P O R T A N T Once the tool detects and alerts you, you have to act on it right away for more precision of entries. Once the recommended pair to trade is gone, wait for the next recommendation. If your MT4 is newly installed, there's no sufficient data yet for all 28 pairs that the tool monitors. You hav

Multi-currency expert. Mission Impossible is a fully automated trading system on all major currency pairs. Very focused on small gains with minimizing the risk of loss (see Entering/ Ellipse/Ellipse Size). Advantage thanks to technique. Not for complete amateurs taking too much risk !!! Forex is a risky business on itself - remember.
Systems
- Partial closing. - Run. - Open bar/ Every Tick.
Recommended:
- VPS or Remote Desktop (e.g Chrome Remote Desktop)
Input Parameters
Start Dep

Your own copy system MT4 signal provider via Telegram Telegram isn't just for sending and receiving chat messages. It's also for automating your work flow. The combined use of MetaGram and Telegram bots allows you to send, receive and manage messages and even get your own copying system. Sharing trades with your subscribers is now such a simple process with this easy-to-use MetaGram app for MT4. Once you have connected MetaGram to your trading account and Telegram, your trades are sent immediat
FREE

The EA’s unique algorithm calculates the average price (reflected in the form of a trend line on the chart), which is the center of price attraction in the framework of the traded timeframe.
At times of increasing volatility, the adviser begins work with the goal of fixing profit in the region of the center of attraction of the price.
Advisor does not use dangerous trading methods.
It is recommended to install a trading expert on a remote server (VPS). Recommended Trading Instruments (TF

Hallo, ihr könnt von M5 bis Woche die Zeit einstellen. Gute Testergebnisse sind M15 bis H1 Alle Settings gibt es zu jedem Paar auf anfrage. Ich habe noch nicht alle zusammen und werde diese dann auch hier hochladen. Support gibt es auch im Kanal unter https://t.me/forexWDScalper Fragen beantworte ich gerne hier oder unter torsten748@outlook.de Diesen EA gibt es auch für MT5, bitte schreibt mir. AUDCAD AUDCHF AUDNZD AUDJPY AUDUSD CADJPY CHFJPY EURCAD EURJPY EURNZD EURUSD NZDCAD NZDUSD NZDJ

Universal scalper with averaged algorithm to exit the drawdown. The Protected Article advisor uses an author's scalping strategy. More than a year of work on a demo and on real accounts. The adviser will be a good assistant when scalping, trading on the news, as well as when opening many transactions on different currency pairs. It must be run on the chart of each pair that you want to trade. The parameters of the adviser are clear and easy to configure.
Advisor Goal Scalping results in small

This is a trend indicator with some filters. If you use this tool as it is written in the recommendation. Trading recommendations 1 It is worth opening a deal while receiving a signal (The blue dot indicates that it is possible to open an order for Buy. The red dot indicates that it is possible to open an order for Sell) 2 Set Take Profit at 40 pips or 4 points 3 Stoploss is not installed in its place, we exit on the opposite signal if the transaction was unprofitable
It is important to need a

Данная панель упростит работу тем, кто использует в своей торговле горизонтальные уровни. Панель дает возможность быстро переключатся по инструментам, при этом в несколько кликов устанавливать уровни на графиках и взаимодействовать с ними. Имеется гибкая настройка оповещения. Одно из преимуществ данного продукта, показывать вид пробития уровня, это ложный пробой или закрепление за уровнем.
Настройки
Market_Watch - При (true) выводит инструменты из списка панели "Обзор рынка", при (false) инстр

Expert for a binary options on mt4, he have two built-in a indicators and many different settings. The expert has one a level of martingale, but it is recommended to use it on the instruments with a yield of 85 percent. it can be used simultaneously on a variety of currency instruments. All settings have already been made, but you can also configure them yourself . Currency for do trading is a Russian ruble. Good trading to everyone.

Diamond EA ver 3.0 Hi All Trader on MQL Market This EA using only TimeFrame M30 ,the Indicator Ichimoku Kinko Hyo and compact some anorther indicator , example : MA and SAR to confirm point of the Order. In the setup and starting the EA, The settings should be left as default as the image describes Recommed Initial Deposit : 50 USD with starting 0.01 lots. 500 USD with starting 0.1 lots and " Enable Autolots " can make up to more than 4000 USD profit in 3 years. Pairs : EUR/USD , USD/JP

PROFIT TAKEN Полностью автоматический советник при необходимости применяется усреднение. Советник может торговать на любых парах. Усовершенствована стратегия Мартингейла - появилась возможность выбора коэффициента что увеличивает шансы приумножить депозит и выйти быстрее из просадки, а так же выбор торговли не по фиксированному лоту а по проценту от депозита . Робот ориентирован на круглосуточную торговлю. Советник открывает ордера на определенных уровнях при определенной комбинации баров
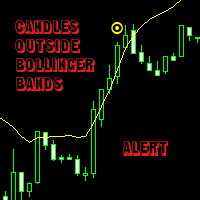
This indicator allows you not loosing any important moment of the market, at the same time that you dont need to be in front of the chart watching that moment to come.
You just set the patterns up, and then the indicator will bring the signal and alert to call your attention.
Its possible to be alerted when volativity comes without watching the charts like a crazy.
You can set it up and follow the trend, when trend gets power. (Eg. A big period and a small deviation number could call atte
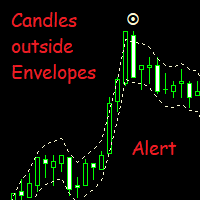
This indicator allows you not loosing any important moment of the market, at the same time that you dont need to be in front of the chart watching that moment to come.
You just set the patterns up, and then the indicator will bring the signal and alert to call your attention.
Its possible to be alerted when volativity comes without watching the charts like a crazy.
You can set it up and follow the trend, when trend gets power. (Eg. A big period and a small deviation number could call att
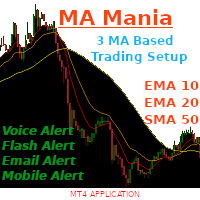
The Indicator includes three of the most prominent moving averages indicators. These are : Ten Period Exponential Moving Average Twenty Period Exponential Moving Average Fifty Period Simple Moving Average This is one of my favourite trend follow setup that is solely based on these three moving averages. The indicator has the following abilities: It can notify you through voice alerts when price touches any of the moving averages . For example if price touches Fifty Period Simple Moving Average t
FREE

Stochastic Plus is a visual indicator designed for both beginners and professionals. Developed using Stochastic and Laguerre and the principle of three screen. Stochastic Plus helps: correctly evaluate the current market movement; find optimal entry points; do not rush to close profitable orders and increase profit Stochastic Plus works very well with AmericanDream indicator (see screenshot). May be used with any currency and timeframe.
FREE

This Demo Version will only work with CHFJPY
For the full version go here:
https://www.mql5.com/en/market/product/46358
Trade Manager
This assistant automates various aspects of order handling in MT4. The assistant allows you to plan a trading strategy defining Entry Levels, Stop Loss, Take Profit, execution of orders on one level, partial closes, Break Even, etc. Basic characteristics Trades calculation 3 basic lines are drawn that define the entry level, SL and TP. You can move thi
FREE

What is it
PricerEA is a utility to help any trader to place pending orders (stop or limit) at a specific price. It is designed for easy use. There is a parameter to set the prices you want to place orders. The expert can calculate automatically the lot size for each order. In addition, there is the possibility run trailing stop (work only for market orders) if triggered a pending order.
How use it
Use BuyStop to open buy order over than current price. Use BuyLimit to open buy order under th
FREE

This indicator allows to hide Bill Williams Alligator (on all MT4 timeframes) from a date define by the user with a vertical line (Alone) or a panel (with "Hidden Candles"). Indicator Inputs: Jaws Period Jaws Shift Teeth Period Teeth Shift Lips Period Lips Shift Method Apply To Information on "Alligator" indicator is available here: https://www.metatrader4.com/en/trading-platform/help/analytics/tech_indicators/alligator ************************************************************* Hey traders!
FREE

Strength and weakness of currencies : Shows the currency status at any time, values between 50 and -50 are neutral, everything outside indicates a trend change Waves : Current state of waves, daily, weekly monthly and yearly Recommended volume for trading a specific number of waves Yearly High Low Drawn waves on which the market will react in advance, without redrawing Yearly candle with bonus levels used to display deviations For more info contact me

Открытие сделок с нужными вам параметрами занимает считанные секунды. Простая и удобная утилита для создания новых ордеров . С легкостью создавайте рыночные и отложенные ордера с автоматическими уровнями стоплосс, тейкпрофит. Автоматический расчет размера лота с заданным риском на сделку. Просто переместите уровнь стоплосс и тейкпрофит на графике на нужные ценовые уровни. Внимание! Если вы хотите протестировать все функции данной утилиты пожалуйста свяжитесь со мной и получите этого советника

Inspired from, Time is the most important factor in determining market movements and by studying past price records you will be able to prove to yourself history does repeat and by knowing the past you can tell the future. There is a definite relation between price and time. -William Delbert Gann Caution: It's not HolyGrail System,I t's a tool to give you insight of current market structure. The decision to trade is made only with combination of economical understanding of underlying instru

You can try this EA in the strategy tester,
or you can try this demo version:
https://www.mql5.com/en/market/product/46367
Trade Manager This assistant automates various aspects of order handling in MT4. The assistant allows you to plan a trading strategy defining Entry Levels, Stop Loss, Take Profit, execution of orders on one level, partial closes, Break Even, etc. Basic characteristics Trades calculation 3 basic lines are drawn that define the entry level, SL and TP. You can move this l

The expert who works with many strategies in one expert among them and works with times of news and also works without news with the Zone Recovery strategy and works also with wasting a single contract and also works without complications according to the user setting and earns profits with a percentage of the value of the account and carries with the property of the mobile contract Where if the size of the account is increasing, it increases the size of the contract with the size of the account
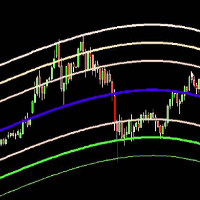
Belkhayate Gravity Center MT4 The Belkhayate center of gravity indicator is best used to confirm major turning points, and distinguish price extremes. Generally if price reaches the upper or lower levels one should expect a turn around coming soon, or at least a pull back towards the centre line if there is a strong trend. The upper and lower levels are red and green lines.
Our indicator use the same parameters as the well known trader M.Mostafa Belkhayate the inventor of the indicator, allow t
Levels_KEY_Integra - это алгоритм глубокого сканирования рынка и вычленения Ключевых ценовых уровней.
Параметры HISTORY_D1 - Глубина сканирования на Дневном графике. Levels_D1 - Цвет уровней D1. Levels_W1 - Цвет уровней W1. Leave_Mark - "Оставить след". Возможность сохранения рисунка после удаления индикатора. Важные замечания: Проверять индикатор-сканер в тестере не имеет смысла. Рез

在购买EA时,请注意以下风险: 1)过去的表现并不能保证未来的盈利能力(EA也可能造成亏损)。 2)对于高点差和高滑点平台,大批量交易可能会很糟糕。 OWL Scalper能够为刚开始交易的人们以及希望分散投资风险的更高级的交易者提供一种现成的交易解决方案。该EA在一天中安静的时间段执行交易操作。交易是根据特殊算法开仓和平仓的。该EA不需要太多时间来了解设置,因为EA提供了最少的输入,这些输入适用于大部分货币对。 推荐:USDCHF、EURAUD、GBPUSD、AUDCHF、AUDNZD、EURCHF、NZDCHF、GBPJPY 时间范围:M5
参量 MAGIC :唯一的EA魔术号 StopLoss :最大允许损失值 TakeProfit :最大利润值 CompoundMode: 是否使用复利模式 Risk: 每次使用多少资金进行交易(0.1==10%),并自动计算手术(如果 CompoundMode =true) Lot: 固定手数(如果 CompoundMode =false) BarOutSL: 在上一个订单s/l关闭后,在几根K线内暂停同方向交易 StartTime: 交

Предлагаю ознакомиться с первым моим советником.
Много писать не буду. Советник простой.
Скриншот тестирования есть под описанием.
Рекомендации:
Работает на паре EURUSD
Таймфрейм - М1.
Торговый терминал - MetaTrader4.
Минимальный рекомендованный депозит - $10000 для лота 0.01.
Минимальное рекомендованное кредитное плечо торгового счёта - 1:500.
Параметры - по умолчанию.
Но при желании можно экспериментировать на демо-счёте.
The strategy is simple but effective. With adequate money management, the probability of stable earnings is very high. Works on short-term trend changes. Trading is carried out at the borders by opening positions with a fixed lot size. The EA is designed to trade on any currency pair, on the H1 timeframe. Not martingale, not arbitrage. Recommended settings are the default. Recommended broker - any. The recommended minimum deposit is $ 300 for a cent account (30,000 cents) and 0.1 lot. Leverage

Автоматический торговый советник - скальпер, использующий для торговли период низкой волатильности рынка. Советник использует продвинутый алгоритм для поиска точек входа, а так же несколько дополнительных фильтров на вход и выход из сделки. Советник не нуждается в оптимизации или какой-либо дополнительной настройке. Мониторинг работы советника: https://www.mql5.com/ru/signals/author/whitelake
Особенности Не использует мартингейл, усреднение, пересиживание убыточных сделок. На всех ордерах ис

This is a Currency Strength Meter Indicator. Build in different calculation methode that show very smooth index. It prevent for minor trend strengtness in case for decreasing fake signal. I'll explain about the parameters below : suffix : Additional quote after name of currency,should be added. (i.e. EURUSD.c, suffix is .c ) TF1 : First Coloum Type of Timeframe. TF2 : Second Coloum Type of Timeframe. TF3 : Thirth Coloum Type of Timefra

Trendindikator, bahnbrechende, einzigartige Lösung für Trendhandel und -filterung mit allen wichtigen Trendfunktionen in einem Tool! Es handelt sich um einen 100 % nicht neu zu malenden Multi-Timeframe- und Multi-Währungs-Indikator, der für alle Symbole/Instrumente verwendet werden kann: Forex, Rohstoffe, Kryptowährungen, Indizes und Aktien. Trend Screener ist ein effizienter Trendfolgeindikator, der Pfeiltrendsignale mit Punkten im Diagramm liefert. Die Funktionen, die im Trendanalysator-Indika

Support And Resistance Screener ist ein Level-Indikator für MetaTrader, der mehrere Tools innerhalb eines Indikators bietet. Die verfügbaren Werkzeuge sind: 1. Marktstruktur-Screener. 2. Bullische Pullback-Zone. 3. Bärische Pullback-Zone. 4. Tägliche Pivot-Punkte 5. wöchentliche Pivots-Punkte 6. monatliche Pivots-Punkte 7. Starke Unterstützung und Widerstand basierend auf harmonischem Muster und Volumen. 8. Zonen auf Bankebene. ZEITLICH BEGRENZTES ANGEBOT: HV Support and Resistance Indicator ist

Currency Strength Meter, gibt Ihnen einen schnellen visuellen Überblick darüber, welche Währungen derzeit stark und welche schwach sind. Das Messgerät misst die Stärke aller Forex-Kreuzpaare und wendet Berechnungen an, um die Gesamtstärke für jede einzelne Währung zu bestimmen. Wir berechnen die Stärke der Währung basierend auf dem Trend von 28 Paaren.
Wenn Sie auf unseren MQL5-Blog zugreifen, können Sie die kostenlose Version des Indikators herunterladen. Probieren Sie es aus, bevor Sie
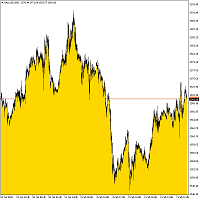
Bottom Background 4 Der Indikator setzt je nach Einstellung den unteren Hintergrund einer bestimmten Farbe auf den aktuellen Preis. Beschreibung der Anzeigeeinstellungen: MODE - drei Anzeigeoptionen für den Indikator: Low - Anzeige des Mindestpreises, Open / Close - Anzeige des Eröffnungs- oder Schlusskurses, je nachdem, welcher Wert niedriger ist, MA - Anzeige des gleitenden Durchschnitts. PeriodMA - Periode des gleitenden Durchschnitts.
FREE
Das Handelspanel GRID für MT4 ist mit den Funktionen zum Öffnen, Schließen und Verfolgen von Orders ausgestattet. Orders werden durch einen Korb geschlossen, entweder unidirektional - nur KAUF oder VERKAUF oder bidirektional KAUF und VERKAUF zusammen. Um Positionen zu schließen, können die Funktionen Stop Loss, Take Profit, Breakeven und Trailing Stop verwendet werden. Stop Loss und Take Profit können in % des Saldos eingestellt werden. Es hat die Funktionen der minimalen Positionshaltezeit und
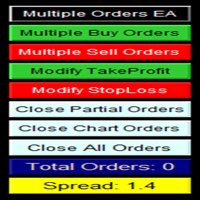
MULTIPLE ORDERS UTILITY
Multiple Orders Utility is created to give easy profits-making trades with a little movements and without going long distance to get it all. This Utility opens multiple orders as many trades as the number specified by the User or as many as permitted by your Broker in the same direction on the same currency pair simultaneously.
The idea behind it, is that instead of running after 100 - 200 pips which may not likely be attainable in the record time or may NOT even b
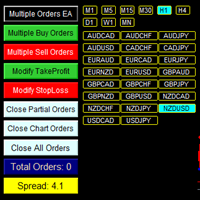
MULTIPLE ORDERS With Symbol and Time Frame Changer
Multiple Orders Utility is created to give easy profits-making trades with a little movements and without going long distance to get it all. This Utility opens multiple orders as many trades as the number specified by the User or as many as permitted by your Broker in the same direction on the same currency pair simultaneously.
The idea behind it, is that instead of running after 100 - 200 pips which may not likely be attainable in the re
MetaTrader Market - Handelsroboter und technische Indikatoren stehen Ihnen direkt im Kundenterminal zur Verfügung.
Das MQL5.community Zahlungssystem wurde für die Services der MetaTrader Plattform entwickelt und steht allen registrierten Nutzern der MQL5.com Webseite zur Verfügung. Man kann Geldmittel durch WebMoney, PayPal und Bankkarten einzahlen und sich auszahlen lassen.
Sie verpassen Handelsmöglichkeiten:
- Freie Handelsapplikationen
- Über 8.000 Signale zum Kopieren
- Wirtschaftsnachrichten für die Lage an den Finanzmärkte
Registrierung
Einloggen
Wenn Sie kein Benutzerkonto haben, registrieren Sie sich
Erlauben Sie die Verwendung von Cookies, um sich auf der Website MQL5.com anzumelden.
Bitte aktivieren Sie die notwendige Einstellung in Ihrem Browser, da Sie sich sonst nicht einloggen können.