Neue technische Indikatoren für den MetaTrader 4 - 114

Dieser Indikator ist ein reaktives oder verzögertes Signal, weil die Strategie eine Formation von einer ungeraden Anzahl von Bars verwendet, wobei die mittlere Bar die höchste oder niedrigste in der Formation, und der Indikator zieht, wenn die alle Bars in der fraktalen schließen. Für Händler mit einer bereits bestehenden Tendenz zur Richtungsbestimmung ist dieser Indikator jedoch äußerst nützlich, da er frühe Einstiegspunkte aufzeigt.
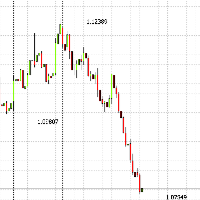
Zickzack mit der Signatur der letzten drei Extreme, 1., 2. und 3., der Zickzack-Indikator selbst sollte bei Bedarf zusätzlich zum Chart hinzugefügt werden, da Sie darauf verzichten können. Es funktioniert auf allen Instrumenten und Zeitrahmen. Besonders bei großen TFs ist es nützlich, die letzten 3 Kurse sofort zu sehen und das Diagramm nicht mit unnötigen Indikatoren und Linien zu überladen. Sie können - Farbe, Schriftgröße und Position relativ zum Anhang des Preises des Diagramms ändern Dam

Dieser Indikator zeigt die letzten 4 Zickzack-Extrema an und bezeichnet sie als 0, A, B, C mit der Preisunterschrift. Es funktioniert auf jedem Handelsinstrument. Sie können die Größe, Farbe des Texts und die Position des Texts im Verhältnis zu den Höchstpreisen ändern. Sie können auch die Zick-Zack-Einstellungen selbst ändern. ZIgZag selbst zum Zeichnen von Linien muss zusätzlich mit dem Plan verbunden werden. Damit der letzte Wert immer das letzte Maximum / Minute des Zickzacks anzeigt, setzen

Dieser Indikator zeigt die Wellenstruktur des Marktes in Form von mehreren ineinander verschachtelten Wellenebenen an. Für jedes dieser Niveaus wird eine automatische vorläufige Markierung der Wellen im Elliott-Stil (123..., ABC... usw.) erstellt. Dieser Markup ist völlig automatisch und absolut eindeutig. Der Indikator ist besonders für Wellenanalytiker-Anfänger nützlich, da er es ermöglicht, unter allen möglichen Versionen der Wellenmarkierung sofort die geeignetste Version als Grundlage zu ne

Der Indikator Mono Waves wurde entwickelt, um das Wellenverhalten des Marktes auf einem Chart darzustellen. Dieser Indikator verwendet den PPPC-Indikator (Point-Percent Price Channel), der kostenlos vom Market heruntergeladen werden kann. Wenn sich der Markt nach oben bewegt, wird die obere Grenze des Preiskanals auf den Höchstkursen der Kerzen gebildet (weitere Einzelheiten finden Sie in der Beschreibung des PPPC-Indikators unter dem oben angegebenen Link). Je höher die High-Kurse steigen, dest
FREE
Einzigartiger Trendhandelsalgorithmus mit fortschrittlicher Filterung und vielen Funktionen, die Teil Ihres Handelsarsenals werden sollten. Dieser Indikator kann Ihnen auch Trading Advisors (mit Take-Profit-Ziel), Erfolgsraten-Scanner und vieles mehr bieten.
Wichtige Informationen
Für weitere detaillierte Informationen können Sie die 747Developments Website besuchen.
Merkmale Einfach zu benutzen (einfach per Drag & Drop auf den Chart ziehen) Kann mit jedem Handelsinstrument verwendet werden V

Der Ska ZigZag Line Indikator bestimmt die überkauften und überverkauften Regionen innerhalb eines Trends. Der Indikator bestimmt die überkaufte Region durch das Kerzenhoch und die überverkaufte Region durch das Kerzentief in Form einer Linie. Um die gesamte Strategie zu nutzen, empfehle ich die Verwendung von "Ska ZigZag Line" zusammen mit "Ska ZigZag BuySell". HINWEIS: Dieser Indikator ist ein linienbasierter Indikator. WIE BENUTZEN: Verkaufssignal; Platzieren Sie einen Verkaufshandel, wenn de
FREE

Der Indikator Point-Percent Price Channel (PPPC oder PP Price Channel) zeigt auf dem Chart einen Kanal an, dessen Breite sowohl als Prozentsatz des aktuellen Kurses als auch in Punkten angegeben wird. Sein Aussehen ist auf Folie 1 dargestellt. Wenn sich der Markt nach oben bewegt, wird die obere Grenze des Kanals beim Preis der High-Kerze gebildet. In diesem Fall folgt die untere Begrenzung der oberen in einem genau festgelegten Abstand. Wenn der Kurs die untere Grenze des Kanals berührt, geht d
FREE

BeST_Profit Taker Exits ist ein Metatrader-Indikator, der auf dem entsprechenden wichtigen Teil des Handelssystems von Jim Berg basiert, der die wahrscheinlichsten Punkte/Balken für signifikante Gewinnmitnahmen rechtzeitig lokalisiert und leicht als Zusatz zu jedem Handelssystem/jeder Methode verwendet werden kann. Der Indikator besteht aus 2 Gewinnmitnahmelinien , die sich aus (MA ± mal ATR) ableiten, wobei die obere in der Regel über den Kursen (für Long Trades) und die untere unter den Kurse

Berechneter Trendindikator, kann mit einem optimalen Risiko-Gewinn-Verhältnis verwendet werden, zeigt erfolgreiche Signale. Verwendet zwei Optionen für Einstellungen. Zeigt günstige Momente für den Einstieg in den Markt mit Pfeilen an. Die Wahrscheinlichkeit für einen erfolgreichen Trend ist nicht sehr schlecht! Der Indikator kann sowohl für Pipsing in kleinen Perioden als auch für den langfristigen Handel verwendet werden. Der Indikator wird nicht neu gezeichnet und hinkt nicht hinterher. Er fu
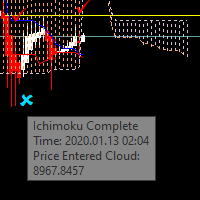
Haben Sie jemals versucht, mit dem Ichimoku-Indikator zu handeln, und sich dann gefragt, ob Sie dabei bleiben oder den Handel schließen sollen? Jetzt wissen Sie genau, was der Preis tut, und können Ihre Strategie wählen. Es gibt viele verschiedene Möglichkeiten, mit Ichimoku zu handeln, und ich bin sicher, dass Sie Ihre Strategien mit Ichimoku Complete viel einfacher umsetzen können.Ein Bonus ist, dass die Parameter für die Trainer, die Sie bitten, die Werte des Indikators zu ändern, vollständig

Der Ska ZigZag BuySell-Indikator bestimmt die überkauften und überverkauften Regionen innerhalb eines Trends. Der Indikator bestimmt den überkauften Bereich durch das Kerzenhoch und den überverkauften Bereich durch das Kerzentief. Dieser Indikator gibt nur Signale mit Pfeil und akustische Warnungen jedes Mal, wenn ein neuer Candlestick erscheint. Um die gesamte Strategie zu nutzen, empfehle ich die Verwendung von "Ska ZigZag BuySell" zusammen mit "Ska ZigZag Line". Der Ska ZigZag Line Indikator
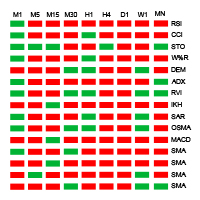
Indikator-Prinzip: Anzeige aller Zyklustrends von 15 Indikatoren in einem Chart Oszillationsindikator zeigt gleichzeitig den aktuellen Wert jedes Zyklus an (RSI, CCI, STOCHI, W% R, DEM, ADX, RVI, IKH, SAR, OSAM, MACD, gleitender Durchschnitt, gleitender Durchschnittsübergang) RSI (Index der relativen Stärke) Trendlevel über rot unter grün CCI (Rohstoff-Kanal-Index) Trendlevel über Rot unter Grün STOCH (Stochastischer Oszillator) Goldgabel rot Todesgabel grün W% R (WilliamsPercent Range) Trendle

Die folgende Abbildung zeigt das Funktionsprinzip des Indikators. Es handelt sich um eine Suche nach dem Price-Action-Muster.
Das Candlestick-Muster besteht aus zwei Indikatoren für die Dominanz der Bullen oder Bären. Tick-Volumen und volumetrisches Delta sind ebenfalls an der Konstruktion des Signals beteiligt.
Der Indikator sucht nach möglichen Umkehrungen auf dem Abschnitt, dessen Länge in den Parametern Berechnung Hoch/Tief festgelegt wird
Standardmäßig ist der Parameter auf 50 Balken ei

Der Indikator ist für diejenigen nützlich, die Fibonacci-Cluster beim Handel verwenden und Konstruktionen mit verschiedenen Niveausätzen anwenden. Jeder Satz von Niveaus ist sowohl auf Retracement- als auch auf Expansionsniveaus anwendbar (wählbar in den Einstellungen). Die Levels werden durch eine Aufzählung im Format "0;50;61.8;100" angegeben. Einstellungen des Indikators: Fibonacci #1 - Level Set #1 Fibonacci - Typ der Levels : Retracement oder Expansion Levels - Set von Levels im Format "0;2
FREE
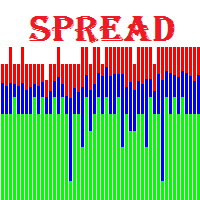
Spreads Monitoring MT4 ist ein leistungsfähiges Tool zum Sammeln von Spread-Werten und deren Aufzeichnung in einer Datei. Es ermöglicht Ihnen, minimale und maximale Spread-Werte zu "fangen" und berechnet den realen durchschnittlichen Spread-Wert des Brokers . Vorteile des Indikators: Funktioniert auf allen Zeitrahmen; Stellt die zuvor aufgezeichneten Daten wieder her, um sie auf dem Chart darzustellen; Er kann auf Charts anderer Symbole entsprechend der Vorlage des aktuellen Charts gestartet wer

GLATTER STÄRKE-INDIKATOR (GLATTE LINIE ) er zeichnet die TREND-Volatilitäts-/Stärke-Linien der Währungen: - Erkennt die 2 hoch TRENDED Volatilitätspaare (die fetten Linien) - Ein sehr hilfreicher Indikator - Er zeichnet glatte Linien für bis zu 20 Währungspaare, die die Volatilitätsstärke und -kraft darstellen - Zuerst zeigt er die stärksten Trendpaare an: Stärkste / Schwächste - HAUPTFUNKTION : Er gibt Hinweise auf die volatilste Linie des Aufwärtstrends und die volatilste Linie des Abwärtstren

Eurosmart Pro ist ein intelligenter Indikator der Erkennung von Trends, enthält zwei Intelligenzen. erstens ist die Intelligenz erkennt Trends, und Filter auf den Indikator kann funktionieren, um falsche Signale zu beseitigen. Dieser Indikator ermöglicht es Ihnen, den Handel leicht und genau zu öffnen. alle Funktionen des Indikators sind einfach zu bedienen und leicht zu verstehen. Trading-Regel: Paare: EURUSD, EURJPY Handelssession : Londoner und New Yorker Sesion Zeitrahmen : M30/H1 Stop Trad

Hinweis: Das Problem des langsamen Ladens des Indikators wurde behoben. Diese neue Version lädt schnell und verlangsamt die Plattform nicht.
Version 1.3 : Wir haben den Indikator aktualisiert und eine Option zum Scannen historischer Balken hinzugefügt. Anstatt alle Balken in der Historie zu scannen (was den Indikator manchmal langsam machen kann), können Sie die maximale Anzahl von Balken auswählen, die gescannt werden können, was die Leistung erhöhen und den Indikator schneller machen kann.

SMOOTH DEVIATION Linienanzeige für 2 Symbole Es vergleicht die Kraft/Stärke-Linien von zwei vom Benutzer eingegebenen Symbolen und erstellt eine GESCHWUNGENE Linie, die den Grad der Abweichung der 2 Symbole anzeigt Strategy#1- FOLLOW THE INDICATOR THICK LINE when CROSSING O LEVEL DOWN --- TRADE ON INDICATOR THICK LINE (TREND FRIENDLY) !! Strategie#2- TRADE INDICATOR PEAKS (Folge dem Indikator Reversal PEAKS Levels) !! Sie Eingabe - der Index der Berechnung ( 10/20/30....) - der Indikator Drawing
X Trendlinie X Trendline-Indikator zur Bestimmung der Richtung der Trendbewegung
Der X Trendline-Indikator verfügt über eine eigene, einzigartige Formel zur Berechnung der Richtung der Kursbewegung.
Dieser Indikator ist sowohl für Anfänger als auch für erfahrene Trader geeignet.
Der Indikator kann als hervorragender Filter für Ihr Handelssystem verwendet werden. Sie können auch festlegen, wo Sie in eine Position ein- und aussteigen wollen.
Für diejenigen, die diesen Indikator in ihrem Expe

Th3Eng Panda Trend ist ein leistungsfähiger Indikator, der sowohl für Scalping-Trades als auch für Swing-Trades perfekt geeignet ist. Th3Eng Panda Trend ist nicht nur ein Indikator, sondern ein sehr guter Trendfilter. Sie können ihn auf H4/H1 einrichten, um den Haupttrend zu finden und Scalping auf M5/m15/m30 Time Frames zu starten. Funktioniert mit allen Paaren und allen Time Frames.
Eingaben:
Abschnitt #1 Historie : Maximale Anzahl von Bars, um die letzten Signale zu zeichnen. (Voreinstellun
FREE
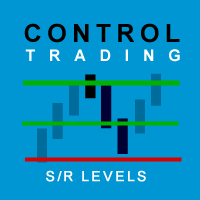
Control Trading Unterstützung und Widerstand
Es handelt sich um einen unabhängigen Indikator des TimeFrame, der es ermöglicht, die wichtigsten Marktniveaus je nach dem Zeitrahmen des Handels zu projizieren. Die Farben des Indikators sind so gewählt, dass sie zwischen den verschiedenen Arten von Niveaus unterscheiden und die wichtigsten hervorheben. Dieser Indikator ermöglicht es, auf demselben Diagramm die möglichen relevanten Ziele zu visualisieren, die verschiedene Trader nach verschiedenen

Dieser Indikator hilft Ihnen, die Symbole im Market Watch-Fenster zu scannen und einen Trend nach dem RSI herauszufiltern.
Der Relative-Stärke-Index (RSI) ist ein technischer Indikator, der bei der Analyse der Finanzmärkte verwendet wird. Er dient dazu, die aktuelle und historische Stärke oder Schwäche einer Aktie oder eines Marktes auf der Grundlage der Schlusskurse der letzten Handelsperiode darzustellen. Der Indikator sollte nicht mit der relativen Stärke verwechselt werden. Der RSI wird als
FREE

STOCHASTIC Armaturenbrett Dieser Indikator hilft Ihnen, die Symbole im Fenster Market Watch zu scannen und einen Trend nach STOCHASTIC herauszufiltern.
In der technischen Analyse des Wertpapierhandels ist der stochastische Oszillator ein Momentum-Indikator, der Unterstützungs- und Widerstandsniveaus verwendet. Dr. George Lane entwickelte diesen Indikator in den späten 1950er Jahren.[1] Der Begriff Stochastik bezieht sich auf den Punkt eines aktuellen Kurses im Verhältnis zu seiner Preisspanne ü
FREE

SKAN Dieser Indikator hilft Ihnen, alle Symbole, die sich im Market Watch-Fenster befinden, zu scannen und einen Trend mit Warnungen herauszufiltern. Er arbeitet mit den fünf effektivsten Indikatoren, die von den meisten Händlern für den Handel verwendet werden: Gleitender Durchschnitt Super Trend (ST) Bolinger Band (BB) OPRC BFD Es werden zwei Balken zum Scannen berechnet. Wenn die Farbe der Box auf korallen- oder königsblau wechselt, weist sie Sie auf einen Trendwechsel für einen Long- oder Sh
FREE

Zeigt die Höchst- und Tiefststände der vergangenen Monate an. Sie können die Anzahl der Monate einstellen, für die die Niveaus angezeigt werden sollen, sowie den Linienstil, die Farbe und die Breite. Dies ist sehr nützlich für Trader, die den BTMM und andere Methoden wie ICT verwenden. Ich werde ähnliche Indikatoren für MT5 für den BTMM erstellen. Senden Sie mir Ihre Vorschläge an mein Telegram: https://t.me/JDelgadoCR Werfen Sie einen Blick auf meine anderen Produkte unter: https://www.mql5.
FREE
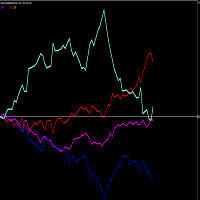
BITTE BEACHTEN SIE, DASS WIE VIELE ANDERE INDIKATOREN AUF DIESEM MARKT, WIRD DIESER INDIKATOR NICHT ALS DEMO-DOWNLOAD FÜR STRATEGIETESTER FUNKTIONIEREN. Daher ist die 1-Monats-Option zu den niedrigsten erlaubten Kosten von $10 für Sie zum Testen verfügbar. Eine der besseren Möglichkeiten zum Handeln ist die Analyse einzelner Währungen und nicht von Währungspaaren. Dies ist mit Standard-Chart-Indikatoren auf MT4 nicht möglich. Mit diesem Währungsstärkemesser kann man mit dem USDZAR, EURZAR, GBPZ
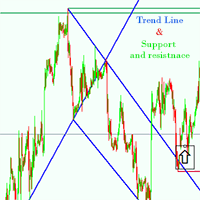
Die Unterstützungs- und Widerstandsstrategie ist eines der am häufigsten verwendeten Konzepte im Devisenhandel.
Seltsamerweise scheint jeder seine eigene Vorstellung davon zu haben, wie man Forex-Unterstützung und -Widerstand messen sollte. Mit diesem Indikator verschwenden Sie keine Zeit mehr, denn er erledigt das automatisch für Sie, Eigenschaften des Support and Resitance Indikators * Automatische Erkennung der Trendlinie und der Unterstützung und des Widerstands * Funktioniert für jedes Paa
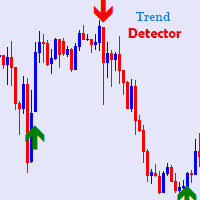
Trend Detector Trading Indicator ist ein Trendfolge-Handelssystem, das auf der MT4-Plattform basiert und den Beginn eines Trends erkennt. Sehr einfach und Power-Indikator zeigt Kauf / Verkauf Pfeile Richtung für den Handel mit Währungen und Rohstoffen als auch. ein Scan erfolgt, die bestimmte Trades, lange und kurze, die 1 Sekunde dauert, um die Entry / Exit-Punkte zu generieren generiert,
Währungspaar : EUR/CHF, EUR/GBP, EUR/JPY, EUR/USD, GBP/CAD, GBP/JPY, GBP/USD, NZD/USD, USD/CAD, USD/CHF .

Simple 3 Bewegliche Unterstützungen und Widerstandsniveaus (Ihre Bewertung/Kommentar und Feedback ist wichtig! Danke) Signal UP und Down Möglichkeiten bei Überschreiten der Multi Supports/Resistance Levels erstellt unterstützt alle Zeitrahmen Angepasste Eingaben für den abgedeckten Bereich, um die Levels zu generieren und die Verschiebungen, die nötig sind, um die 3 Unterstützungs-/Widerstandsebenen abzudecken zum Beispiel können Sie die Hauptparameter in M30-Zeitrahmen verwenden: extern int Sh
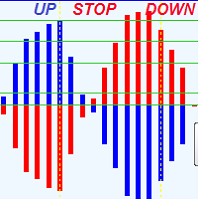
Dieser Indikator, der präzise Preis Richtung zeigt, und Kraft dieser Richtung, Umkehrungen, fügte es zu jedem Diagramm und Sie verdrängen jede Verwirrung.
Er berechnet die Kraft der aktuellen Richtung und prognostiziert Preisumkehrungen mit einem hohen Grad an Genauigkeit mit seinen Schlüsselebenen und es ist großartig für Scalping, oder Swing Trading. Für jeden Zeitrahmen ist das folgende Verhalten das gleiche: Ein blaues Histogramm über 0,0 bedeutet, dass ein Käufer die Preisbewegung dominier
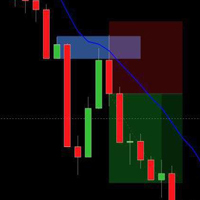
Ich habe zweieinhalb Monate damit verbracht, Charts zu überprüfen, nach den besten Varianten für FTB-Trades zu suchen und den Indikator anzupassen, um diese endgültige Version zu erhalten. Ich denke, dies sind die besten Regeln, um so viele FTB-Setups wie möglich zu erhalten. Mein Ziel war es, den Handel komfortabler zu gestalten, da ich mir nicht vorstellen kann, mindestens 36 Tabs durchzugehen und nach FTRs zu suchen und dann wieder FTBs zu überprüfen. FTB-Setup ist ziemlich einfach und leicht

Der Indikator für die Stoppjagd zeigt die Pegelzone der Tagesvermarktung an. Die Zonen werden als Rechtecke im Hintergrund angezeigt. Die Länge des Rechtecks entspricht der Dauer des aktiven Handels, und die Höhe der Handelsspanne. Für den aktuellen Handelstag gibt es noch die Möglichkeit, die Extremkurse jeder Zone anzuzeigen. Die folgenden Parameter können im Indikator konfiguriert werden: NumberOfDays = 200 - Die Anzahl der angezeigten Tage.

Der Krebsindikator ist ideal für den Trendhandel! Ein intelligenter Indikator-Algorithmus mit hoher Wahrscheinlichkeit zeigt die Punkte einer möglichen Marktumkehr an. Wenn Sie in einem Trend handeln, dann ist eine Handelsstrategie, die auf der Grundlage dieses Indikators aufgebaut ist, perfekt für Sie. Der Indikator filtert das Marktrauschen heraus, fast alles und alle notwendigen Funktionen für die Arbeit mit einem Thread sind in einem Tool integriert. Er funktioniert auf allen Währungspaaren

Inspired from, Die Zeit ist der wichtigste Faktor bei der Bestimmung von Marktbewegungen, und durch das Studium vergangener Kursaufzeichnungen können Sie sich selbst beweisen, dass sich die Geschichte wiederholt, und indem Sie die Vergangenheit kennen, können Sie die Zukunft voraussagen. Es gibt eine eindeutige Beziehung zwischen Preis und Zeit. -William Delbert Gann
CITRA BOT ist ein Indikator zur Erkennung von Preisaktionen/Preismustern, der historische Daten zur Validierung eines aktuellen

Für diesen Indikator wurde ein neuer Algorithmus zur Trendbestimmung entwickelt. Der Algorithmus erzeugt mit akzeptabler Genauigkeit Eingangssignale und Ausgangspegel. Strategie für den Trendhandel, Filterung und alle notwendigen Funktionen in einem Tool vereint! Das Funktionsprinzip des Indikators besteht darin, bei der Platzierung auf einem Chart automatisch den aktuellen Marktzustand zu bestimmen, historische Daten auf der Grundlage historischer Daten zu analysieren und dem Trader Anweisungen

Dieses Scanner Dashboard verwendet den Extreme TMA System Arrows Indicator, um gute KAUF/VERKAUF-Signale anzuzeigen. Dieses Produkt enthält nur das Dashboard. Es enthält nicht den Abiroid_Arrow_Extreme_TMA.ex4 Indikator. Der Arrows-Indikator ist nicht erforderlich, damit das Dashboard funktioniert. Um Pfeile zu sehen, können Sie die Pfeile Indikator separat kaufen, wenn Sie möchten: h ttps:// www.mql5.com/en/market/product/44822
Dash zeigt die Steigungen für aktuelle und höhere Zeitrahmen. - Di
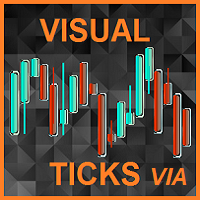
Eine echte Rarität für Scalper.
Suchen Sie nach TFs unterhalb von M1?
Möchten Sie die Preisdynamik innerhalb der Kerze sehen?
Dies ist ein Tool für Sie.
Visual Ticks ist ein Indikator, der den Tick-Chart in einem separaten Fenster anzeigt.
Er tut dies in Echtzeit und wartet auf wechselnde Ticks.
Dank Visual Ticks können wir in das Innere der traditionellen Kerze schauen und die Dynamik des sich bewegenden Preises sehen.
Durch die Einstellung "period_of_model" können wir einen Chart aus Kerzen ge

Ein sehr einfacher und praktischer Trendindikator, der auf Preisdivergenzen basiert. Er hat sich beim Scalping gut bewährt. Er hilft bei der Suche nach Einstiegspunkten für die Analyse. Er kann als Filter im Handel verwendet werden. Er hat zwei Parameter: Periode und Level. Der Level-Parameter hilft dabei, überflüssige Signale herauszufiltern. Für EURUSD kann der Level-Parameter zum Beispiel 0,0001 sein. Der Indikator kann sowohl für Einstiegspunkte als auch als Filter verwendet werden. Der Ind

Condor TMA (Triangular Moving Average ) ist ein Kanalindikator ohne Redrawing, der auf der Grundlage von gleitenden Durchschnitten aufgebaut ist. Der Hauptunterschied zwischen dem Condor TMA-Indikator und anderen Kanalindikatoren (z.B. vom gleichen Bollinger-Indikator) besteht darin, dass Condor TMA nicht einfache gleitende Durchschnitte berücksichtigt, sondern doppelt geglättete, was es erlaubt, die Marktbewegung klarer zu bestimmen, und andererseits den Indikator weniger empfindlich macht.

Wählen Sie aus bis zu 6 Strategien allein oder kombinieren Sie verschiedene Strategien zur Signalerzeugung (Die Kombination von mehr als 2 Strategien kann die Anzahl der Signale stark einschränken)! ALLES aus dem Chart !!! Auch Inputs Bearbeitung von Chart !!! Drücken Sie Ihre Strategie nach unten (eine Strategie) ODER kombinieren Sie Signale von so vielen Strategien (bis zu 6): Ausgewählte und aktivierte Strategien werden in GRÜN angezeigt !!! 1- BUY SELL Bereiche 2- Unterstützung-Widerstand-B

Der Indikator zeigt gleitende Durchschnitte auf einer bestimmten Anzahl von Balken an (Zählbalken für die Anzeige von MA ). Diese Art der Darstellung vereinfacht die Analyse, da das Diagramm nicht mit unnötigen Linien überfrachtet wird. Es gibt auch eine Textbeschriftung, die den aktuellen Preis des gleitenden Durchschnitts und den Zeitraum des Charts anzeigt. Hotkeys werden verwendet, um die Verwendung des Indikators zu vereinfachen.
Einstellungen des Indikators: Gleitender Durchschnitt #1 -
FREE

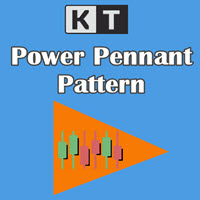
KT Power Pennant erkennt und markiert das bekannte Wimpel-Muster im Chart. Ein Wimpel ist ein Trendfortsetzungsmuster mit einer starken Kursbewegung in eine Richtung, gefolgt von einer Konsolidierungsphase mit sich verengenden Trendlinien.
Sobald ein Wimpelmuster erkannt wurde, wird ein Kauf- oder Verkaufssignal durch einen bullischen oder bärischen Ausbruch nach der Formation generiert.
Funktionen
Wimpelmuster bieten einen risikoreduzierten Einstieg nach einer Konsolidierung, gefolgt von ein

Dies ist ein kostenloses Produkt, das Sie gerne für Ihre Zwecke verwenden können!
Ich würde mich sehr über eine positive 5-Sterne-Bewertung freuen! Vielen Dank!
Klicken Sie hier, um hochwertige Trading-Roboter und Indikatoren zu sehen!
Forex Indicator Spread Display für MT4, großartiges zusätzliches Handelstool.
- Der Spread Display-Indikator zeigt den aktuellen Spread des Forex-Paares an, an dem es angebracht ist. - Es ist möglich, den Spread-Anzeigewert in jeder Ecke des Diagramms zu plat
FREE
Der technische Indikator RSI Multi Timeframe Alert ist ein leistungsstarkes Tool, das einen umfassenden Überblick über den RSI (Relative Strength Index) über mehrere Zeitrahmen hinweg gleichzeitig bietet. Mit diesem Indikator können Händler überverkaufte und überkaufte Bedingungen über verschiedene Zeiträume hinweg leicht erkennen, ohne zwischen Diagrammen wechseln zu müssen. Es enthält außerdem ein Schnellwarnsystem, das Mobil- und Popup-Benachrichtigungen sendet, wenn der RSI vordefinierte

Ich stelle Ihnen einen umfassenden Indikator vor, der auf mathematischen, historischen und Preisberechnungen basiert. Der Indikator wird Ihnen beim Aufbau Ihrer eigenen Handelsstrategien und -systeme sehr nützlich sein. Wozu der Indikator fähig ist: 1. Bildet Kanäle auf der Grundlage von Preisniveaus. Er bestimmt die Stärke des Kanals und gibt sie visuell wieder (je dicker die Linie, desto bedeutender ist der Kanal). Die gestrichelte Linie ist der schwächste Kanal) 2. Bildet Wellen auf der Grun

Der Indikator kombiniert mehrere Berechnungsarten: Berechnung der Preiskanäle und Bestimmung der Trendrichtung. Die grüne Linie ist ein Kaufsignal ; Die magentafarbene Linie ist ein Signal für Verkäufe . Zwei gelbe Linien des "kleinen" Kanals oberhalb der mittleren grünen Linie - Bereitschaft zum Verkauf; Zwei gelbe Linien unterhalb der magentafarbenen Linie - bereit zum Kauf. Blaue Kanallinien - je größer der Abstand zwischen den Linien, desto näher ist der Kursrückgang oder die Trendumkehr. D

Extreme TMA System mit Pfeilindikator Und Buy/Sell Boxen mit Take Profit & Stop Loss
Dies ist ein auf dem Extreme TMA System basierender Indikator ohne Pfeile. Er zeigt TMA-Kreuzsignale und die besten KAUF/VERKAUF-Signale an. Zusammen mit dem am besten vorhergesagten TakeProfit. Und StopLoss basierend auf dem TakeProfit-Verhältnis.
Bitte beachten Sie: Dies ist ein reiner Pfeil-Indikator. Das Dashboard ist hier separat erhältlich: https://www.mql5.com/en/market/product/44825
Über den Indikato
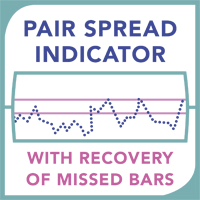
Pair Spread Indicator mit Wiederherstellung der verpassten Balken. Dieser Indikator stellt verpasste Bars in der Historie automatisch zum Durchschnittspreis der benachbarten Bars wieder her. Ein Histogramm-Chart zeigt die Preisdifferenz zwischen den beiden Instrumenten in einem separaten Fenster an. Ideal für verwandte Instrumente, zum Beispiel: BRN - WTI, GOLD - 50 * Silber, DJ - 14 * S & P500, usw. ; Berechnungsmethode: die Differenz der Schlusskurse (Eröffnung / Maximum / Minimum) zwischen zw
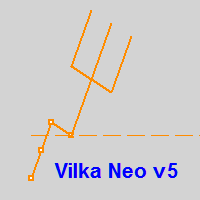
Neo Fork v5 wurde für das Handelssystem "Oracle" entwickelt, wurde aber nach und nach ergänzt, z.B. mit Gann-Winkeln und anderen Optionen....
Sie können grafische Objekte mit bestimmter Farbe, Stil und Dicke erstellen, wie z.B.: Rechtecke mit und ohne Füllung, Trendliniensegmente und ein nicht standardisiertes Werkzeug - "Neo Fork" in Form eines Dreizacks, sowie die Möglichkeit, die Farbpalette direkt aus dem Chart interaktiv anzupassen, die Sichtbarkeit der Objekte für verschiedene TFs, Dicke u
FREE

Special Offer, The Prices For Limit Time Golden Sign ist ein Indikator, der den Einstieg in Kauf- oder Verkaufspositionen signalisiert. Er funktioniert am besten auf GBP-Paaren und einem 4-Stunden-Rahmen. Er kann bei jedem Signal 20 bis 200 Pips einbringen. Seine Erfolgsquote liegt bei über 80%. Er enthält zwei Arten von Signalen für jede Richtung, eines ist langsam und das zweite ist schneller. Sie können jedes von ihnen verwenden, aber wenn die beiden zusammen kombiniert werden, sind sie das
Dieses Tool hat sich bei Tests auf dem Forex-Markt für das Währungspaar EUR/USD gut bewährt. Wir haben dieses Tool auch für Binäre Optionen getestet und war in der Lage, Signale von guter Qualität auf dem EUR/USD-Währungsmarkt zu zeigen. SIGNALE NICHT RENDERY BEWEGEN DEN PFEIL UM 1 KERZE MAXIMAL IST DIES EXTREM SELTEN ZU BEGEGNEN
Die Signale dieses Instruments werden während des Candlesticks gebildet. Es lohnt sich, in den Handel einzusteigen, nachdem die Kerze, bei der das Signal erzeugt wurde

Ich empfehle Ihnen, den Blog des Produkts (Handbuch) von Anfang bis Ende zu lesen , damit von Anfang an klar ist, was der Indikator bietet . Dieser Indikator mit mehreren Zeitrahmen und Symbolen identifiziert doppelte Top/Bottom-, Kopf-Schulter- , Wimpel/Dreieck- und Flaggenmuster. Es ist auch möglich, Alarme nur dann einzurichten, wenn ein Nackenlinie-/Dreieck-/Flaggenpol-Ausbruch stattgefunden hat (Nackenlinie-Ausbruch = bestätigtes Signal für Top/Bottom und Head & Shoulder). Der Indikator ka

Der Aufstieg des Sky Walkers ist ein Trend-Indikator ist ein leistungsfähiger Indikator für jeden Par und jeden Zeitrahmen. Der Indikator gibt klare Signale über die Eröffnung und Schließung von Trades. Dieser Indikator ist ein einzigartiges, qualitativ hochwertiges und erschwingliches Handelsinstrument. Kann in Kombination mit anderen Indikatoren verwendet werden. Perfekt für neue Trader und Expert Trader Geringes Risiko beim Einstieg. Wiederholt niemals das Signal. Zeichnet niemals das Signal

Dieser Indikator sucht nach Marktmodellen wie: Kopf und Schultern, Dreiecke, Doppel-Tops und -Bottoms, Flaggen, Keile und Three Touches.
Optionen:
barsToProcess - die anfängliche Anzahl der zu berechnenden Balken;
ArrowSize - Größe des Pfeils;
AllowablePatternLength - Mindestlänge des Musters (in Takten);
AllowablePatternPriceDiv - die Mindesthöhe des Musters, anwendbar für alle außer den Mustern "Kopf und Schultern" und "Doppeltop" (für letztere gibt es einen weiteren Parameter);
AllowablePric
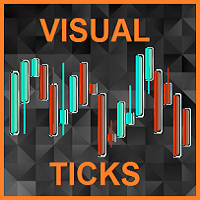
Eine echte Rarität für Scalper.
Suchen Sie nach TFs unterhalb von M1?
Möchten Sie die Preisdynamik innerhalb der Kerze sehen?
Dies ist ein Tool für Sie.
Visual Ticks ist ein Indikator, der das Tick-Chart in einem separaten Fenster anzeigt.
Er tut dies in Echtzeit und wartet auf wechselnde Ticks.
Dank Visual Ticks können wir in das Innere der traditionellen Kerze schauen und die Dynamik des sich bewegenden Preises sehen.
Durch die Einstellung "period_of_model" können wir einen Chart aus Kerzen ge
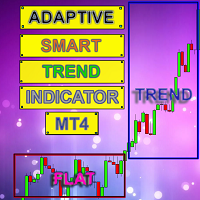
Smart Indicator Adaptive Smart Trend Indicator bestimmt die Sektoren des Trends und des Flats und zeigt außerdem in Form eines Histogramms die Durchbruchspunkte der Levels (1 - 5) an.
Der Indikator führt viele mathematische Berechnungen durch, um optimale Trendbewegungen auf dem Chart anzuzeigen.
Das Programm enthält zwei Indikatoren in einem: 1 - zeichnet die Trend- und Flat-Sektoren, 2 - der Histogramm-Indikator zeigt die besten Signale für die Eröffnung einer Order. Der Indikator berechne

Crazy Dancing bewegte RES/SUP Levels Automatisches Neuzeichnen von gleitenden Unterstützungs- und Widerstandsebenen um anzuzeigen, dass der Preis Unterstützungen durchbricht (Signal SELL) oder das Durchbrechen von Widerstandsniveaus (Signal BUY) Sehr einfach erscheinender Indikator, aber auch sehr clever und intelligent !!!! Wichtigste Eingaben: # Anzahl der Balken für die Unterstützungs- und Widerstandsniveaus + die anfängliche Verschiebung vom Startpunkt + gleitender Durchschnitt für die Filte
Trendfinder SMA sind farbige Candlesticks, die den Trend auf der Grundlage von zwei einfachen gleitenden Durchschnitten und der Steigung des langsamen gleitenden Durchschnitts anzeigen. Dieser Indikator zeigt Ihnen den Farbwechsel auf dem nächsten Balken auf der Bestätigungskerze an und wird niemals neu gemalt. Trendfinder SMA ist für den Handel auf allen Märkten optimiert und kann sowohl auf Märkten mit als auch ohne Trend verwendet werden. BITTE BEACHTEN SIE: Für beste Ergebnisse verwenden Sie
FREE

Der von Tushar Chande entwickelte Variable Index Dynamic Average (VIDYA) ist standardmäßig in der MT5-, nicht aber in der MT4-Plattform enthalten. Es handelt sich um einen dynamischen EMA (Exponential Moving Average), der seine Länge (LB-Periode) automatisch an die Marktvolatilität anpasst, die ursprünglich durch den Chande Momentum Oscillator (CMO) gemessen wurde. Der CMO-Wert wird als Verhältnis zum Glättungsfaktor des EMA verwendet (The New Technical Trader von Tushar Chande und Stanley Krol
FREE

CCI Trend Finder Indikator mit verschiedenen Farben auf den Ebenen 0, 100 und -100. Das Kreuz ist ein Signal für "123 Exit", wie es von MPlay vorgestellt und in Woodies CCI-System verwendet wird. Dieses Ausstiegssignal ist vor allem bei kurzfristigen Ausbruchsgeschäften effektiv, da es einen vorzeitigen Ausstieg bei kleinen Korrekturen verhindert. Dieser Indikator eignet sich hervorragend, um ihn als zusätzliches Werkzeug für Ihre Analyse zu nutzen.
FREE

Kostenlose Version von https://www.mql5.com/en/market/product/44606 Einfacher Indikator zur Berechnung des Gewinns auf Fibonacci-Retracement-Levels mit fester Losgröße, oder zur Berechnung der Losgröße auf Fibonacci-Levels mit festem Gewinn. Fügen Sie den Indikator zum Chart hinzu und verschieben Sie die Trendlinie, um die Fibonacci-Retracement-Levels festzulegen. Funktioniert ähnlich wie die Standard-Fibonacci-Retracement-Linien-Studie in Metatrader . Eingaben Fixed - wählen Sie aus, welcher We
FREE

Ein Zwei-Linien-Crossover-Oszillator für Marktein- und -ausstieg. Verwenden Sie ihn auf M15 und höher für eine bessere Genauigkeit. Platzieren Sie den Indikator auf einem zweiten Chart mit demselben Währungspaar und erweitern Sie ihn, um eine bessere Übersicht zu erhalten. Der Indikator vermittelt einen guten Eindruck von Volatilität, Volumen und Trend. Funktioniert bei jedem Währungspaar, jedoch besonders gut bei Währungspaaren mit hoher täglicher PIP-Volatilität wie GBPJPY, GBPNZD und exotisch

Einfacher Indikator für BUY / Sell Zones sich bewegende Kauf- und Verkaufszonen : Die nächstgelegene Zone ist breit und deutlich : Rot für die Verkaufszone, Grün für die Kaufzone >>> alte, weit entfernte Zonen sind in fetten Linien dargestellt :::BUY Zones (GREEN) erscheinen nur im UP Trend und verschwinden im DOWN Trend :::SELL-Zonen (ROT) erscheinen nur im DOWN-Trend und verschwinden im UP-Trend Eingabeparameter ::: Indexbalken : Balkenbereich für die Zonenberechnung Levels : Anzahl der Zonen
Diverence Dash ist ein MACD, RSI, OBV, Momentum, Stochastic oder Standard Deviaviation Divergence Dashboard. Es scannt alle Symbole und Zeitrahmen, die Sie wünschen. Außerdem kann Divergence Dash Charts mit den gefundenen Divergenzen öffnen, indem es die Vorlage Ihrer Wahl verwendet. Divergenzen werden oft als Frühindikator verwendet und sind mit Divergence Dash leicht zu erkennen. Das Risiko-Ertrags-Verhältnis beim Divergenzhandel ist sehr gering. Was kann Divergence Dash für Sie tun: Finden Si
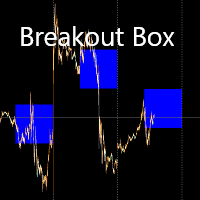
Eine Breakout-Box, die für den Beginn einer der wichtigsten Handelssitzungen eingestellt werden kann - Hongkong, London, London-New York Überschneidung. Legen Sie die Breite des Ausbruchsfeldes in Punkten fest (10 Punkte=1 PIP) Verwenden Sie die Box, um festzustellen, ob sich das Währungspaar, mit dem Sie handeln, in einem Kanal befindet oder nicht. Handeln Sie, sobald der Kurs aus der Box ausbricht. Verwenden Sie einen Volumen- und Momentum-Indikator, um beste Ergebnisse zu erzielen. Sie können

mql5 Version: https: //www.mql5.com/en/market/product/44815 Einfacher Indikator zur Berechnung des Gewinns auf Fibonacci-Retracement-Levels mit fester Losgröße, oder zur Berechnung der Losgröße auf Fibonacci-Levels mit festem Gewinn. Fügen Sie dem Chart hinzu und verschieben Sie die Trendlinie, um die Fibonacci-Retracement-Levels festzulegen. Funktioniert ähnlich wie die Standard-Fibonacci-Retracement-Linien-Studie in Metatrader. Eingaben Fixed - wählen Sie aus, welcher Wert fixiert werden soll,

Ein Swing Failure Pattern (SFP ) ist ein Handelsaufbau, bei dem große Händler Stop-Losses über einem wichtigen Swing-Hoch oder unter einem wichtigen Swing-Tief setzen, um die Liquidität zu generieren, die erforderlich ist, um den Preis in die entgegengesetzte Richtung zu drücken. Wenn der Kurs 1) über einem wichtigen Swing-Hoch liegt, dann aber 2) wieder unter diesem Swing-Hoch schließt, handelt es sich um einen potenziellen bärischen SFP . Baisse-SFPs bieten Chancen für Short-Trades . Wenn der
Ist Ihnen bekannt, warum der MetaTrader Market die beste Plattform für den Verkauf von Handelsstrategien und technischer Indikatoren ist? Der Entwickler braucht sich nicht mit Werbung, Programmschutz und Abrechnung mit Kunden zu beschäftigen. Alles ist bereits erledigt.
Sie verpassen Handelsmöglichkeiten:
- Freie Handelsapplikationen
- Über 8.000 Signale zum Kopieren
- Wirtschaftsnachrichten für die Lage an den Finanzmärkte
Registrierung
Einloggen
Wenn Sie kein Benutzerkonto haben, registrieren Sie sich
Erlauben Sie die Verwendung von Cookies, um sich auf der Website MQL5.com anzumelden.
Bitte aktivieren Sie die notwendige Einstellung in Ihrem Browser, da Sie sich sonst nicht einloggen können.