
在Facebook查找我们! 加入我们的粉丝群
使用MetaTrader 5新的可能性
最受欢迎的EA交易和技术指标、新闻信号、代码库中常规传入的现有的MQL5程序和热门讨论的论坛主题。
The purpose of Impulse Release is to prevent trading in the wrong direction. While the Impulse System operates in a single timeframe, Impulse Release is based on two timeframes. It tracks both the longer and the shorter timeframes to find when the Impulse points in the same direction on both. Its color bar flashes several signals: If one timeframe is in a buy mode and the other in a sell mode, the signal is "No Trade Allowed", a black bar. If both are neutral, then any trades are allowed, showi
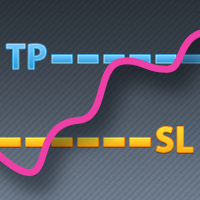
有些交易者不喜欢让他们头寸中的止盈/止损价格暴露出来,这个EA可以帮助他们。 把EA拖放在图表上,并设定止盈/止损点(0意味着忽略),如果图表上的商品有头寸,它会在图表上监察商品的价格,如果价格达到用户设定的止盈/止损水平,就关闭这个头寸。 这个工具可以有效隐藏用户的止盈/止损价格。止盈/止损价格由开仓价格与用户设定的止盈/止损点子所决定。 欢迎提出宝贵建议和意见。 。。。。。。。。。。。。。。。。。。。。。。。。。。。。。。。。。。。。。。。。。。。。。。。。。。。。。。。。。。。。。。。。。。。。。。。。。。。 ........................................................................................
This indicator let user clearly see Buy/Sell signals. When a bar is closed and conditions meet, arrow signal will come up at Close Price, up is Buy and down is Sell. It works on all Timeframes. And you can set sound alert when signals come up.
The Red Green Trade Signals indicator just gives you the direct signal to open and close your positions, just like traffic signals. When the signal turns to red, the market goes to short position, while the signal turns to green, the market goes to long position. This indicator also provides the precise time and price to open/close your positions with the 'buy' (green) and 'sell' (red) arrows. It's easy to use, and it's ready to go without any parameter to set. This indicator is implemented by c
The AdvancedTrend indicator automatically traces market price movement and draws a pair of resistance and support lines. It's easy to figure out market trend with resistance level and support level and when/how market breaks out key price level.
One of the key rules in trading is never move your stops in such a way that your risk increases. Our stop sequence shows the automatic tightening of stops. They appear as a series of decreasing risk points until the trade is eventually stopped out. The problem is that if you enter a trade at any other point than the initial dot of the sequence, you may be placing the stop too close. Stop-entry plots show you the initial value for the stop for each bar. You can use them when you put on a trade,
包络线或通道线设置为平行于移动平均线(如果您使用两个均线,则为慢速均线)。两条通道线必须包含日线图上过去两三个月所有价格的大约 95%,只有极值突出在外面。通道线提供了有吸引力的利润目标——在上线附近卖出多头,在下线附近做空。 AutoEnvelope 是一个自定义指标 - 一个原始工具,通过计算最后 100 根柱线的标准偏差来自动选择通道宽度。它被设计为使用固定通道大小或最多每周更改一次值(在每周图表上每月一次),使其甚至适用于日内数据(使用“固定通道大小”参数从一种模式到另一种模式)。 除了 AutoEnvelope 之外,还绘制了 EMA。这种组合允许您更改 EMA 并使包络跟随它,而无需调整两个单独的指标。如果您不想看到移动平均线,请进入 AutoEnvelope 属性并将平均线(第二行)的颜色更改为“无”。 参数: EMA_长度 (22) – 这是绘制在通道中心的指数移动平均线的条数。 因素 (27) – 这是用于创建通道的标准偏差数(以十分之一表示)。 从统计上讲,2.7 是适合使用的大小,但它假定标准分布,这并不总是存在于市场中。 我们发现 27 适用于大多数使用