在Facebook查找我们! 加入我们的粉丝群
使用MetaTrader 5新的可能性
最受欢迎的EA交易和技术指标、新闻信号、代码库中常规传入的现有的MQL5程序和热门讨论的论坛主题。
The Loading deposit allows to see the Margin/Deposit ratio for opened positions and provides a convenient way to control risk in trading. The Margin/Deposit ratio is shown as a gradient color histogram, the color depends on Margin/Deposit ratio. The values >50% indicates high risk and shown with red color.
This indicator shows Pin Bar candlestick pattern on the chart. The bearish pin bars have red color, the bullish pin bars have blue color. The indicator shows alert when Pin Bar candlestick pattern is formed. It's recommended to use it at timeframes H1 and higher. The best moment (strong signal) is when Pin Bar is formed close to the support/resistance level.
The Reverse Bar indicator paints the reversal bars according to trade strategy, described by Bill Williams in "Trading Chaos. Maximize Profits with Proven Technical Techniques" book. The bearish reversal bar has red or pink color (red-stronger signal) The bullish reversal bar has blue or light blue color(blue - stronger signal) It is recommended to use it on hourly timeframe (H1) and higher.
This Scalper Expert Advisor is based on 3 indicators: Heiken Ashi, Moving Average and Stochastic Oscillator. Positions are opened when a signal is triggered by those indicators. Open position are closed by Take Profit, Stop Loss. If Close by Opposite Signal is activated then positions will be closed if a reverse signal appears. To lock account profit or limit account loss, you can activate Target equity and/or Minimum equity in percentage of deposit at the settings. This EA is optimized for EURU
Classic Multi-currency Break-Even. It only changes order Stop Loss level when the current price reaches Break Even Level pips of profit, securing/"locking" Break Even Profit pips of profit. Allows flexible positions filtering and processing by: Pair Magic Position ID Position Type The Expert Advisor can be placed on any chart. You can use Advanced Break Even simultaneously with any other trading Expert Advisor. Also features: On Screen Display Extended logging Separate EA log file Standard Met
Virtual Multi-currency Break Even. It works exactly as the "regular" Break Even, but it does not send trading orders to change the existing Stop Loss. It only changes Virtual Stop Loss level when the current price reaches Break Even Level pips of profit, securing/"locking" Break Even Profit pips of profit. When the price turns back and becomes equal to the Virtual Stop Loss level, the position is closed at market price. It allows flexible positions filtering and processing by: Pair Magic Positio
交易员动态指数(TDI) - 概述 交易员动态指数(TDI)是基于RSI振荡器的多功能指标。 它帮助交易者识别市场状况和潜在的反转信号。 TDI 将多个指标结合为一个,提供市场动态的全面视图。 组成部分: 绿色线:RSI 价格线 红色线:交易信号线 蓝色填充:波动带 黄色线:市场基准线 视觉信号: 趋势方向: 短期趋势: 绿线在红线上方:价格上涨。 红线在绿线上方:价格下跌。 总体趋势: 黄色线在32和68之间波动。关注该线的反弹情况,以识别市场反转。 当价格在黄色线上方时做多,在黄色线下方时做空。 市场强度和波动性: 短期分析: 绿线陡峭上升:市场强势。 绿线水平或平缓:市场疲弱,横盘整理。 总体分析: 蓝色填充区域扩大:市场趋势强劲。 蓝色填充区域收缩:市场疲软,波动较小。 蓝色线极度收缩:市场可能因经济公告或其他条件出现剧烈波动。 在EA(智能交易系统)中使用TDI: 要在EA中使用TDI指标,可以使用 iCustom 函数调用它,并获取其缓冲值以生成交易信号。 以下是一个简要示例: // 创建指标句柄 int handle_tdi = iCustom ( Symbol ()
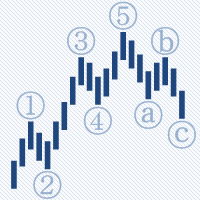
AutoElliottWaveMaker is the first tool for MetaTrader 5 , created for semi-automatic analysis of Elliott waves. It has many unique features: Automatic bar binding of waves for all timeframes; The waves can be labelled in 2 ways: drag and drop from the Labels panel and using the mouse click on the bar; Automatic arranging of the labels at all timeframes according to wave levels seniority; Automatic and manual control of the number of wave levels shown on a chart; Wave levels custom labelling sty
该工具帮助用户轻松地一键平仓,当某个持仓头寸的损益达到或者超过用户设定的点子时。 使用时请先设置滑移值。 有时,由于市场的高度波动,一些头寸不能及时关闭,这时 请设置较大的滑移值,或重新按动平仓按键。 ...................................................................................................................................................... ===================================================================================================
这款剥头皮指标为您显示可以安全赚取 10 个点,且风险仅有 2 个点的那一刻。如果使用正确的资金管理,它可以极大地增加您的资产。 此指标只有一个输入参数 - 柱线数量, 用于趋势计算。 当信号出现, 在高于当前价位 2 点的上方放置挂单 (买单) 或低当前价位 2 点的下方放置卖单。 止损 - 2-3 点; 止盈 - 从 10 点起; 建议时间帧 - M1。 品种高波动且低点差 - EURUSD, AUDUSD, GBPUSD, EURJPY 等等。 如果仓位已开, 但价格未到达止盈价, 修改止损到盈亏平衡点, 并依据前一根柱线的最低价设置多单尾随停止, 或前一根柱线的最高位设置空单尾随停止。 FYI :如果您購買此指示器而不是租用它,您可以通過向我們發送您的付款證明來免費索取其源代碼。
Indicator to measure market activity and to show speed of price in pips/sec. Have you been wondering, what is current speed of the market? I see the ticks jumping up and down, can I measure their speed? All these questions can be answered by Tick Speed v1.0 - good looking indicator with good configuration possibilities. It will show you directional movement speed in ticks per second or in time defined by you! Good for scalpers, good for long term-traders. Good for beginners, good for pros. Th
If you want something as below: Sell FOREX trading signal. Manage multiple accounts. Follow somebody's trading. "TradeCopier_source" and "TradeCopier_follow" can help you! Features: Copying from one source (master) account to multiple follower (slave) accounts. Allow investor (read only) password for the source (master) account. There are no complicated settings and input parameters, everything is easy. Works with different Brokers. Works with different symbols (EURUSD_FX, eurusd_m, etc.). Can c
Multi-currency virtual Take Profit and Stop Loss. Virtual stops work as usual SL/TP on a server/broker side, but are not visible to your broker and are kept only within EA "memory". Allows flexible positions filtering and processing by: Pair Magic Position ID Position Type The Expert Advisor can be placed on any chart. You can use Virtual Stops simultaneously with any other trading Expert Advisor. The Expert Advisor also features: on screen display extended logging separate EA log file standa
本 EA 是 MetaQuant-ATC10 的版本, 修改为用于一个货币对, 所有参数可调以及优化。 当然, 可以加挂到更多/若干货币对上,得到的结果就像 自动交易大赛 2010 。 此 EA 基于 "均匀网格"。如果持仓亏损, 按照不同步长加仓。这样做的目的是将持仓成本摊薄到市价附近,当调整时会转为利润并平仓。 输入参数的含义和操作方法: StartType - 在开始时识别首单的类型 (买或卖)。 Lot - 初始和后继交易量。 MaxLot - 最大可达的交易量 (所有订单总合)。 Trailing - 盈利尾随终止百分比 (0.7=70%)。 最小盈利等于所赢仓位交易量 = Lot 和价差 = Step 。 Step - 此参数有两个含义: 作为止盈 - 尾随终止的初始位; 作为开第二单的举例, 如果价格走向亏损方向 第二单之后的后续订单将使用变化的步长。如何根据 " Agres " 比例修改这个步长。 对于次要货币 JPY (USDJPY, EURJPY, ...) Step 参数值必须乘以 100。 Agres - 主动因子判断算法计算下一笔订单的步长。 合理的数值是从
One of the key rules in trading is never move your stops in such a way that your risk increases. Our stop sequence shows the automatic tightening of stops. They appear as a series of decreasing risk points until the trade is eventually stopped out. The problem is that if you enter a trade at any other point than the initial dot of the sequence, you may be placing the stop too close. Stop-entry plots show you the initial value for the stop for each bar. You can use them when you put on a trade, a
Pearson linear correlation. The indicator shows statistical correlations between symbols, selected by user. Input parameters: Time frame - timeframe for analysis (Current, 1 Minute, 2 Minutes, 3 Minutes, 4 Minutes, 5 Minutes, 6 Minutes, M10 Minutes, M12 Minutes, M15 Minutes, M20 Minutes, M30 Minutes, 1 Hour, 2 Hours, 3 Hours, 4 Hours, 6 Hours, 8 Hours, 12 Hours, 1 Day, 1 Week, 1 Month).; Prices - price type, used in analysis (Close price, Open price, High price, Low price); Limit analysis - Numb
MACD 技术在日常交易中经常使用。对于寻找当前行情趋势,和行情发散/收敛它很有用。 这个版本的 MACD,可以更快、更好地帮助现实世界里的人们做出交易决策。它基于省缺的 MACD, 加上行情力量的强度功能 (绿色柱线代表作多强度, 红色代表做空强度), 且箭头指示开/平仓的方向。通过比较强度柱线, 您可以更容易地预测趋势。 总而言之,利用这个指标,人们可以更快地做出决策,并最终领先行情。
The strategy is based on the DeMarker and MACD indicators. Positions are closed by Stop Loss and Take Profit or according to an opposite signal. To lock account profit or limit account loss, you can activate Target equity and/or Minimum equity in percentage of deposit at the settings. This EA is optimized for EURUSD M1, but you can use it for other instruments by performing optimization first. You can adjust important parameters by performing optimization periodically using "Every tick based on
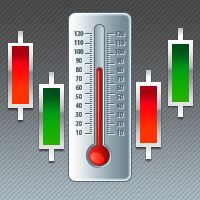
有的交易策略适合波动较小的、安静的行情,而有的策略适合波动较大、剧烈的行情。不管是哪种策略,交易者都应当对行情的冷热程度有清晰的量化标准。 本产品方便交易者对比不同交易品种的冷热程度,或者同一交易品种在不同时间段的交易热度。 你可以将它放在不同图表上,获得直观的感受。哪个品种热度更高,哪个交易更淡静,一目了然。 下方的颜色指示器显示瞬时的价格跳动情况,而左上角的数字显示的是一段时间内的温度累积均值。 。。。。。。。。。。。。。。。。。。。。。。。。。。。。。。。。。。。。。。。。。。。。。。。。。。。 .......................................................................................................