Yurij Izyumov / 个人资料
- 信息
|
10+ 年
经验
|
29
产品
|
199
演示版
|
|
12
工作
|
0
信号
|
0
订阅者
|
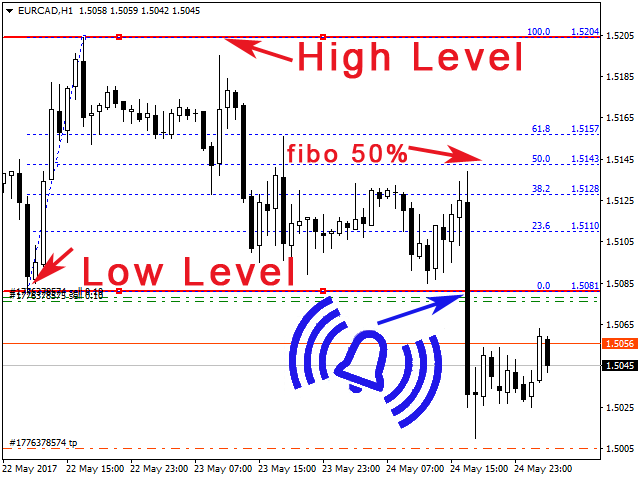
本指标用于绘制水平通道和信号区域,检测极值突破、反弹以及基于可自定义斐波那契水平的目标(可选声音提醒)。它会自动将您选择的斐波那契水平应用到这些极值上。当价格突破在设置中启用的斐波那契水平时,指标可播放声音、显示消息、向移动终端发送推送通知或发送电子邮件(若已启用)。 功能: 按时间范围自动构建通道,例如用于检测夜间区间的突破 自动跟踪新的反弹 反转斐波那契水平刻度 显示/隐藏/折叠控制面板 从 5 种面板界面语言中选择 为斐波那契水平添加容差,使其成为更宽的信号区域而非线条 在多个时间周期上绘制水平线和斐波那契,可保留或删除其他时间周期的通道 按 High/Low 或 Open/Close 价格构建通道;通道自动贴合价格 锁定通道(设为不可选)以防误删 设置 --------- 语言 ----------- Interface Language — 指标面板语言。English(英语)、Russian(俄语)、Spanish(西班牙语)、German(德语)、Italian(意大利语)。 --------- 设置 ----------- Auto build channel by
First RSI level indicator analyzes and displays the level, at which the first crossing of the standard RSI maximum or minimum value took place for the subsequent definition of strong trends. The indicator allows you to track the beginning of a trend that does not follow the signals of the standard RSI trading strategy, for example, when the price rushes downwards after reaching an oversold level instead of reversing. In this case, we have to conclude that a strong trend is underway and the next
The indicator is based on a single Moving Average of a user-defined period. By analyzing the price movement of the price relative to this MA, and also by tracking all updates of the price Highs and Lows over the same period as the MA period, the indicator draws its own picture of the trend, avoiding the ever-breaking MA lines. Therefore, if the trend goes up, the line will also point upwards and will not change its direction even on small retracements, allowing to capture almost the entire
This indicator has been created for finding the probable reversal points of the symbol price. A small candlestick reversal pattern is used it its operation in conjunction with a filter of extremums. The indicator is not redrawn! If the extremum filter is disabled, the indicator shows all points that have a pattern. If the extremum filter is enabled, the condition works – if the history Previous bars 1 candles back contains higher candles and they are farther than the Previous bars 2 candle, such
This is a multitimeframe RSI indicator defining trends, oversold/overbought zones, as well as all intersections of signal lines from different timeframes on a single chart using arrows and audio alerts. When working with standard RSI, we often need to examine data from all necessary timeframes simultaneously. RSI 7TF solves this issue. If you are only interested in audio signals when signal lines are crossed, then have a look at RSI Alerts . Attention! The indicator uses seven timeframes - M5