Young Ho Seo / 个人资料
- 信息
|
12+ 年
经验
|
62
产品
|
1207
演示版
|
|
4
工作
|
0
信号
|
0
订阅者
|
Harmonic Pattern Indicator - Repainting + Japanese Candlestick Pattern Scanner + Automatic Channel + Many more
https://www.mql5.com/en/market/product/4488
https://www.mql5.com/en/market/product/4475
https://algotrading-investment.com/portfolio-item/harmonic-pattern-plus/
Non Repainting and Non Lagging Harmonic Pattern Indicator – Customizable Harmonic + Japanese Candlestic Pattern Scanner + Advanced Channel + Many more
https://www.mql5.com/en/market/product/41993
https://www.mql5.com/en/market/product/41992
https://algotrading-investment.com/portfolio-item/profitable-pattern-scanner/
Supply Demand Indicator – Multiple Timeframe Scanning Added + Non Repainting + Professional Indicator
https://www.mql5.com/en/market/product/40076
https://www.mql5.com/en/market/product/40075
https://algotrading-investment.com/portfolio-item/ace-supply-demand-zone/
Momentum Indicator – Path to Volume Spread Analysis
https://www.mql5.com/en/market/product/30641
https://www.mql5.com/en/market/product/30621
https://algotrading-investment.com/portfolio-item/excessive-momentum-indicator/
Elliott Wave Indicator for the Power User
https://www.mql5.com/en/market/product/16479
https://www.mql5.com/en/market/product/16472
https://algotrading-investment.com/portfolio-item/elliott-wave-trend/
Forex Prediction - Turn Support and Resistance to the Advanced Strategy
https://www.mql5.com/en/market/product/49170
https://www.mql5.com/en/market/product/49169
https://algotrading-investment.com/portfolio-item/fractal-pattern-scanner/
MetaTrader 4 and MetaTrader 5 Product Page: https://www.mql5.com/en/users/financeengineer/seller#products
Free Forex Prediction with Fibonacci Analysis: https://algotrading-investment.com/2020/10/23/forex-prediction-with-fibonacci-analysis/
Free Harmonic Pattern Signal: https://algotrading-investment.com/2020/12/17/harmonic-pattern-signal-for-forex-market/
============================================================================================================================
Here are the trading education books. We recommend reading these books if you are a trader or investor in Forex and Stock market. In the list below, we put the easy to read book on top. Try to read the easy to read book first and try to read the harder book later to improve your trading and investment.
First Link = amazon.com, Second Link = Google Play Books, Third Link = algotrading-investment.com, Fourth Link = Google Books
Technical Analysis in Forex and Stock Market (Supply Demand Analysis and Support Resistance)
https://www.amazon.com/dp/B09L55ZK4Z
https://play.google.com/store/books/details?id=pHlMEAAAQBAJ
https://algotrading-investment.com/portfolio-item/technical-analysis-in-forex-and-stock-market/
https://books.google.co.kr/books/about?id=pHlMEAAAQBAJ
Science Of Support, Resistance, Fibonacci Analysis, Harmonic Pattern, Elliott Wave and X3 Chart Pattern (In Forex and Stock Market Trading)
https://www.amazon.com/dp/B0993WZGZD
https://play.google.com/store/books/details?id=MME3EAAAQBAJ
https://algotrading-investment.com/portfolio-item/science-of-support-resistance-fibonacci-analysis-harmonic-pattern/
https://books.google.co.kr/books/about?id=MME3EAAAQBAJ
Profitable Chart Patterns in Forex and Stock Market (Fibonacci Analysis, Harmonic Pattern, Elliott Wave, and X3 Chart Pattern)
https://www.amazon.com/dp/B0B2KZH87K
https://play.google.com/store/books/details?id=7KrQDwAAQBAJ
https://algotrading-investment.com/portfolio-item/profitable-chart-patterns-in-forex-and-stock-market/
https://books.google.com/books/about?id=7KrQDwAAQBAJ
Guide to Precision Harmonic Pattern Trading (Mastering Turning Point Strategy for Financial Trading)
https://www.amazon.com/dp/B01MRI5LY6
https://play.google.com/store/books/details?id=8SbMDwAAQBAJ
http://algotrading-investment.com/portfolio-item/guide-precision-harmonic-pattern-trading/
https://books.google.com/books/about?id=8SbMDwAAQBAJ
Scientific Guide to Price Action and Pattern Trading (Wisdom of Trend, Cycle, and Fractal Wave)
https://www.amazon.com/dp/B073T3ZMBR
https://play.google.com/store/books/details?id=5prUDwAAQBAJ
https://algotrading-investment.com/portfolio-item/scientific-guide-to-price-action-and-pattern-trading/
https://books.google.com/books/about?id=5prUDwAAQBAJ
Predicting Forex and Stock Market with Fractal Pattern: Science of Price and Time
https://www.amazon.com/dp/B086YKM8BW
https://play.google.com/store/books/details?id=VJjiDwAAQBAJ
https://algotrading-investment.com/portfolio-item/predicting-forex-and-stock-market-with-fractal-pattern/
https://books.google.com/books/about?id=VJjiDwAAQBAJ
Trading Education Book 1 in Korean (Apple, Google Play Book, Google Book, Scribd, Kobo)
https://books.apple.com/us/book/id1565534211
https://play.google.com/store/books/details?id=HTgqEAAAQBAJ
https://books.google.co.kr/books/about?id=HTgqEAAAQBAJ
https://www.scribd.com/book/505583892
https://www.kobo.com/ww/en/ebook/8J-Eg58EDzKwlpUmADdp2g
Trading Education Book 2 in Korean (Apple, Google Play Book, Google Book, Scribd, Kobo)
https://books.apple.com/us/book/id1597112108
https://play.google.com/store/books/details?id=shRQEAAAQBAJ
https://books.google.co.kr/books/about?id=shRQEAAAQBAJ
https://www.scribd.com/book/542068528
https://www.kobo.com/ww/en/ebook/X8SmJdYCtDasOfQ1LQpCtg
About Young Ho Seo
Young Ho Seo is an Engineer, Financial Trader, and Quantitative Developer, working on Trading Science and Investment Engineering since 2011. He is the creator of many technical indicators, price patterns and trading strategies used in the financial market. He is also teaching the trading practice on how to use the Supply Demand Analysis, Support, Resistance, Trend line, Fibonacci Analysis, Harmonic Pattern, Elliott Wave Theory, Chart Patterns, and Probability for Forex and Stock Market. His works include developing scientific trading principle and mathematical algorithm in the work of Benjamin Graham, Everette S. Gardner, Benoit Mandelbrot, Ralph Nelson Elliott, Harold M. Gartley, Richard Shabacker, William Delbert Gann, Richard Wyckoff and Richard Dennis. You can find his dedicated works on www.algotrading-investment.com . His life mission is to connect financial traders and scientific community for better understanding of this world and crowd behaviour in the financial market. He wrote many books and articles, which are helpful for understanding the technology and application behind technical analysis, statistics, time series forecasting, fractal science, econometrics, and artificial intelligence in the financial market.
If you are interested in our software and training, just visit our main website: www.algotrading-investment.com
Young Ho Seo
Pair Trading Signal News 31 May 2017
We have been reported few server connection error with our Pair Trading Signal.
We have now uploaded new version of our platform with the connection problem sorted. Download link is available on the same page.
http://algotrading-investment.com/pair-trading-signal/
Thanks for your supports and interest.
To visit our website, follow the links below:
http://algotrading-investment.com
https://www.mql5.com/en/users/financeengineer/seller#products
https://algotradinginvestment.wordpress.com/blog/
Kind regards.
分享社交网络 · 2
Young Ho Seo

Pair Trading Signal have been Released
Dear All, we have finally released our Pair Trading Signal service.
The service include free demo account which does not require any signing up process. Therefore, if anyone interested in then, please feel free to try.
Download link is placed in this page.
http://algotrading-investment.com/signal-service/

分享社交网络 · 1
Young Ho Seo
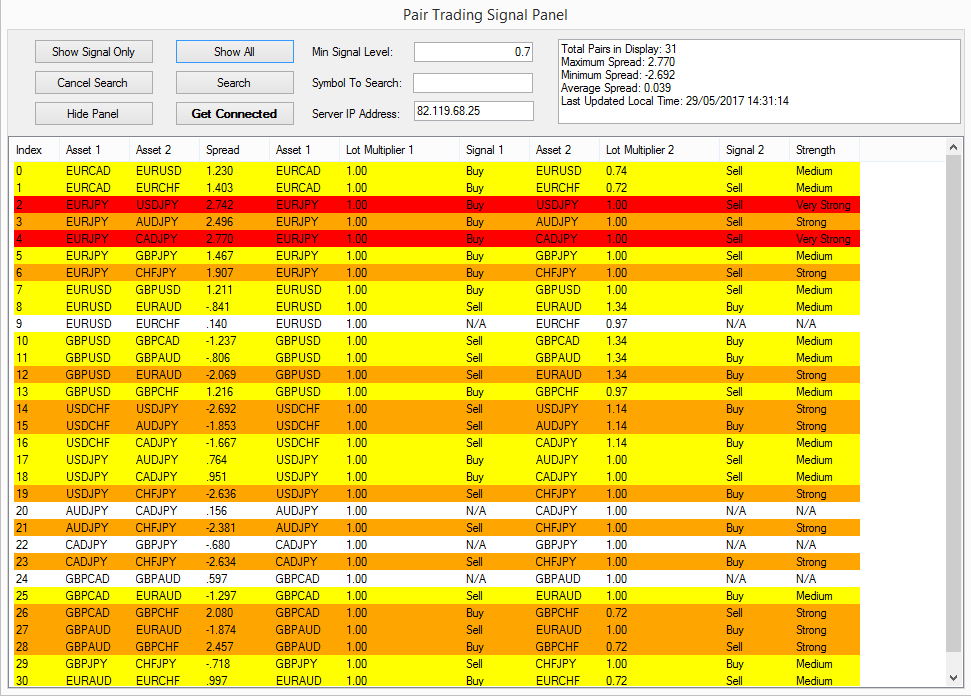
Pair Trading Signal Release Soon
We are about to release our Pair Trading Signal Release Soon through our website.
Stay tuned for furhter news. :)
To visit our website, follow the links below:
http://algotrading-investment.com
https://www.mql5.com/en/users/financeengineer/seller#products
https://algotradinginvestment.wordpress.com/blog/

分享社交网络 · 1
Young Ho Seo
EURUSD Market Outlook
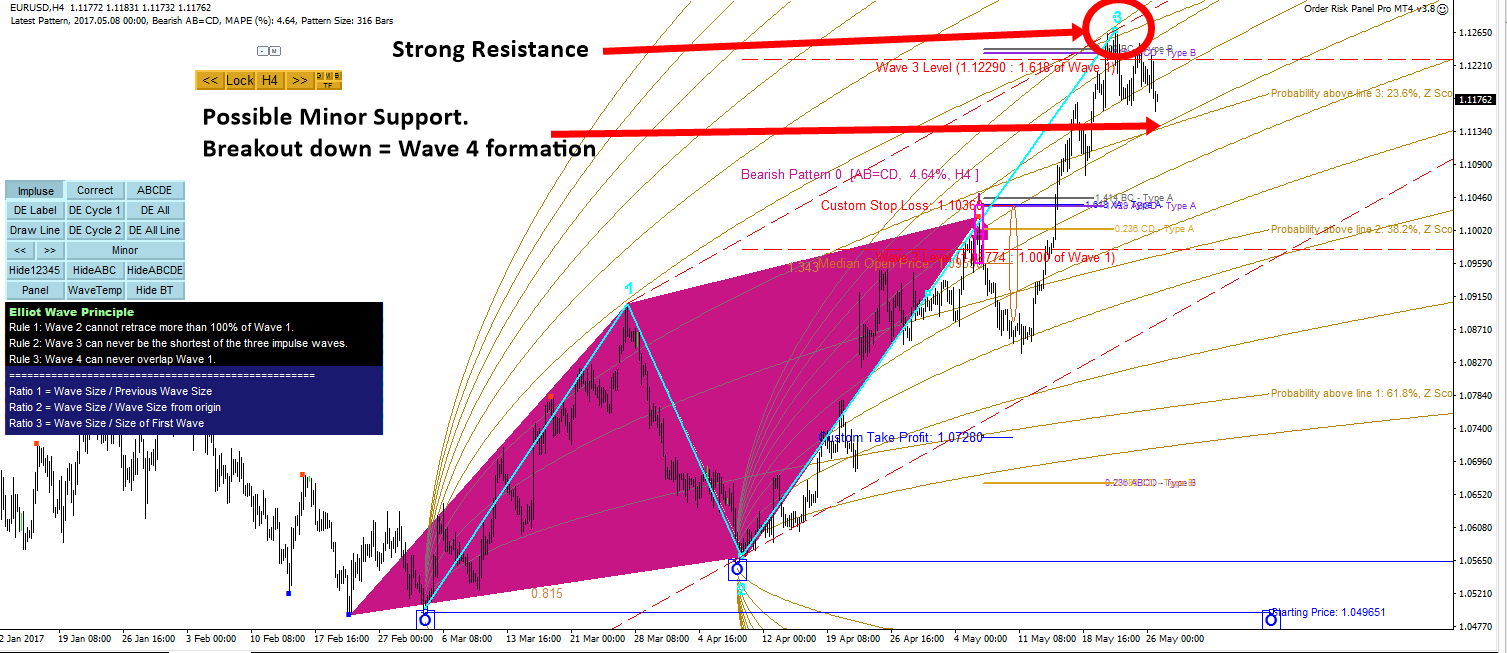
In regards to our last Market analysis on EURUSD, we are still seeing that EURUSD is moving down last few days.
We have some minor support indicated by the two cross lines of Harmonic Volatility Line indicator.
This level should be watched very carefully. If the level breaktout downwards then we are likely to have wave 4 formation. We have included some screenshots for your information.
Hope this analysis is helpful for your trading.
To visit our website, follow the links below:
http://algotrading-investment.com
https://www.mql5.com/en/users/financeengineer/seller#products
https://algotradinginvestment.wordpress.com/blog/

Young Ho Seo
Mean Reversion Supply Demand Update to Version 3.1
Finally we have our Mean Reversion Supply Demand Update to Version 3.1 in mql5.com
Make sure that you are downloading the latest version for your own goods.
https://www.mql5.com/en/market/product/16851
https://www.mql5.com/en/market/product/16823
How to update for traders bought our products from algotrading-investment.com
http://algotrading-investment.com/how-to-update-your-products/
How to update for traders bought our products from mql5.com
http://algotrading-investment.com/install-mt4mt5-products-purchased-mql5-com/

Young Ho Seo
Get in Touch with Service Desk with MQL5.com
When you have bought any products from MQL5.com including our products, then you might have some questions or inquiry for the installation of the products or payment processing or Meta Terminal, etc.
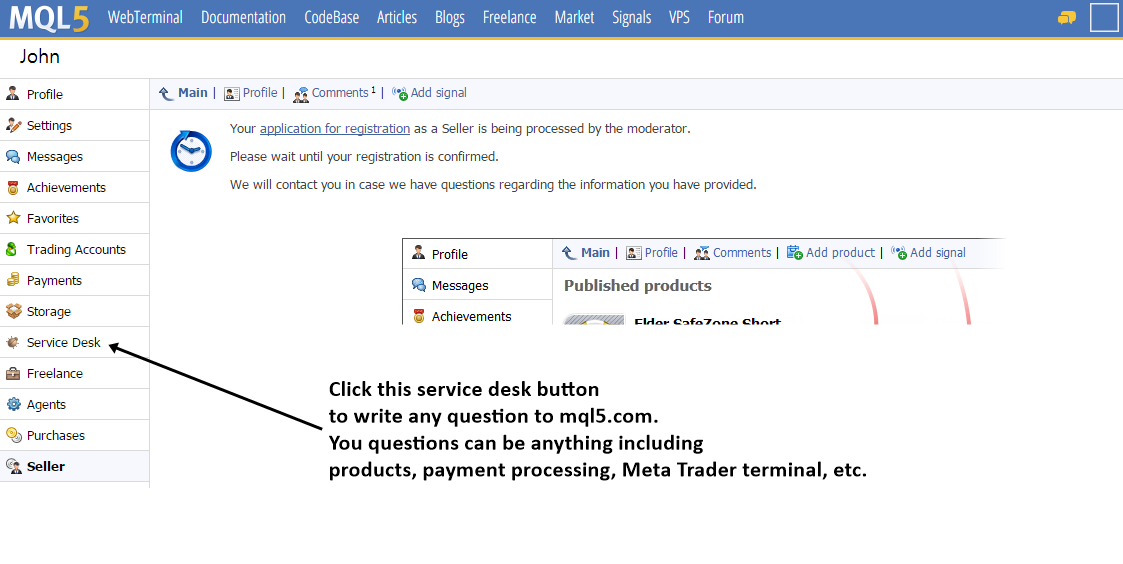
In such a case, MQL5.com ask you to contact them through Service Desk.
Service Desk can be accessed from your account page at MQL5.com.
Check the screenshot below. Note that this only applied to when you have bought from through mql5.com directly.
If you bought our products from algotrading-investment.com, then send us email at customer.support@algotrading-investment.com. We are here to assist you any time.
Kind regards.
http://algotrading-investment.com
https://www.mql5.com/en/users/financeengineer/seller#products

分享社交网络 · 1
Young Ho Seo
Mean Reversion Supply Demand Update to version 3.1
Mql5.com is still processing the version 3.1 of Mean Reversion Supply Demand
https://www.mql5.com/en/market/product/16851
https://www.mql5.com/en/market/product/16823
Please stay tuned. We will let you know when the version 3.1 is ready for your download on mql5.com.
For your information, all our update for MT4/MT5 products are free of charge.
Here are how to download new update
http://algotrading-investment.com/how-to-update-your-products/
http://algotrading-investment.com/customers-mql5-com/
Kind regards.

Young Ho Seo
Market Outlook for EURUSD
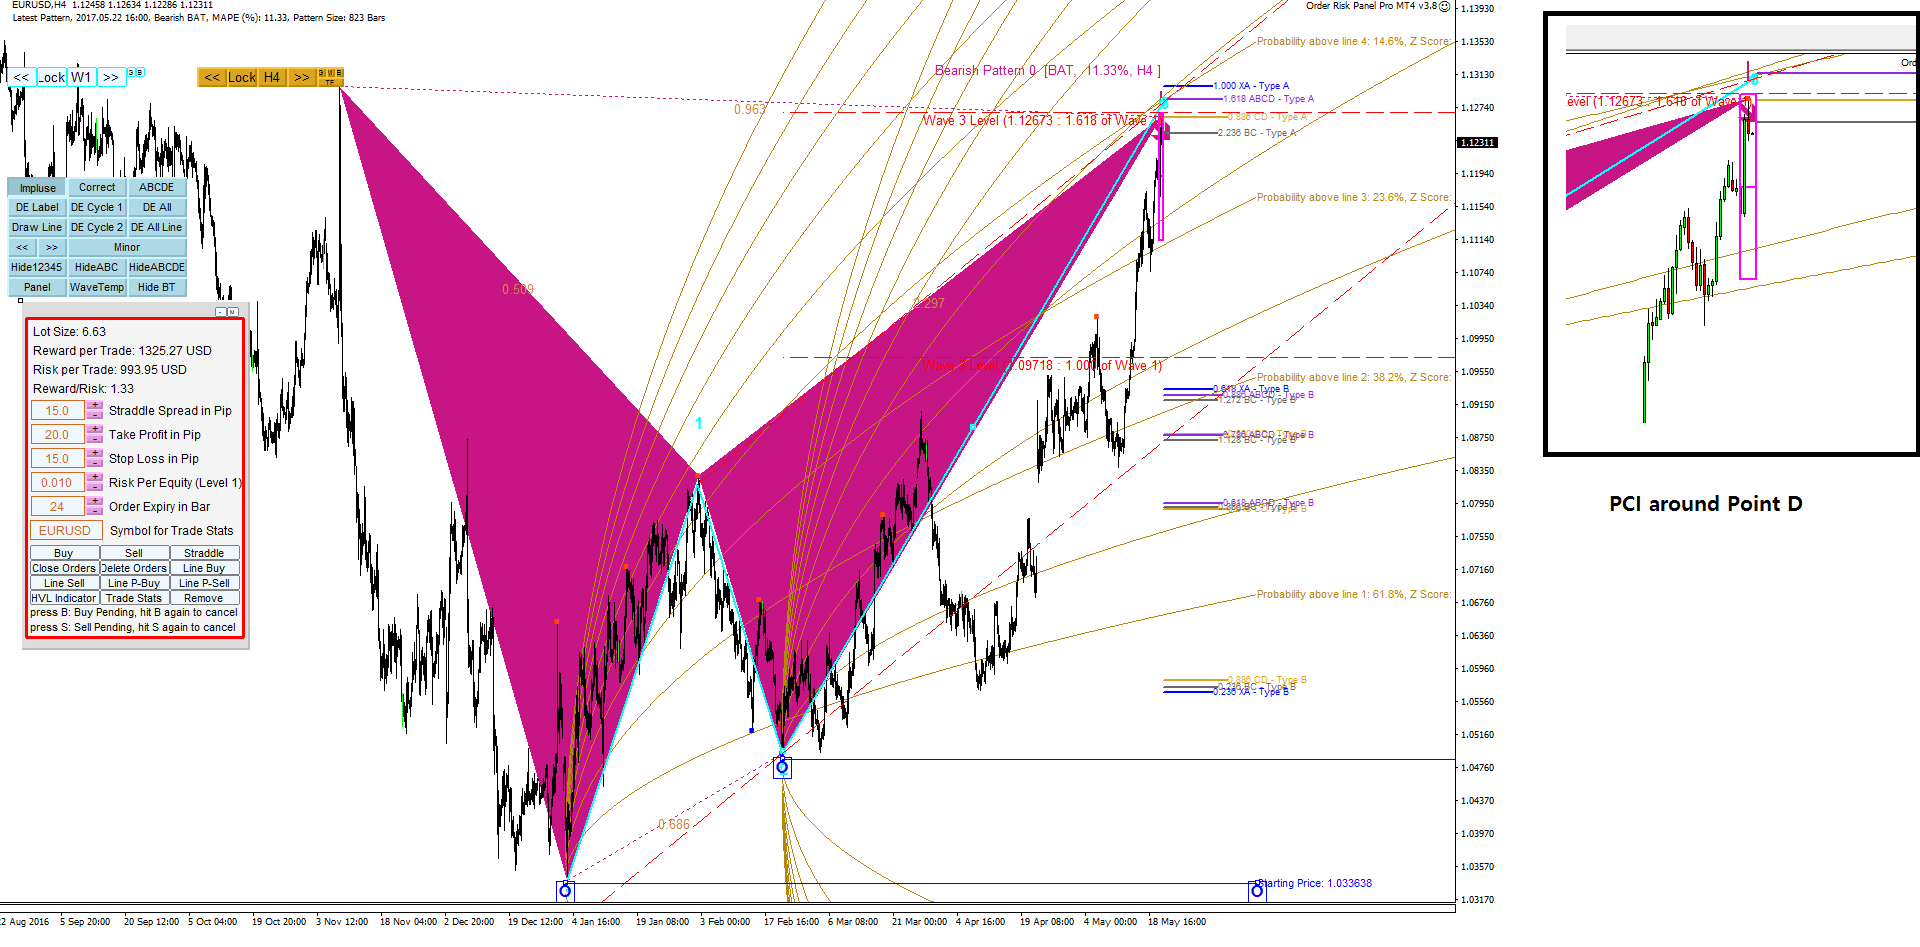
We have quite interesting movement in EURUSD.
Currently 1.618 level of Elliot Wave 3 is overlapping with Harmonic patterns entry together.
We still think this is crucial moment to watch out for EURUSD.
In addition, Harmonic Volatility Line indicator offer the cross lines around the PCI box which will act as another strong resistance.
What is even more interesting is that it is well above the median open price inside Pattern Completion Interval. This indicates that there are definitely some rooms to play by retail traders.
The question is now when the wave 3 is likely end and enter to Wave 4.
To visit our website, follow the links below:
http://algotrading-investment.com
https://www.mql5.com/en/users/financeengineer/seller#products
https://algotradinginvestment.wordpress.com/blog/

分享社交网络 · 2
Young Ho Seo

Elliott Wave Trend Version 8.1 Complete Update
Update process was completed for Elliott Wave Trend version 8.1.
Therefore you can download version 8.1 from both mql5.com and http://algotrading-investment.com/
https://www.mql5.com/en/market/product/16479
https://www.mql5.com/en/market/product/16472
Check the screenshot below for what is changed in version 8.1.

分享社交网络 · 1
Young Ho Seo
Update to Order Risk Panel Pro Version 3.8
Complete update is available for our Order Risk Panel Pro Version 3.8.
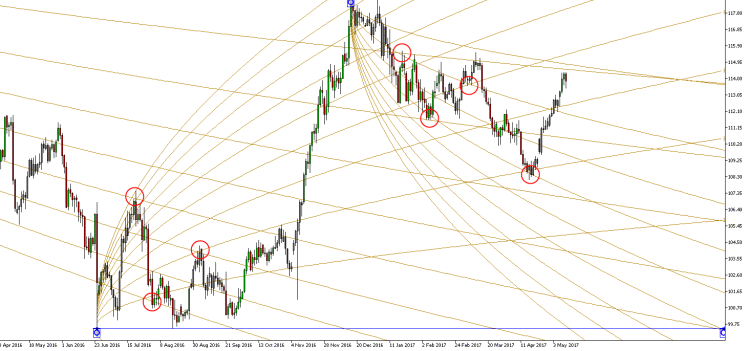
Meet the powerful Harmonic Volatility Line Indicator only in our Order Risk Panel Pro.
Here is the eBook about Harmonic Volatility Line Indicator
https://www.smashwords.com/books/view/724049
https://www.mql5.com/en/market/product/22058
https://www.mql5.com/en/market/product/22045
http://algotrading-investment.com/

分享社交网络 · 1
Young Ho Seo
New Update to Mean Reversion Supply Demand version 3.1
We have added another powerful feature to our Mean Reversion supply Demand.
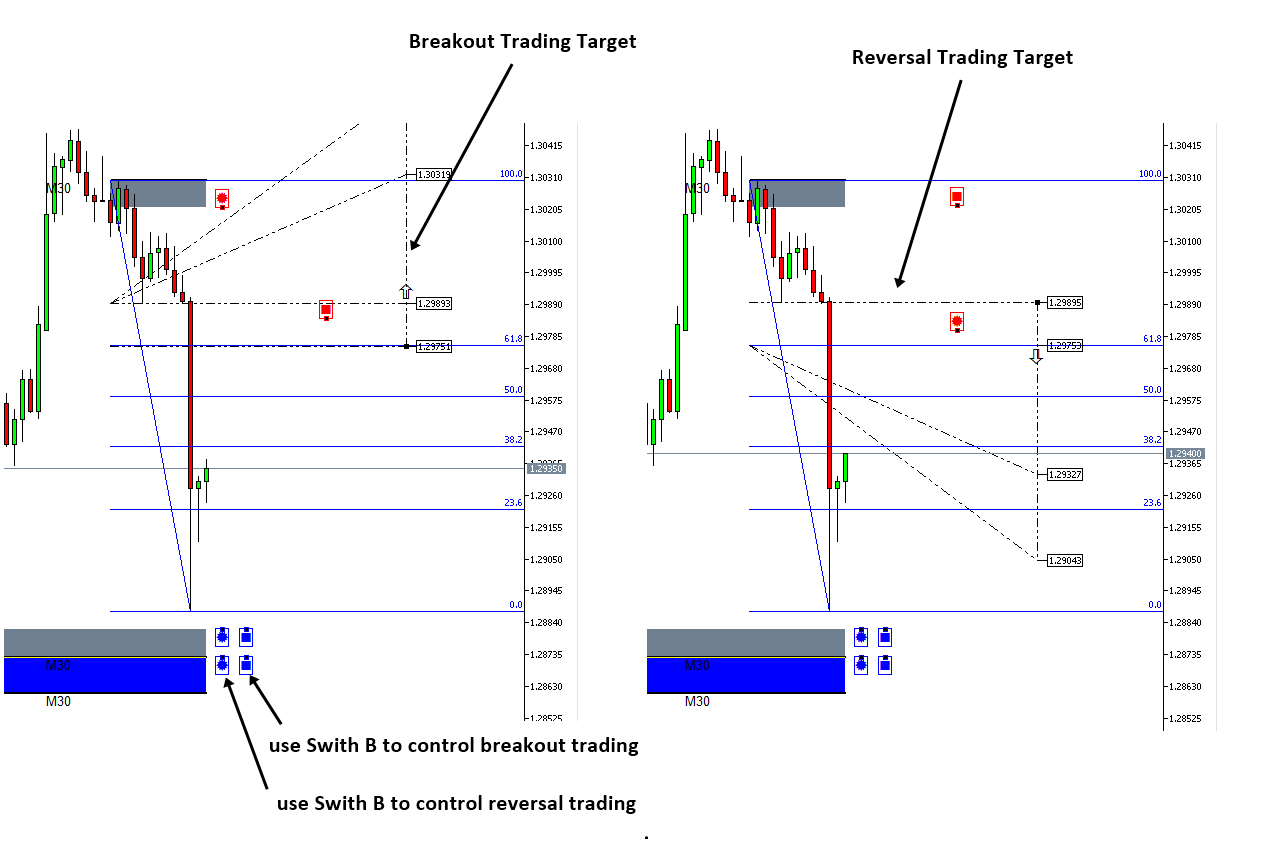
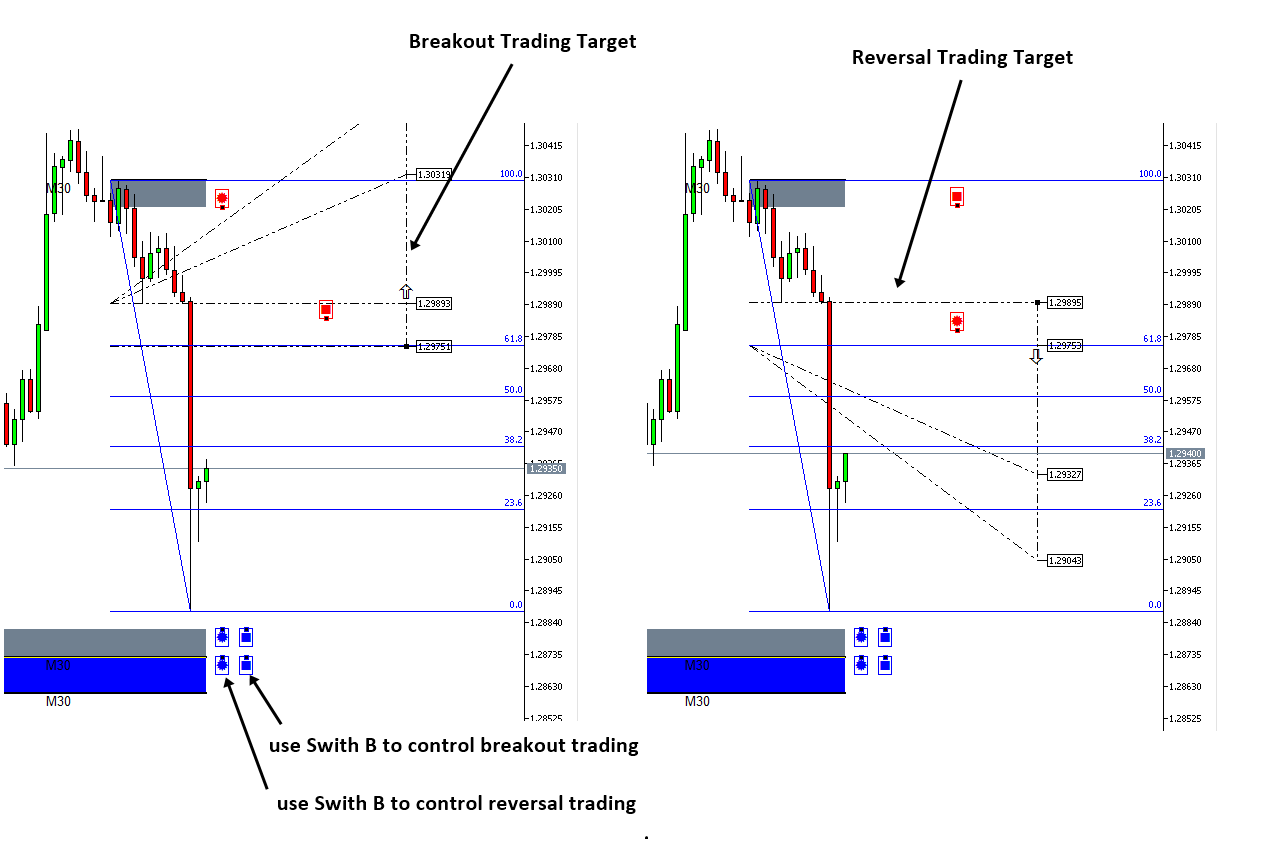
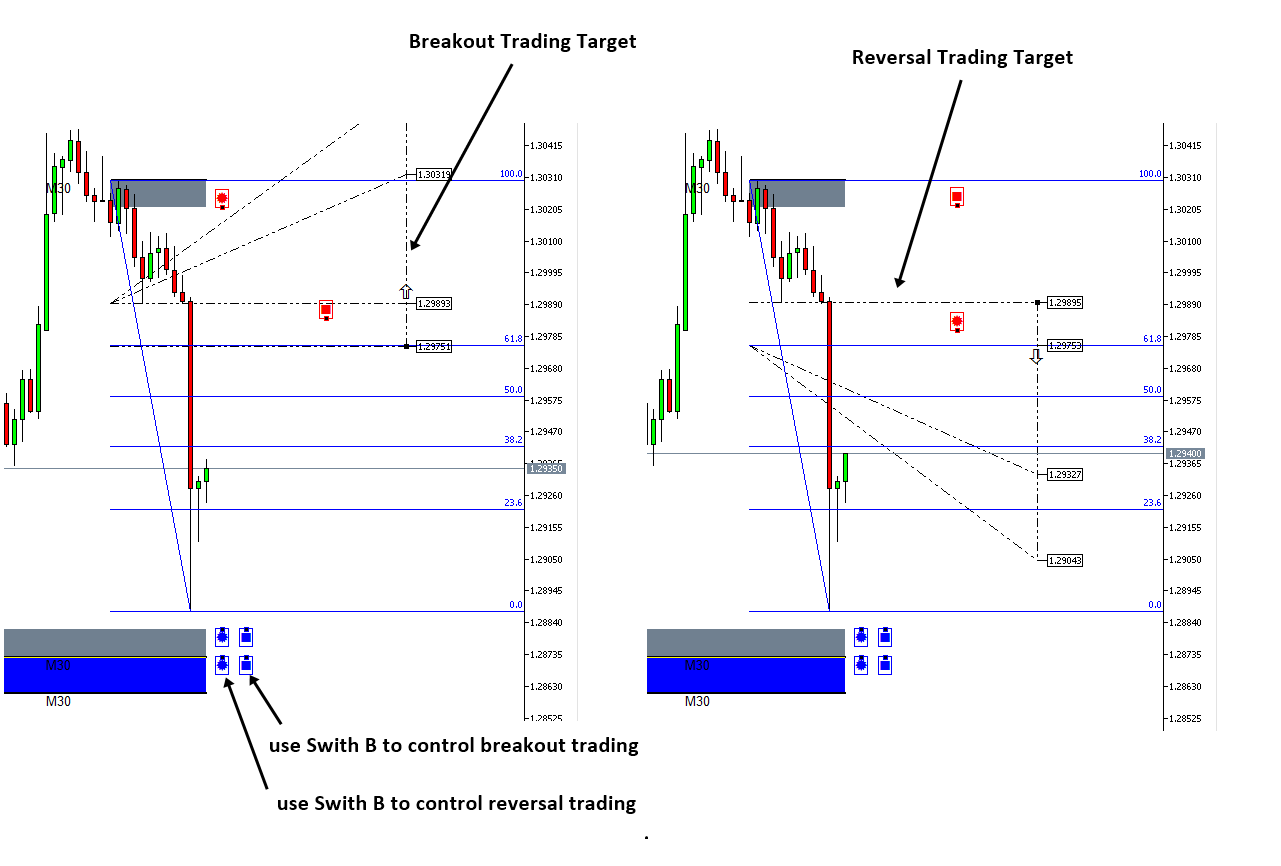
In version 3.1, we have added switch to control breakout trading. Therefore, with our Mean Reversion Supply Demand you can trade both reversal and breakout strategy using Supply Demand Zone concept.
The update is already available from our website: http://algotrading-investment.com
From mql5.com, it is in the processing stage.
https://www.mql5.com/en/market/product/16851
https://www.mql5.com/en/market/product/16823
To understand better, please check the screenshot below.
For your information, all our update for MT4 and MT5 products are free of charge.

分享社交网络 · 1
Young Ho Seo
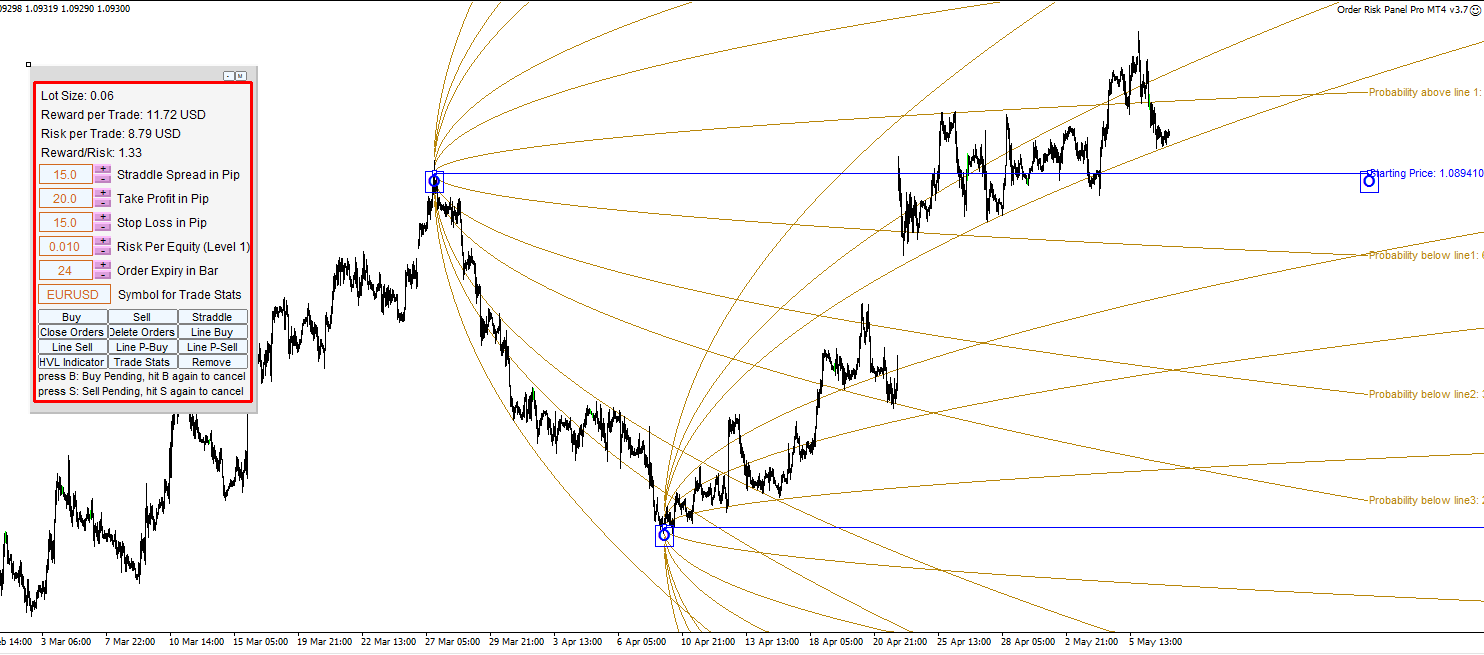
Order Risk Panel Pro Version 3.8 updated
As we have mentioned before, we have added powerful feature to our Order Risk Panel Pro version 3.8.
In version 3.8, order Risk Panel Pro provide you visual trading & risk Management, Harmonic Volatility Line indicator and Trading performance measurement.
You will get all these three powerful feature for the price of one.
http://algotrading-investment.com/2017/05/12/harmonic-volatility-indicator/
https://www.mql5.com/en/market/product/22045
https://www.mql5.com/en/market/product/22058

分享社交网络 · 1
Young Ho Seo
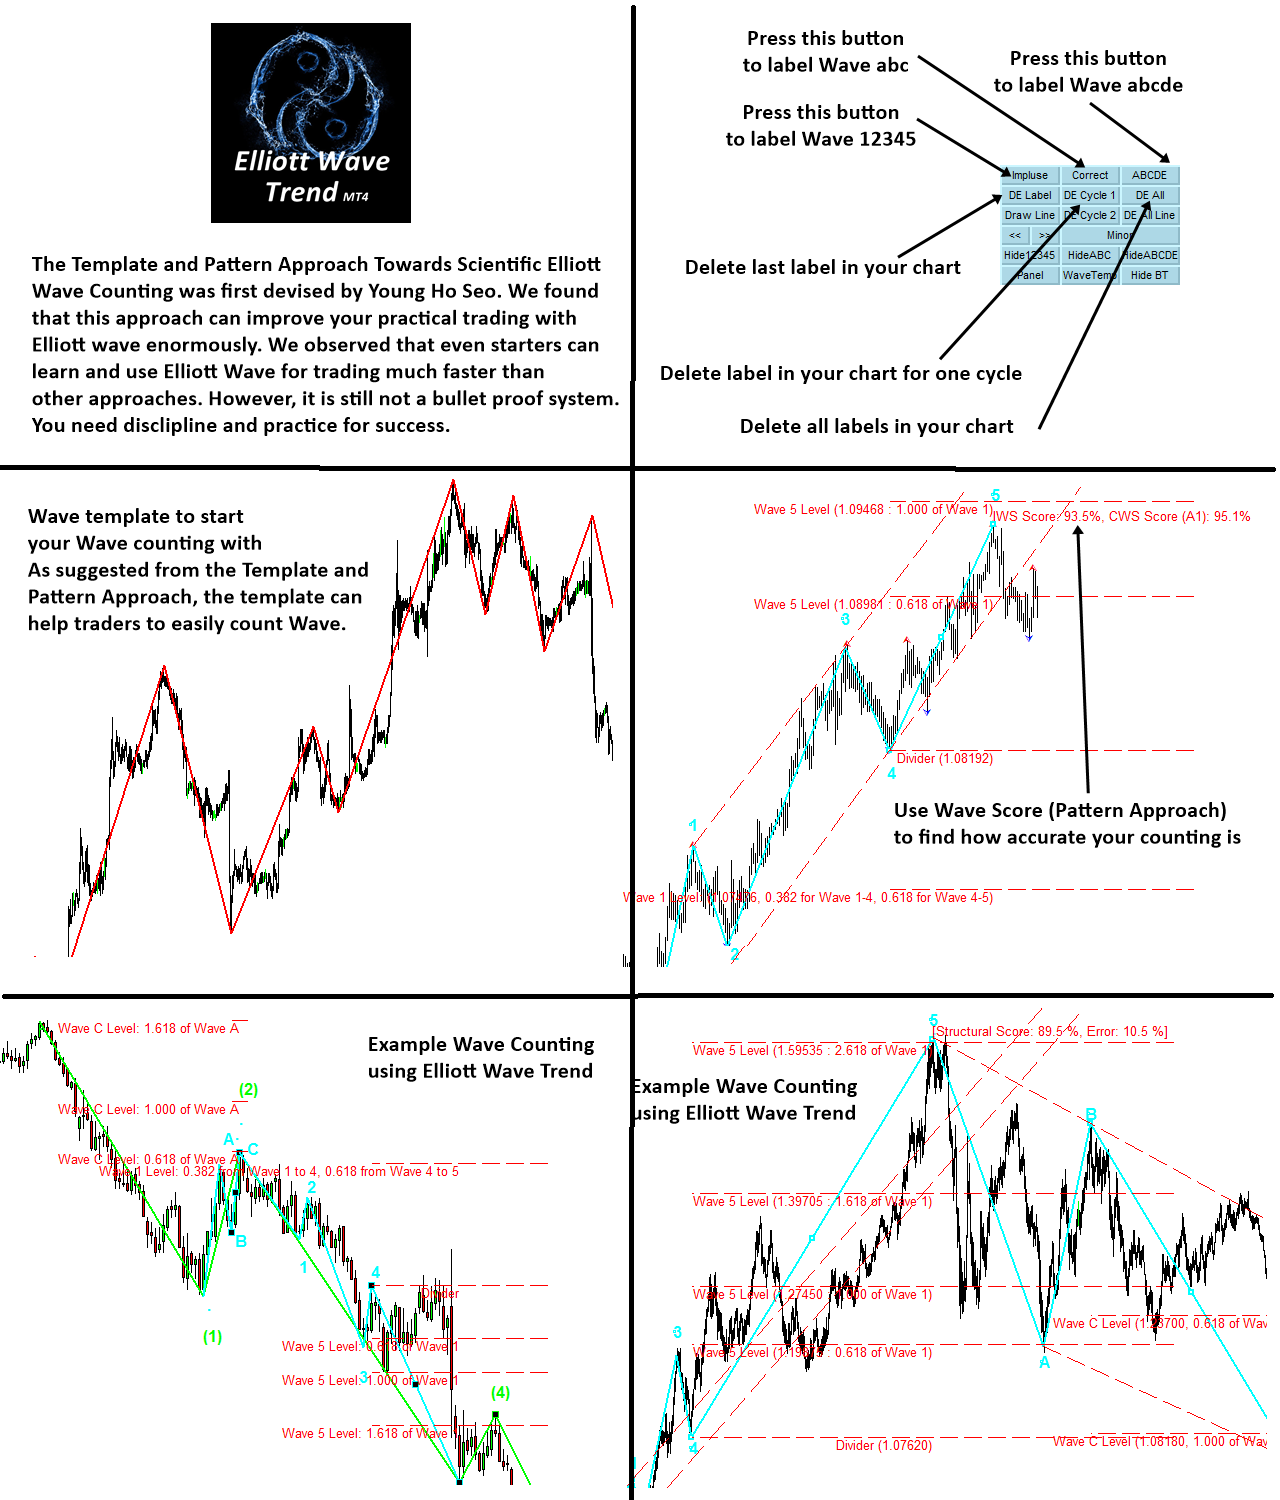
Small Update in our Elliott Wave Trend
We have made a minor change in our Elliott Wave Trend in version 8.1.
In Version 8.1, we have made a really small change. In version 8.0 we have omitted Wave template feature for some reason. Now we have put the wave template feature again in our version 8.1. Really minor change and it may not affect most of traders.
Check our latest screenshot from our Elliott Wave Trend.
For your information, version 8.1 is already available to download from our website :
http://algotrading-investment.com/
From mql5.com, it is in processing stage.
https://www.mql5.com/en/market/product/16479
https://www.mql5.com/en/market/product/16472
So wait for sometime.
Kind regards.

分享社交网络 · 2
Young Ho Seo
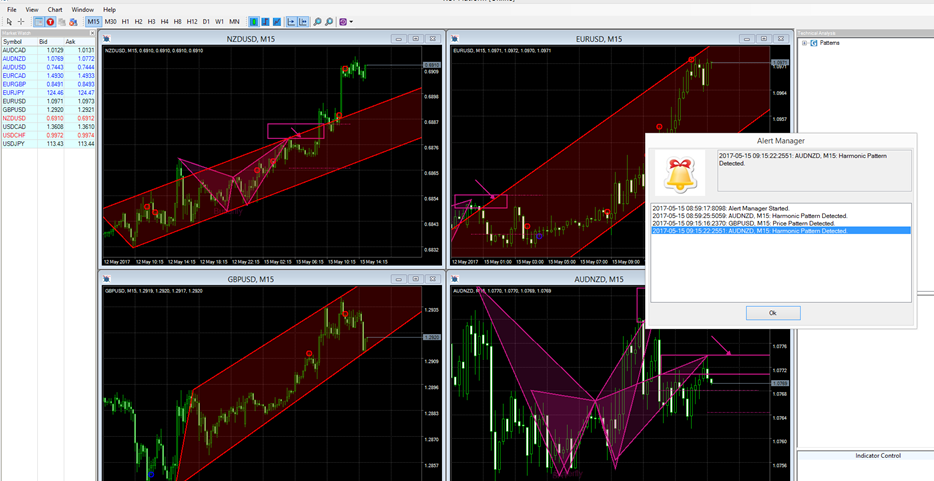
Professional Signal Providing Platform for Mega Profits
If you are a Professional Trader, Prop Trading Firm, Commodity Trading Advisor or even businessman, you can expand your trading business with our dedicated Signal Providing Platform for Forex market. If you have an excellent trading system and you want to offer your signal service to literarily numerous traders in the world, here we provide just right solution with the dedicated Signal Providing Platform.
Please read more about this mega opportunity here.
http://algotrading-investment.com/dedicated-signal-trading-platform/
http://algotrading-investment.com

分享社交网络 · 1
Young Ho Seo
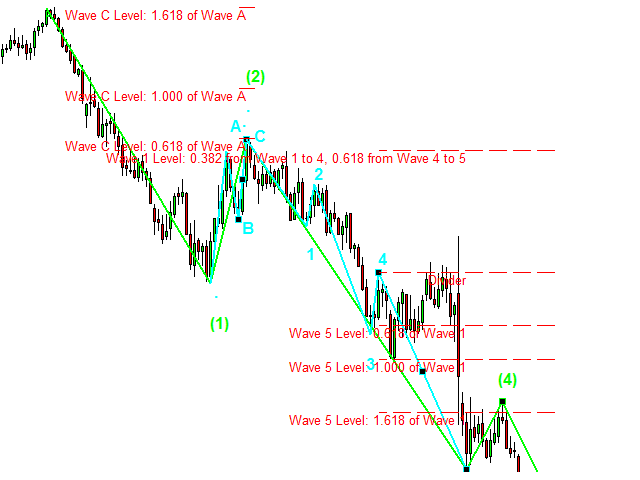
Free Tool Section
Now we have a free tool section. For now, few tools only. We will expand more in the future.
http://algotrading-investment.com/free-download/
Especially, Use peak trough analysis tool to go with Elliott Wave counting.
This is totally free but powerful tool to assist your Elliott wave trading.
The download link can be found in our website. Also we have little description for each tool too.
https://www.mql5.com/en/market/product/16479
https://www.mql5.com/en/market/product/16472

分享社交网络 · 1
Young Ho Seo
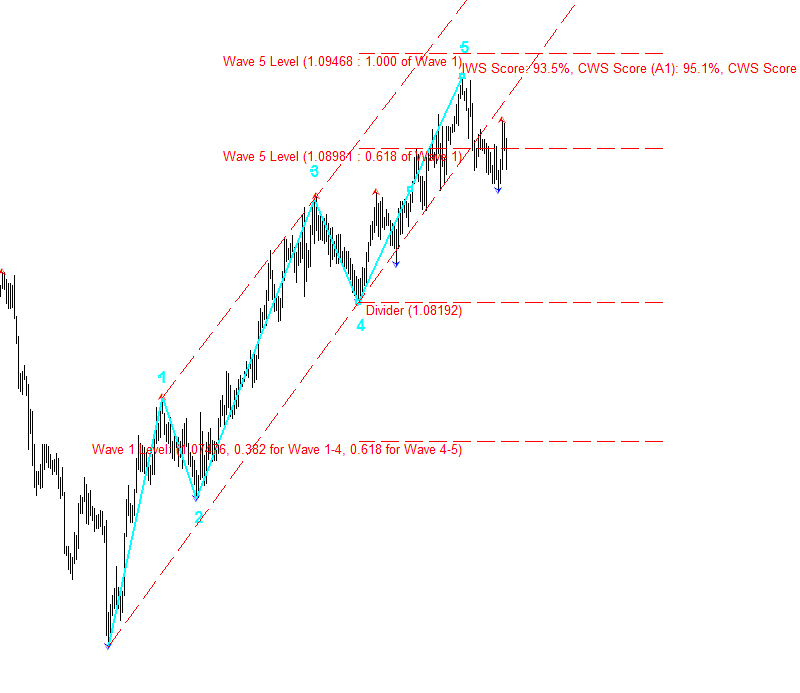
Elliott Wave Trend Version 8.0 is available through mql5.com.
Please download the latest version
Meet the most powerful Elliott Wave Trading products.
New powerful feature added to version 8.0.
In version 8.0, you can label ABCDE wave pattern. The automatic feature involves drawing the ABCDE envelop line for your own convenience.
Please download the latest version for your own goods.
https://www.mql5.com/en/market/product/16479
https://www.mql5.com/en/market/product/16472
http://algotrading-investment.com
Kind regards.

分享社交网络 · 1
Young Ho Seo
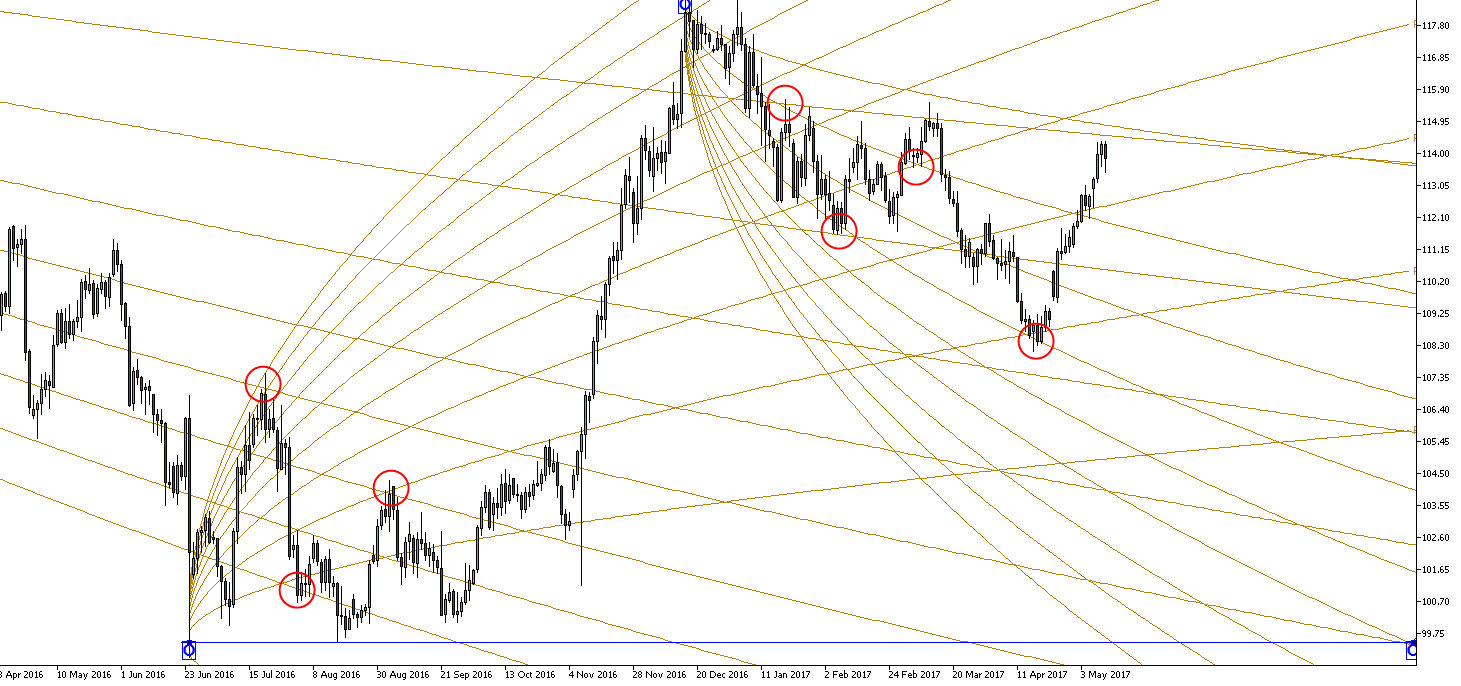
New Free Ebook is available for Harmonic Volatility Line Indicator
The Harmonic Volatility Line indicator is good alternative to Gann’s Angle because it does not suffer from the chart scaling Issue. At the same time, it provides the functionality similar to Gann’s angle. Trader can apply The Harmonic Volatility Line indicator to anywhere in your chart just like applying Gann’s Angle. Harmonic Volatility Line indicator can be used for three different purpose including market forecasting, turning point prediction, supports and resistances. The detailed description about the Harmonic Volatility Line indicator can be found from the free pdf eBook: http://algotrading-investment.com/2017/05/12/harmonic-volatility-indicator/
http://algotrading-investment.com/portfolio-item/order-risk-panel-pro/
https://www.mql5.com/en/market/product/22045
https://www.mql5.com/en/market/product/22058

分享社交网络 · 1
Young Ho Seo
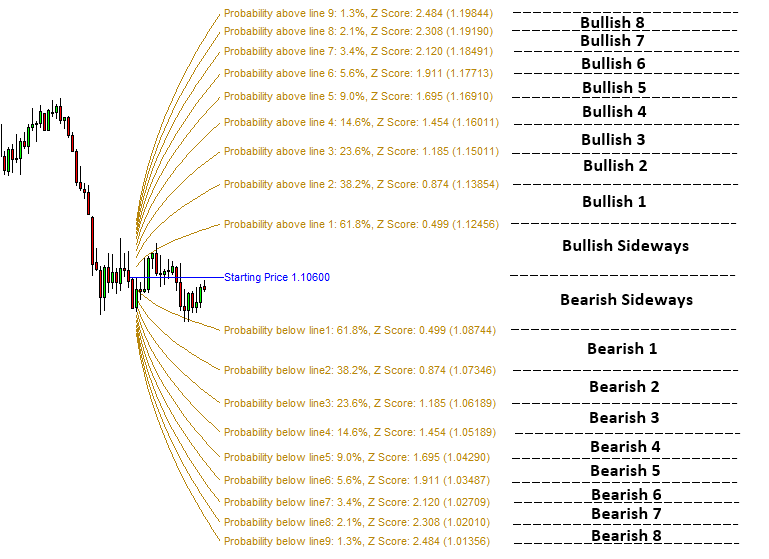
New Ebook is coming soon
We are currently writing short eBook to describe our discovery with Harmonic Volatility Line indicator. As we have mentioned before Harmonic Volatility Line indicator is a powerful trading tool comparable to Gann's angle. But it adds more values for your trading I guess.
Yet, it overcome the weakness of Gann's angle. You can use it for marketing forecasting, support and resistances and turning points predictions. Plus many other purpose.
Our Harmonic Volatility Line indicator will be shipped only on Order Risk panel Pro.
https://www.mql5.com/en/market/product/22045
https://www.mql5.com/en/market/product/22058
http://algotrading-investment.com/

分享社交网络 · 2
Young Ho Seo
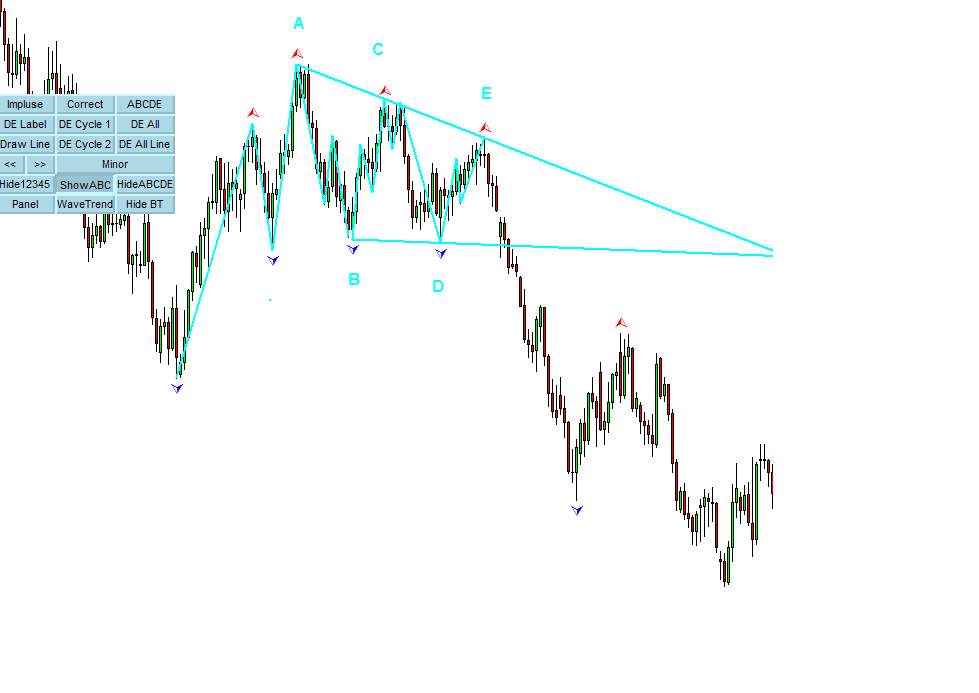
Update new on Elliott Wave Trend version 8.0
Great news. Finally mql5.com released version 8.0 of our Elliott Wave Trend.
Meet the most powerful Elliott wave counting tool.
https://www.mql5.com/en/market/product/16472
https://www.mql5.com/en/market/product/16479
More automation is added to version 8.0 for your efficient trading decision.
http://algotrading-investment.com/

分享社交网络 · 1
Young Ho Seo
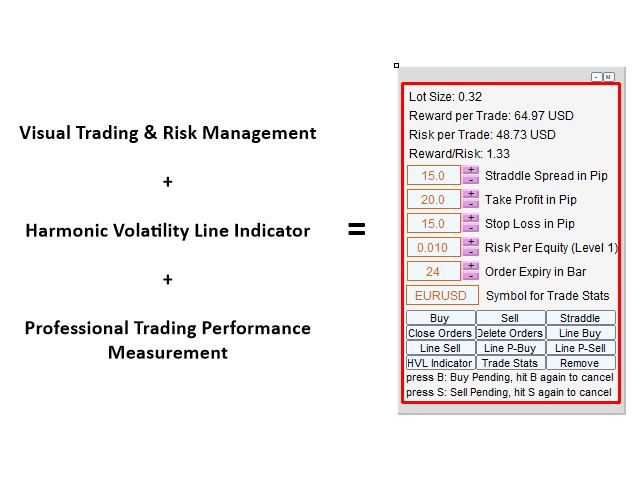
New Screenshots for Order Risk Panel Pro is available
New screenshots for Order Risk Panel Pro is available.
http://algotrading-investment.com/portfolio-item/order-risk-panel-pro/
Please download the latest version 3.7 for your own benefits.
All our update for MT4/MT5 products are free of charge.
Here is how.
http://algotrading-investment.com/how-to-update-your-products/

分享社交网络 · 1
: