Average Entry Price Lines
- 指标
- 版本: 1.10

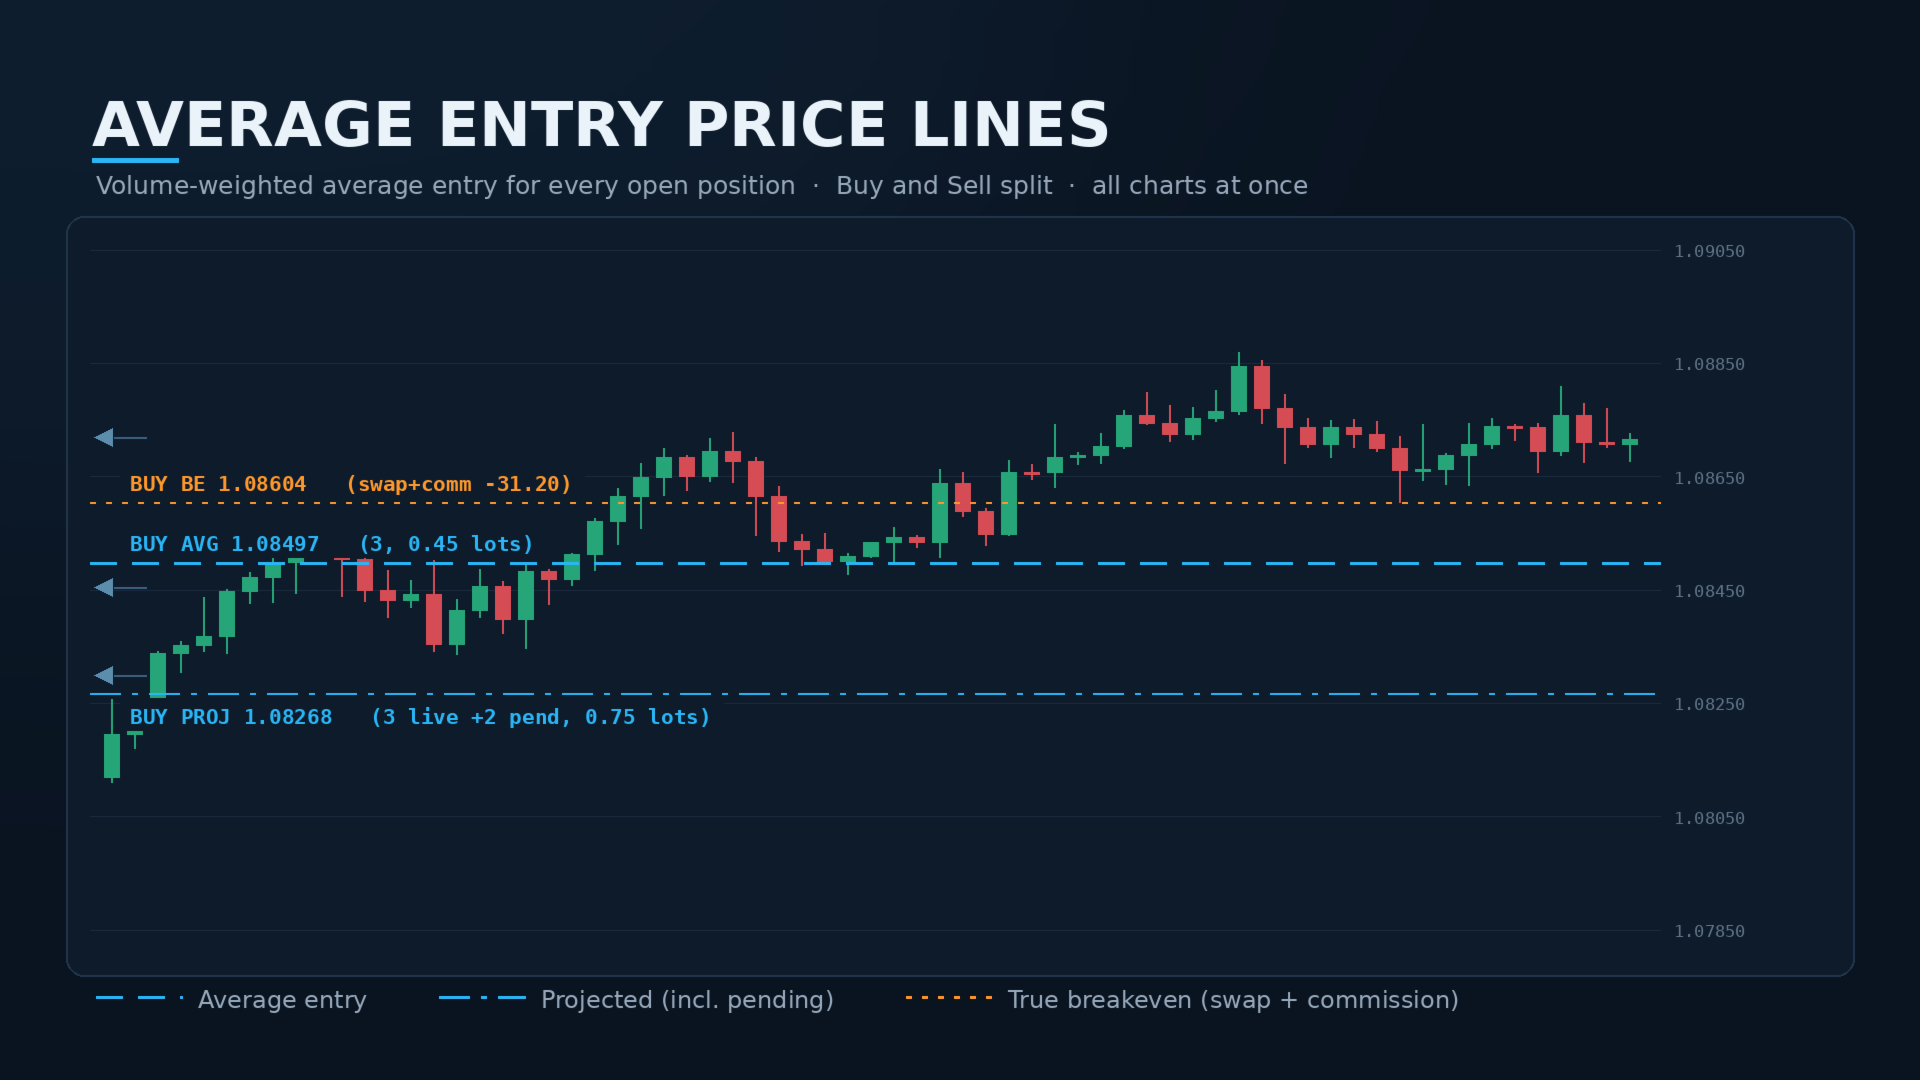
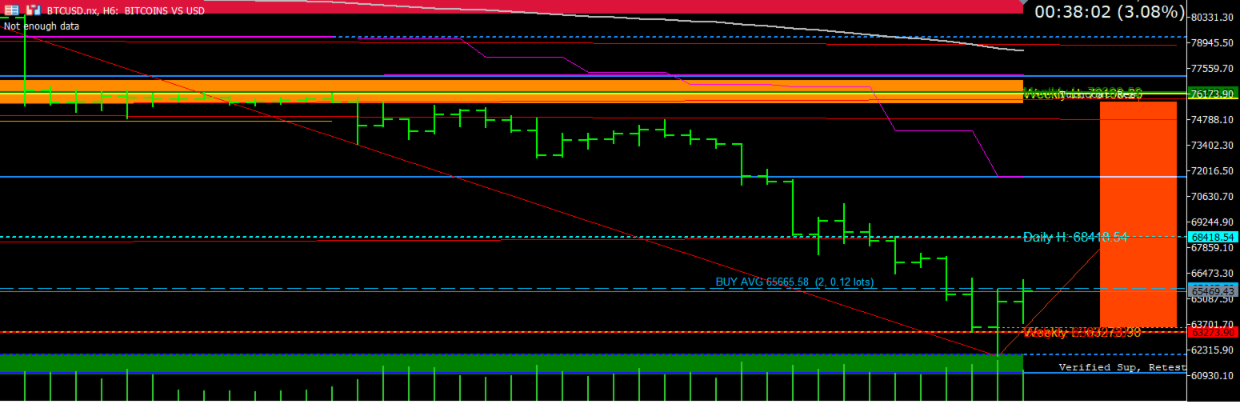
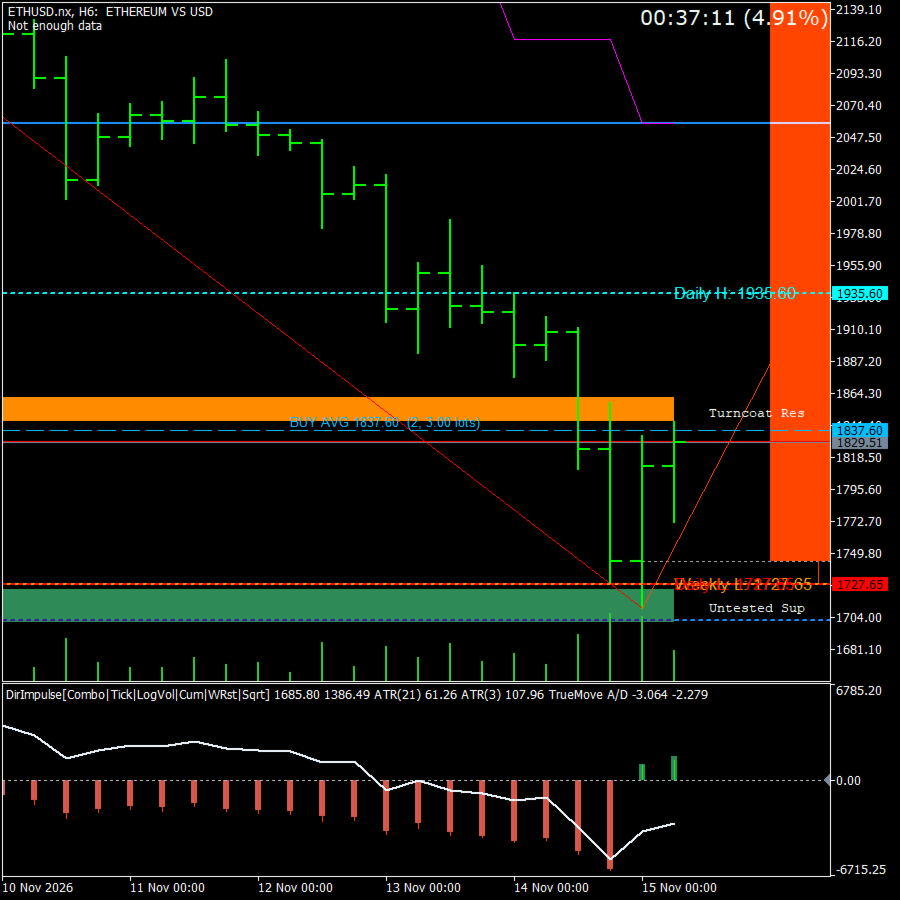
Average Entry Price Lines draws one horizontal line at the volume-weighted average entry price of your open positions, with Buy and Sell calculated separately. When you are scaled into a position across several tickets, that single line tells you where the whole basket actually sits.
With one position, the average collapses to that position's own entry, so the line lands exactly on it.
What it draws
- Volume-weighted average entry per direction: avg = SUM(entry x lots) / SUM(lots)
- Optional projected line that blends pending orders into the same average, so you can see where your basket would sit if those orders fill. Drag a pending order on the chart and the line follows it.
- Optional true-breakeven line that folds in accrued swap and commission — the price at which the basket actually nets zero, not just where you entered.
Key features
- Buy and Sell averaged independently, each with its own line and label
- Three modes: live positions only, live blended with pending, or both drawn as separate lines for direct comparison
- Global control — attach it to one chart and it draws on every open chart, each showing the averages for its own symbol. No need to load it chart by chart.
- Correct handling of Buy Stop Limit and Sell Stop Limit orders, which use the stop-limit price the position will actually open at rather than the trigger price
- Magic number filter for isolating one strategy's positions
- Configurable line style, width, colour and label position
- Lines are locked and hidden from the object list, so they cannot be dragged by accident and will not clutter your chart objects
- Works on any symbol and any timeframe; hedging and netting accounts
Read-only by design
This indicator never places, modifies or closes an order. It reads your account and draws. It does not interfere with any Expert Advisor running alongside it.
Notes on accuracy
- The average line is a price average. The separate breakeven line is what folds in costs.
- Breakeven is calculated from live positions only — a pending order has accrued no swap and paid no commission, so it has nothing to contribute.
- Some brokers report commission on the entry deal rather than on the position. The indicator reads both. If your broker reports neither, the breakeven line reflects swap only. Verify it once against your own position figures before relying on it.
Inputs
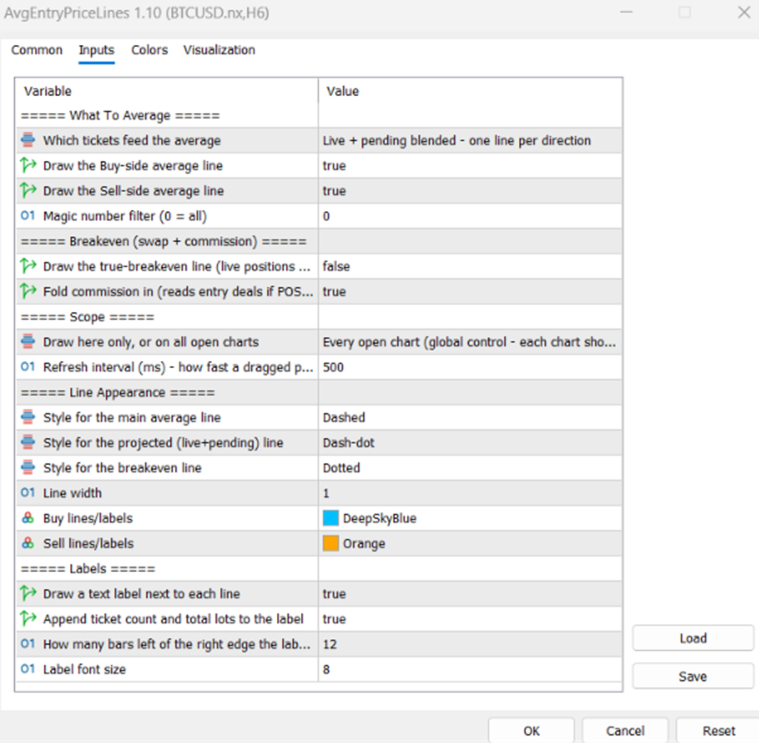
- AvgMode — live only / live + pending blended / both as separate lines
- ShowBuyAverage, ShowSellAverage — per-direction toggles
- MagicNumber — filter to one strategy (0 = all positions)
- ShowBreakeven — draw the swap and commission adjusted breakeven line
- BreakevenIncludeCommission — read commission from entry deals when the position field is empty
- DrawScope — this chart only, or every open chart
- RefreshMillis — how quickly a dragged pending order updates the line
- Line style, width and colour per line type
- Label visibility, position and font size
3. Other key details for the listing form
Suggested tags / keywords average price, average entry, breakeven, position averaging, grid, DCA, scale in, basket, multi chart, panel, money management, hedging
Short pitch (for the product subtitle / first line of search results)
One line showing where your whole basket actually sits — volume-weighted average entry for Buy and Sell, across every chart.
Who it is for Traders who scale into positions: grid and DCA systems, basket trading, partial entries, and anyone running a hedging account where several tickets on one symbol need to be read as a single exposure.
Compatibility
- MetaTrader 5 only (uses MQL5 position and order APIs; not portable to MT4)
- Any symbol, any timeframe
- Hedging and netting accounts
- No DLL imports, no external dependencies, no internet access required