Charts247 Wave Master MTF MT5

Charts247 Wave Master MTF MT5


A complete 0-5 wave count with a built-in rules panel: it reads both directions on your chart and on a higher timeframe, grades every wave, maps the major structure and marks where price spent the most time. Closed candles only.
Most wave tools leave you with numbers on a chart and the hard part still to do: is this wave worth trading, which side has the trend, and does the bigger timeframe agree? Wave Master MTF answers all three on one screen.
It runs the Waves of Success 0-5 count on every closed candle, for sells and buys at the same time, measures each wave against the one before, and turns the result into a plain instruction for each side: BUY, SELL, WAIT, NO TRADE or WAVE 5. The same count runs on a higher timeframe, so you see straight away whether both timeframes point the same way.
Most wave tools leave you with numbers on a chart and the hard part still to do: is this wave worth trading, which side has the trend, and does the bigger timeframe agree? Wave Master MTF answers all three on one screen.

It runs the Waves of Success 0-5 count on every closed candle, for sells and buys at the same time, measures each wave against the one before, and turns the result into a plain instruction for each side: BUY, SELL, WAIT, NO TRADE or WAVE 5. The same count runs on a higher timeframe, so you see straight away whether both timeframes point the same way.


The wave count
• Two counts at once: a SELL count (wave 0 at a high, red) and a BUY count (wave 0 at a low, green), each from 0 to 5.
• Rule-based, not hand-drawn: every wave is set by a fixed test on closed candles, so two traders with the same settings see the same count.
• Every wave is named on the chart: Short, I (Buy Rev), II (Sell Trend), III (Buy Rev), IV (Sell Trend), V (Stop Sell), and the mirror for buys. The words are inputs, so you can use your own.

• Finished 0-5 counts stay on the chart in dimmer colours, so you can study how past waves played out.


Wave ratios and grades
• Wave 2 as a % of wave 1, wave 3 as a multiple of wave 1, wave 4 as a % of wave 3, printed beside each wave.
• Every count graded: WEAK, OK, PRIME or EXT (extended third wave), with A+ for the strongest shape.
• Wave 4 placed in band A (shallow), band B or a 0-3 check, and flagged NO TRADE when the correction is deep enough to say the trend is losing strength.

• All grade limits are inputs.


The rules panel
The panel applies four simple rules to the live counts and tells you where each side stands:
1. A wave 5 means that trend has run its course: no new entries that way.
2. With the trend that just finished, re-enter at the next wave 2 or wave 4 of the same colour.
3. That re-entry holds only until the other colour prints a wave 3.
4. Against the trend that just finished, never at wave 2: wait for wave 4.

For each side you get a clear status (BUY, SELL, WAIT, NO, W5) with the reason underneath, for example "SELL - red 4: with the trend, W4 38%, grade A+ PRIME (A)". The panel also shows the trend from the last wave 5, how long ago it printed, and where both live counts stand.


Higher timeframe (MTF)
• The full count and rules also run on a higher timeframe: chosen automatically (M5 to H1, M15 to H4, H1 to D1 and so on) or set by you.
• The panel shows the higher-timeframe trend and its own BUY / SELL / WAIT for each side.
• An ALIGNED line lights up when both timeframes give the same instruction; AGAINST warns you when they disagree.

• The higher-timeframe wave points are drawn on your chart (for example "H1 3") on the exact candle where they formed, so you see the big waves and the small waves together.


Major structure
• A major zigzag built from confirmed swings, coloured by the major trend: green in an up trend, red in a down trend, blue with none.
• Major HH, HL, LH and LL labels, and a major 0-5 count on the bigger swings.

• Optional rays from the newest majors, running right until price closes through them.


H4 POC levels
• The point of control of every H4 block: the price touched by the most M5 candles.

• Prominent POCs, where price spent two hours or more, drawn in colour: green when higher than the previous one, red when lower. The newest run to the live candle.


Alerts

Pop-up, phone notification or both, each switchable: the rules panel turning to BUY, SELL or WAVE 5 (optionally only when the higher timeframe agrees), a new wave 2, 3, 4 or 5 on your chart, and a new wave 2, 3, 4 or 5 on the higher timeframe. Alerts fire once, on the close of the candle, never for history.


Control panel
Eight buttons switch the layers on and off: waves, finished counts, higher-timeframe waves, majors, major count, major rays, POC and prominent POC. Settings are kept per symbol, and the panel can be minimised to one line.
How the count behaves

Everything is calculated on closed candles. A wave point can still move to a later candle while its count is running: wave 1 extends while price keeps going, and a wave 4 that reaches wave 2 shows wave 1 was not finished. A close beyond wave 0 unwinds the count. The newest major swing is provisional until it is confirmed. Nothing is changed on candles that have already closed.


Inputs
• Wave count: wave window (21 by default), history, which counts to show.
• Wave look: colours, number size, gaps, wave words and font.
• Ratios and grades: every grade limit and the deep wave 4 filter.
• Higher timeframe: automatic or chosen, history, points on the chart, colours.
• Major structure: history, confirmation, trend length, colours, sizes, rays.
• H4 POC: blocks shown, prominent threshold, colours.

• Panel, alerts and copy number.


Notes
• Works on any symbol; built for intraday forex charts from M1 to H4. The POC levels show on H4 charts and below.
• The wave method is the Waves of Success method taught by Charts247 Trading Academy.
• No DLLs and no files written.
• Also available for MetaTrader 4

推荐产品
Manyal trading system, CovEchoTrend Robot, focuses on reliability and flexibility. By employing statistical analysis methods to study the relationships between the base indicator and market patterns, the system enables a deeper understanding of market processes. Intelligent pattern analysis: The application of statistical data processing helps identify key trend reversal points more accurately, signaling significant market shifts. Informed decision-making is based on the intersection of indicato


SPECIAL LAUNCH OFFER: $30 (1-Month Rent) Limited time offer to build our community and gather feedback! AmbM GOLD Institutional Scalper A high-precision M5 algorithm for XAUUSD (Gold) , engineered to trade exclusively at Institutional Liquidity Levels ($5/$10 psychological marks). PERFORMANCE DATA (BUY ONLY) • Win Rate: 87.09%. • Safe Growth: +$4,113 profit on $10k (13.75% Max Drawdown). • Extreme Stress Test: Successfully generated +$22,997 in a 5-year stress test (2020-2026), proving
Structure King AI Signal
Shingala Gautamkumar
Structure King AI Signal Structure King AI Signal is a professional MetaTrader 5 trading indicator designed to help traders analyze market structure, trend direction, multi-timeframe confirmation and trade management from one clean dashboard. Key Features • Market Structure & Trend Analysis • BUY / SELL Signals • Multi-Timeframe (HTF) Confirmation • Entry Price Levels • Dynamic Stop Loss (SL) • TP1 / TP2 / TP3 Levels • ATR Volatility Analysis • ADX Trend Strength Filter • Adaptive Market Filter
PatternDetector
Thien Thanh Tran
PatternScope — Multi-Pattern Recognition for MT5 PatternScope is a multi-pattern recognition indicator for MetaTrader 5. It scans price action for classic chart patterns, confirms breakouts, and draws clear   Entry, Stop Loss and Take Profit   levels. A compact dashboard shows the latest pattern, bias and Risk:Reward. Patterns:   Double Top/Bottom, Triple Top/Bottom, Head and Shoulders (and inverted), Bullish & Bearish Flag, Pennant, Rising & Falling Wedge, Triangle, Rectangle, Cup and Handle —
Introducing to your attention the unique trading system/indicator "Scaled Vidya Trends", designed for dynamic scalp trading on trend volatility pairs hour + timeframes. Main features of Scaled Vidya Trends: -Multi-level market analysis: it works on H1, H2, H3 timeframes; -Uses the most popular currency pairs: EURUSD, GBPUSD, USDCAD. Brokers usually set one of the lowest spreads for these pairs; -Applies a scalping method based on local targets for signals; -Signals appears at the new open of
GP Confluence Scanner MT5 Advanced Multi-Timeframe Market Structure & Confluence Analysis Don't get stopped out easily again! GP Confluence Scanner MT5 is an advanced technical analysis indicator designed to reveal important market levels, hidden support and resistance, and multiple technical confluences before entering a setup. Rather than relying on a single indicator, GP Confluence Scanner examines multiple technical factors to identify areas where significant market reactions may occur. Key
RBreaker
Zhong Long Wu
RBreaker Gold Indicators 是黄金期货一种短线日内交易策略,它结合了趋势跟踪和日内反转两种交易方式,既能捕捉趋势行情的利润,又能在行情反转时及时止盈并顺势反手。 该策略曾连续15年被美国《Futures Truth》杂志评选为前十大最赚钱的交易策略之一,具有很长的生命周期,至今仍在国内外普遍使用与研究。 本指标结合了2026年期货黄金的走势,依据14日ATR指标,分别定义了突破系数A,观察系数B,反转系数R更合理的数值,非常不错的指标,已实现年稳定盈利,值得推荐~ 以上指标适合高波动品种,参数适合期货黄金,股指期货等,如果需要其他品种行情,需要单独设定 突破系数A,观察系数B,反转系数R,进行回测才能使用。 欢迎指标售后有问题可以加+V:504282029
Antique Trend
Nadiya Mirosh
The Antique Trend Indicator is a revolutionary trend trading and filtering solution with all the important features of a trend tool built into one tool! The Antique Trend indicator is good for any trader, suitable for any trader both for Forex and binary options. There is no need to configure anything, everything has been perfected by time and experience, it works great during flats and trends. The Antique Trend indicator is a tool for technical analysis of financial markets, reflecting curren
Ugenesys AI MT5
Odaine Ramon Mcmillan
uGenesys AI - 90% Accurate Daytrading Indicator Introducing the ultimate forex trading indicator system, uGenesys AI, powered by cutting-edge AI technology and advanced analytical techniques, including Time-Series Analysis and Genetic Algorithms. Our AI-powered trading system leverages the power of time-series analysis to identify trends and patterns in historical price data, allowing traders to make informed predictions about future market movements. By analyzing vast amounts of data, our syst
CS Bollinger
MIKHAIL VINOGRADOV
CS Bollinger – 基于布林带的信号指标,专为快速识别关键支撑和阻力位而设计,配合视觉化的交易信号。通过改进的水平切换逻辑,指标可自动调整图表上的支撑与阻力水平,并在价格反转确认时显示信号箭头。这帮助交易者快速发现进出市场的有利时机。该指标具备灵活的设置选项,可根据个人交易策略进行调整,适用于新手和经验丰富的市场参与者。 Параметр Значение по умолчанию Описание BollingerPeriod 5 布林带计算周期。定义用于均线计算的K线数量 BollingerDeviation 5 计算布林带上下轨的偏差系数 CheckZeroBar false 启用零号K线检查以生成信号 ColorResistance clrDeepPink 阻力线颜色,表示从上向下的反转水平 ColorSupport clrDeepSkyBlue 支撑线颜色,表示从下向上的反转水平 LineSize 3 支撑与阻力线的线宽 ArrowSize 1 交易反转信号箭头的大小 BarsCount 200 用于指标计算的K线数量,影
Riko Trend mt5
Nadiya Mirosh
The Riko Trend indicator is a revolutionary trend trading and filtering solution with all the important features of a trend tool built into one tool! The Riko Trend indicator is good for any trader, suitable for any trader for both forex and binary options. You don’t need to configure anything, everything is perfected by time and experience, it works great during a flat and in a trend. The Riko Trend indicator is a technical analysis tool for financial markets that reflects the current price f
HMA Trend Professional MT5
Pavel Zamoshnikov
4.25 (4)
Improved version of the free HMA Trend indicator (for MetaTrader 4) with statistical analysis. HMA Trend is a trend indicator based on the Hull Moving Average (HMA) with two periods. HMA with a slow period identifies the trend, while HMA with a fast period determines the short-term movements and signals in the trend direction. The main differences from the free version: Ability to predict the probability of a trend reversal using analysis of history data. Plotting statistical charts for analyzi
Titan scalping pro
Luai Mohammad Amin Azab
TITAN SCALPING PRO v3.02 — 不追逐价格,读懂价格的拒绝信号。 如果最重要的信号,不是价格正在走向哪里,而是价格拒绝走向哪里呢? 大多数交易者总是在价格已经大幅波动之后才追逐K线。TITAN SCALPING PRO 采用了不同的方法:它能够识别特定的K线拒绝形态,并将其转化为一套结构化的斐波那契交易分析图,帮助交易者评估潜在入场区域、止损位置以及盈利目标。 本指标专为重视精准性、简洁图表以及纪律化交易方式的交易者设计,适用于 MetaTrader 5 平台上的价格行为(Price Action)剥头皮交易 。 TITAN 的核心理念 一根长影线,可能揭示很多重要信息。 它可能表明,价格曾试图朝某个方向移动,但遭到了市场的拒绝。TITAN SCALPING PRO 专注于分析四种常见的K线形态,并结合K线结构与趋势背景,识别潜在的看涨和看跌交易机会。 与仅仅标记一根K线、将后续分析留给交易者的普通指标不同,TITAN 会围绕识别出的形态构建一套完整的可视化分析系统。 核心功能 1. 四种价格行为形态识别 自动识别并分析以下K线形态: Hammer(锤头
Utraspikedetector
Odete Argelio Simbine
UltraSpikeDETECTOR for MQL5 is a professional market indicator designed to detect sudden price spikes and market trends efficiently. It provides real-time alerts, clear visual signals, and full integration with the MQL5 platform. Fully customizable and adaptable to various trading strategies, it helps traders monitor market movements more effectively. This tool is intended to support informed decision-making and improve trading analysis. No profit guarantees are provided, ensuring compliance wit
Dynasty SMC/ICT Terminal — v3.0 "Neon-Ops Edition" An all-in-one Smart Money Concepts / ICT dashboard for MetaTrader 5. It's an indicator, not an auto-trading EA — it never places, modifies, or closes real orders. It scans price action for Order Blocks, Fair Value Gaps, market structure, harmonic patterns, and multi-timeframe momentum, blends everything into one calibratable Master Signal, and — if enabled — builds a fully automated on-chart trade plan with entry, stop loss, three take-profit ta
该指标具有独有的支撑阻力计算方案  , 是独一无二的交易系统    。 指标特性 想象一下,如果您能提前精确的判断出重要的交易支撑阻力区域以及点位,您的交易将如何改善   ?  基于独特的计算方式,指标通过对趋势进行分析,通过对当前的支撑阻力进行分析后,得出现在重要的支撑阻力以及做单方向,计算得到的止盈和止损建议,以及关键的进场点位建议. 在交易策略中,进场点位和趋势方向同样非常关键,前者点位不同所面临的风险是不同的,止损的点数也是成倍放大. 本指标分析了当趋势进行后,暂时进入调整时间,分析了此时的重要进场支撑阻力并计算风险控制一定的止损,和止盈,合理的盈亏比. 本指标支持周期设置,可以设置其他周期.  大周期重要支撑阻力,以及小周期辅助判断可以在同一图表中完成. 基本显示 显示历史支撑阻力的价格标签。 显示历史进场位置大概建议范围,以及止盈和止损建议,目标预测. 显示当前方向的判断,以及进场点位,以及止盈止损建议 . 基本设置 设置计算的周期。 警报设置 接近报警 碰触报警 报警弹窗 报警邮件发送 发送推送警报 颜色设定 可以设置不用的实时支撑阻力颜色 可以设置不用的历史支撑阻
Liquidity Oscillator
Paolo Scopazzo
3 (2)
A powerful oscillator that provide Buy and Sell signals by calculating the investor liquidity. The more liquidity the more buy possibilities. The less liquidity the more sell possibilities. Please download the demo and run a backtest! HOW IT WORKS: The oscillator will put buy and sell arrow on the chart in runtime only . Top value is 95 to 100 -> Investors are ready to buy and you should follow. Bottom value is 5 to 0 -> Investors are ready to sell and you should follow. Alert + sound will appe
Cycles Forecast
Pooriya Alirezaee
This indicator is based on a mathematical formula and an ANN combined, designed to make a model(using previous prices) of the most recent market condition (any chart*) in order to use the model as a forecasting tool. *This indicator can operate on any chart/timeframe, but it's suggested you use multiple timeframes for each trade because this method relies solely on the time factor, you can not use this indicator to predict price volatility, but if it's fit correctly it will show you when the nex
SMC Smart Flow Pro
Thitipong Nookhunthod
Short Description: SMC Smart Flow Pro is an advanced Smart Money Concept indicator that automatically detects Break of Structure (BOS), Change of Character (CHoCH), and projects precise TP/SL target levels on all timeframes — built for serious traders who trade with institutional flow. Full Description: SMC Smart Flow Pro is a premium Smart Money Concept (SMC) indicator for MetaTrader 5, engineered for traders who want to trade alongside institutional order flow. By automatically mapping m
Candlestick Scanner MT5
Allan Aparece Ninal
Candlestick Scanner MT5 is a scanner indicator for MetaTrader 5 that watches many symbols and timeframes for 21 candlestick patterns. Each cell of its panel shows the latest pattern. A context filter can keep only patterns at a recent low (bullish) or high (bearish). A statistics table shows what price did after each pattern in your own history, next to the same measure for any bar. It is for traders who want to check a whole watchlist in one place. It works on closed bars only. A cell never cha
ONNYX INDICATOR 版本 1.14 这是一款用于 MetaTrader 5 的供需区域分析指标。已确认的历史信号采用收盘K线逻辑,避免确认后的箭头因盘中波动而消失。指标根据确认的摆动高低点建立区域,使用 ATR 调整区域宽度,并以百分比显示区域质量。 主要功能 - 供需区域及区域内百分比评分。 - 收盘K线确认后的放大 BUY/SELL 箭头。 - 可选 EMA 趋势过滤和K线拒绝确认。 - 趋势、价格水平和市场环境面板。 - 最多显示 5 条相关经济新闻;公布前显示 Forecast 和 Previous,公布后显示 Actual。 - 新闻每 60 秒刷新,并支持策略测试器中的日历缓存。 - 弹窗、推送和邮件提醒。 - iCustom 集成:缓冲区 0 为 BUY 价格,缓冲区 1 为 SELL 价格。 使用方法 将指标加载到图表,等待历史数据完成加载,查看趋势和有效区域,然后结合自己的交易计划使用收盘K线信号。XAUUSD H1 适合更清晰的结构,M15 可获得更频繁的机会。 重要提示 本产品是分析指标,不是自动交易 EA,不会自动开仓、修改或平仓,也不保证盈利。请先
Seven fugures
Simanga Mkhwanazi
7FIGURES TREND — MT5 Trend & Signal Indicator See the trend. Read the market. Trade with greater clarity. 7FIGURES TREND is a professional MetaTrader 5 trend and signal indicator designed for traders who want a cleaner and simpler view of market direction without filling their charts with unnecessary technical information. The indicator performs its analysis in the background and presents the trader with clear information directly on the chart. WHAT 7FIGURES TREND SHOWS The system identifies the
Divergent Stochastic Filter II Catch Reversals Early, Filter Noise, Trade with Confidence The Edge: Why This Stochastic is Different  Every trader knows the Stochastic oscillator. But knowing when to trust its signals, that's the real challenge. The Divergent Stochastic Filter II transforms this classic indicator into a precision reversal detection system by adding critical elements: divergence intelligence, signal filtering and exhaustion detection.  While standard Stochastic oscillators fire s
限时特惠! 随着销量增长,价格将逐步上涨。 HEX SCANNER PRO 用户手册 MT5: https://www.mql5.com/en/blogs/post/778595 HEX SCANNER PRO 一目了然的市场动态——趋势、时机和信号尽在掌握。 适用人群 不想在数十个图表和时间框架之间来回切换的交易者。如果您想立即查看哪些货币对正在波动、不同时间框架的走势是否一致、波动空间以及市场通常活跃的时段——这款软件正是为您量身打造。适用于外汇、黄金、指数和加密货币的短线交易者和日内交易者(MetaTrader 5)。 主要功能 六边形扫描器 - 最多可显示 18 个交易品种,以发光的蜂窝状网格呈现 - 颜色显示方向,填充颜色显示趋势强度 - 疲软的走势逐渐消失,新鲜的信号会闪耀 - 最佳设置排序在顶部,一键打开图表 - 当有新的交易品种发出信号时发出提醒 买入/卖出信号 - 在已收盘的K线上寻找趋势回调入场点 - 无重绘 - 3 种入场速度:巡航/运动/涡轮 - 一键切换 - 平衡的买入和卖出信号 多时间框架仪表盘 - 同时显示 5 个
Maximum Trend Arrows OT MT5
Mulweli Valdaz Makulana
STRICTLY FOR BOOM INDEX ONLY!!!!! Here I bring the Maximum Trend Arrows OT1.0 MT5 indicator. This indicator is made up of a combination of different trend indicators for entries and exits, for entries an orange arrow will paint on the chart below the current market and a red flag for closing of trades and it produces buy arrows only. When the orange arrow appears, it will appear along with it's sound to notify you. The 1H timeframe is recommended, don't use it anywhere else than on the 1H timefr
Fabii Half Trend Baseline
Fabien Georges Andre Guillemaud
不要再逆着更高周期的趋势交易。两条基准线,一张图表。不重绘。 任何品种,任何周期。2 分钟内用在您的图表上。可在 Strategy Tester 中免费试用演示。 Get more indicators here Baselines, volatility filters and oscillators. No repaint. 为什么需要它 您因为图表上的线变绿而入场。随后您打开更高周期,发现大趋势指向相反方向。信号是真实的,但信号背后的趋势并不站在您这一边。 每一笔逆着大趋势的交易,都会削弱您入场时的优势。 您将获得 Fabii Half Trend Baseline 在一张图表上同时显示您当前周期的趋势和更高周期的趋势,您不必再切换窗口去确认大方向。 来自更高周期的第二条基准线绘制在主线后方,因此您无需打开另一张图表就能看到大趋势。 基准线只随趋势移动,不会后退,因此您一眼就能看到趋势会在哪里被打破。 在已确认的反转处显示 Buy 和 Sell 箭头,因此趋势改变的那一刻您会得到清晰的标记。 可选的 K 线着色跟随趋势,因此您可以直接从 K 线读出趋势。 趋势转换和更高周期
PZ Trend Trading MT5
PZ TRADING SLU
3.8 (5)
许多盈利交易者不仅知道如何识别市场趋势,而且也能把握趋势建立后的交易机会。 Pz 趋势交易 指标设计用来在趋势行情中尽可能的赚取利润。 已建立的趋势提供了一揽子交易机会,但大多数趋势交易指标完全忽视了它们,让交易者在趋势行情时完全不知道该如何做!一般趋势指标只通知有关的趋势变化,但根本不足以得到卓越的回报. Pz 趋势交易 指标比一般趋势指标显示多达 20 倍的交易 , 因为它注重所谓的市场时机。它不仅显示当前的市场趋势,也有回调,内柱线的突破和调整。它令您在趋势回调之后介入,安全的柱线内突破金字塔加仓,以及发现潜在的反转,和已知的调整。 趋势改变 一个趋势改变在市场方向变化时发生。趋势变化在图表上用带数字的彩色圆圈显示。蓝色 (1) 信号为上涨开始, 而红色 (1) 信号为下跌开始。趋势变化并非评估当前价格动作的结果, 它意味着交易设置是不定时地。如果您正确使用本指标, 在趋势变化时, 您将将已经入场 (参看下面的调整)。 回调 但凡趋势在运动中,行情上下抖动,盈利者收割利润,且其它参与者入场。趋势回调代表好的买入机会,通常是由主力获利离场导致。如果行情在回调后回归上行, 指标将
Unlock the Power of Scalping with this Essential Indicator for Any Currency Pair! Experience Crystal-Clear Buy/Sell Signals and Activate Instant Alerts for Maximum Precision. Introducing the Ultimate Scalping Companion: Your Key to Precision Profits!  Transform Your Trading Strategy with an Indicator that Stands the Test of Time! In the ever-evolving world of trading, consistent success hinges on smart risk management . While no tool can be the holy grail, our non-repainting indicator is a ga
Radar Trade Analytic
Jeverson Rodrigues Ferreira
Radar Trade Analytic 2.0 – MT5 量化面板 什么是 Radar Trade Analytic? Radar Trade Analytic 是 Radar Trade 生态系统的量化模块。它在主图表下方的独立窗口中打开,展示四个同步的层级,全部基于同一个专有的 Sigma 引擎构建,确保图表上所见与面板中所读之间的直接对应关系。 没有买卖信号,没有目标价位,没有警报。Radar Trade Analytic 只整理真正重要的数据,让你能够清晰地做出决策。 2.0 版本有哪些变化? # 改进项 旧版本 (1.00) 2.0 版本 1 Delta Flow (CVD) 仅使用 M1 K 线计算(低时间周期估算) 通过带有 TICK_FLAG_BUY/SELL 标记的逐笔成交计算真实主动性 Delta,与专业平台使用的数据相同 2 自动回退机制 若 M1 不可用,则使用 K 线方向(几何估算) 若逐笔数据不可用,先尝试 M1 K 线;若仍失败,则使用当前 K 线本身。共三级回退 3 控制参数 无此选项 新增 UsarDeltaReal 参数(默认
Gioteen Volatility Index (GVI) - your ultimate solution to overcoming market unpredictability and maximizing trading opportunities. This revolutionary indicator helps you in lowering your losing trades due to choppy market movements. The GVI is designed to measure market volatility, providing you with valuable insights to identify the most favorable trading prospects. Its intuitive interface consists of a dynamic red line representing the volatility index, accompanied by blue line that indicate
该产品的买家也购买
Boba Analysis Suite
Trade Ready Solutions LLC
5 (2)
Boba Analysis Suite Boba Analysis Suite 是一款适用于 MetaTrader 5 的分析指标。它将市场结构、关键价格区域和整体市场背景整合到同一图表视图中。 该指标源于交易及交易教学的实践经验,旨在帮助用户建立有条理的分析流程:评估市场方向、识别重要价位,并结合多个时间周期进行分析。 结合市场背景进行分析 单个信号的意义取决于市场背景。Boba Analysis Suite 帮助用户将当前图表状况与更大范围的市场结构相结合,并根据预先制定的规则评估交易思路。 分析功能包括: **趋势与市场结构:**评估市场方向及相关结构背景。 **关键价格区域与价位:**在图表上直观标示值得进一步分析的重要区域。 **多时间周期:**整合不同时间周期的信息,评估整体市场背景。 **可视化分析流程:**直接在图表上查看分析信息。 自主做出交易决策 Boba Analysis Suite 适合希望系统分析图表并结合多个时间周期信息的交易者。 该指标用于辅助分析,不会开仓或平仓,也不能替代交易策略或风险管理。每一笔交易的决策均由用户自行做出。 使用与许可 平台:Meta
ARIPoint
Temirlan Kdyrkhan
1 (4)
ARIPoint is a powerful trading companion designed to generate high-probability entry signals with dynamic TP/SL/DP levels based on volatility. Built-in performance tracking shows win/loss stats, PP1/PP2 hits, and success rates all updated live. Key Features: Buy/Sell signals with adaptive volatility bands Real-time TP/SL/DP levels based on ATR Built-in MA Filter with optional ATR/StdDev volatility Performance stats panel (Success, Profit/Loss, PP1/PP2) Alerts via popup, sound, push, or email Cu
The indicator is designed to close positions on the market in time. For example: to take profits ahead of schedule if the price has not reached TakeProfit, and the market is turning around. The indicator analyzes the momentum, not the trend. He does not give any information about the trend. The indicator is well suited for finding divergence. The Ershov 38 Parrots indicator dynamically adjusts to the market and detects price movement impulses of medium and high amplitude. It almost does not rea
Meravith Scanner
Ivan Stefanov
5 (3)
MERAVITH SCANNER 是一款适用于 MetaTrader 5 的专业金融市场指标,将多种分析工具整合为一个统一的系统。它基于专有的成交量加权平均价格(VWAP)方法自动完成所有计算,完全消除主观判断。 该指标适用于所有资产类别(外汇、股票、指数、大宗商品、加密货币)以及从 M1 到 Monthly 的所有时间周期。其核心原理是价格跟随成交量。MERAVITH 识别机构资金成交量的集中区域,并从该集中区域中推导出数学上精确的价格水平。它不预测,不推测。它只计算。 使用 MERAVITH SCANNER,您可以在 2–3 分钟内扫描全部 28 个主要外汇货币对的所有时间周期。您也可以扫描任何您选择的市场——例如,大约 100 只股票约需 10 分钟。 该指标计算耗尽水平、平衡线、偏差、统计水平以及目标投射。 图表元素 Origin Point 标记所有计算的起始位置。指标会自动将其放置在最佳位置。红色标签(TOP)表示市场高点并带有看跌倾向。绿色标签(BOTTOM)表示市场低点并带有看涨倾向。 Sentiment Line 是一条动态曲线,反映基于成交量加权计算得出的市场情绪。
TrendMaestro5
Stefano Frisetti
note: this indicator is for METATRADER4, if you want the version for METATRADER5 this is the link:  https://www.mql5.com/it/market/product/108106 TRENDMAESTRO ver 2.5 TRENDMAESTRO recognizes a new TREND from the start, he never makes mistakes. The certainty of identifying a new TREND is priceless. DESCRIPTION TRENDMAESTRO identifies a new TREND in the bud, this indicator examines the volatility, volumes and momentum to identify the moment in which there is an explosion of one or more of these da
Meravith MT5
Ivan Stefanov
5 (3)
MERAVITH 是一款适用于 MetaTrader 5 的多周期成交量与流动性指标,它在每一个时间周期上显示趋势、支撑与阻力区域、入场、目标和止损。它为您提供完整的市场流动性地图,一个对冲基金风格的流动性工具,并用专有的成交量加权平均价格方法自动完成全部计算,因此没有主观解读。 适用于外汇、黄金(XAUUSD)、指数和加密货币,适用于所有时间周期。 购买后赠送:一套关于如何用 MERAVITH 交易的视频课程。购买后请给我发消息。 MERAVITH 的功能 分析所有时间周期,并显示每个周期上正在生效的趋势。 标记流动性区域(Volume Equilibrium),即多头与空头成交量相等的位置。 将所有时间周期的流动性水平直接显示在您的图表上。 写出市场的文字分析供您参考。 根据当前趋势计算入场、目标、支撑位和止损。 计算您交易的风险回报比。 按您的账户余额计算仓位大小,并估算潜在利润。 在市场出现重要变化时提醒您:警报、电子邮件和推送到手机的通知。 主要线条 Bullish / Bearish Volume Exhaustion 线:目标位。 趋势线:随趋势改变颜色(多头或空头),显
Cycles Plotter
Edoardo Centorame
Cycles Plotter 带移动平均线和开始日期的可自定义周期指标 Cycles Plotter 是一种高级技术指标,可根据用户输入绘制两个完全可自定义的正弦周期。它不会自动生成周期:所有周期都完全根据用户设置的参数计算,为交易者提供一种视觉工具,用于研究价格波动和潜在的趋势变化,而不产生自动信号或预测。 关键点: 用户定义的周期:周期 1 P1 和 2 P2 完全由用户配置。可以设置周期长度、幅度、移动平均线以及精确的开始日期和时间。如果用户未输入参数,则不会绘制任何周期。 幅度控制:每个周期可以具有不同的幅度,从而可以相对于参考移动平均线调整波动的高度。 趋势检测:快速和慢速移动平均线表示周期的方向: Fast MA 大于 Slow MA 上涨阶段 绿色 lime Fast MA 小于 Slow MA 下跌阶段 magenta 红色 Fast MA 约等于 Slow MA 横向阶段 flat 橙色 蓝色 周期绘图:每个周期有三条独立的线: 上涨阶段 绿色 lime 下跌阶段 magenta 红色 横向阶段 flat 橙色 蓝色 可自定义的开始日期和时间:可以定义每个周期开始绘制
AriX
Temirlan Kdyrkhan
1 (4)
AriX Indicator for MT5 A powerful trend-following and signal-evaluation tool AriX is a custom MT5 indicator that combines Moving Averages and ATR-based risk/reward logic to generate clear buy/sell signals. It visualizes dynamic SL/TP levels, evaluates past trade outcomes, and displays win/loss statistics in a clean on-chart panel. Key features include: Buy/Sell signals based on MA crossovers ATR-based SL/TP1/TP2/TP3 levels with visual lines and labels Signal outcome tracking with real-time stat
FX-AIEA 供给需求区智能识别指标(Supply and Demand Indicators MT5)——技术原理与参数讨论 版本:2.51 | 适用平台:MetaTrader 5 引言 供给需求区是机构订单流的重要表现形式,相比传统支撑阻力位能更直接地反映买卖力量的失衡。本指标尝试通过算法自动识别高概率供需区域,以减少手动绘制的耗时与主观性。其核心逻辑基于自适应 ZigZag 算法,提取波峰波谷并生成区域标识 。 核心技术特点 全自动绘制机制 :基于改良版 ZigZag 动态提取有效极值,标记潜在供给区与需求区。指标遵循 MQL5 原生   prev_calculated   机制,在新 K 线生成时自动重绘,支持跨周期强制计算( Forced_TimeFrame   参数)。 区域边界模式 :支持宽带(覆盖K线影线极值)与窄带(仅覆盖实体)两种模式,用户可通过   use_narrow_bands   参数切换,以适应不同交易风格。 滤噪算法 :启用   kill_retouch   后,自动剔除被后续行情反复轻触但未有效突破的弱势区域,以提升信号有效性。 视觉与性能 :支持自
ORB Seeker MT5
Marcela Goncalves De Oliveira
特价促销,限量供应,保持产品稀缺性! 仅售 599 美元! 购买后请联系我以获取奖励的 ORB Seeker EA 和个人优化设置文件。 自信地捕捉干净利落的比赛片段! ORB Seeker MT5 是一款专业的开盘区间突破 (ORB) 指标,专为追求准确性、简洁性、灵活性和清晰图表结构的交易者而设计。 它能自动绘制任何交易品种的盘前或自定义交易时段区间,然后给出清晰的突破信号,包括入场点、止损点、止盈点以及可选的50%部分止盈位。所有数据均实时计算并直接显示在图表上。 您可以选择交易伦敦开盘、纽约交易时段、亚洲交易时段,或者自定义交易时段。ORB Seeker MT5 会自动适应您选择的交易时段,让您精准掌握市场波动范围、突破位和交易位。 每次购买均免费赠送 ORB Seeker EA 智能交易系统。该 EA 系统读取指标的突破信号并可自动下单,您可以选择手动交易,也可以让 EA 系统根据指标的信号逻辑自动处理入场。   为什么选择 ORB Seeker MT5 支持多个交易时段 - 您可以自行设置伦敦、纽约、亚洲或自定义交易时段的盘前交易时间和交易时段。 完整的突破视觉效果 -
Volume Arrow Signal Product Description Volume Arrow Signal is a smart trading indicator designed to help traders identify potential buy and sell opportunities using price action, volume behavior, and directional arrow signals. The indicator places clear arrows directly on the chart, making it easy to spot possible market reversals, trend continuations, and entry opportunities without spending hours analyzing charts manually. Whether you are trading Gold (XAUUSD) , Forex pairs, Indices, or Crypt
KenKem Master Volume Profiler - Brief Introduction A Display-only volume-profile cockpit for XAUUSD, BTCUSD and other liquid symbols. Draws profile structure, multi-timeframe flow, EMA trend and study-only setup markers. Places no orders. Not a signal service.  It maps where the market has actually traded and reads recent order flow, so you can see structure and lean at a glance.  What it shows: Master and local volume profiles (POC and value-area high/low) - the price shelves that matter. A liv
VTrende Pro
Andrii Diachenko
5 (1)
VTrende Pro - MTF indicator for trend trading with a display panel for MT5 *** Videos can be translated into any language using subtitles (video language - Russian) Although the signals of the VTrende Pro indicator can be used as signals of a full-fledged trading system, it is recommended to use them in conjunction with the Bill Williams TS. VTrende Pro is an extended version of the VTrende indicator. Difference between Pro version and VTrende: - Time zones - Signal V - signal 1-2 waves -    S
一句话理解 这是一个 二合一的智能指示器 ——把 RSI 和 MACD 两位“专家”的意见打包成一个简单的结论:出现箭头,就行动;没有箭头,就等待。 而且箭头 不会重绘 ,收盘后是什么样,永远就是什么样。 它解决了什么问题 很多交易者同时看 RSI(判断动量和超买超卖)和 MACD(判断趋势方向),但两者经常给出矛盾信号。 这个指示器的做法是: 只有两人同时同意 ,才发出信号。这就过滤掉了大量假信号和模糊时段。 你实际看到的东西 独立的指示器窗口(不遮住 K 线图) 清晰的 买入箭头 和 卖出箭头 放大版的 MACD 柱状图(更容易看清动量变化) RSI 和 MACD 的线依然在,但你的注意力只需放在箭头上 谁适合用 新手 :不用学两个指标如何配合,跟着箭头做即可 老手 :节省时间,快速过滤噪音,且不重绘的特性让回测结果可信 所有讨厌信号闪烁的人 为什么它不重绘 因为它的判断逻辑基于 完整收盘后的价格数据 。信号只有在满足条件的那一刻才会固定下来,之后不会因为后续 K 线的变化而修改之前的箭头。 这意味着你可以放心做回测,也能在实盘中信任你看到的每一个信号。 底层特点(不复杂地说) 它
MasterTrend
Temirlan Kdyrkhan
MasterTrend Indicator for MT5 A powerful trend-following and signal-evaluation tool MasterTrend   is a custom MT5 indicator that combines Moving Averages and ATR-based risk/reward logic to generate clear buy/sell signals. It visualizes dynamic SL/TP levels, evaluates past trade outcomes, and displays win/loss statistics in a clean on-chart panel. Key features include: Buy/Sell signals based on MA crossovers ATR-based SL/TP1/TP2/TP3 levels with visual lines and labels Signal outcome tracking wit
SMC Sweep Fvg MT5
Daniil Sleptsov
5 (1)
SMC Sweep Fvg MT5 — 像聪明钱一样看市场,就在你的图表上 你一定有过这种感觉:价格扫掉你的止损,随后反转,并正好走到你预期的方向。方向你是对的,错的只是入场。 这个指标就是为了让这类情况少发生。它接手分析中最繁重的部分——图表标注,把真正重要的留给你:决策。 你会在图表上看到什么 市场结构 — 真实的结构高点与低点,带有 HH / HL / LH / LL 标记和水平线。趋势一目了然,无需猜测。 失衡区(FVG) — 价格推进过快、之后常会回补的区域。未回补与已回补的区域用不同颜色显示。 流动性行为 — 指标跟踪市场在反转前扫过关键水平的时刻。 现成的交易布局 — 入场箭头、止损位与盈利目标。全部画好,无需心算。 趋势过滤 — 更高周期的趋势线,帮你站在主趋势一侧。 指标关注流动性扫荡、失衡形成与结构状态——并只突出这些因素同时对齐的情形。 统计面板——回应每一个疑虑 你不必只听别人说。图表上的内置面板会按所选历史显示: 分析周期(K线数量); 检测到的情形总数; 多少到达目标、多少触及止损; 仍在运行中的数量; 以点数计的净结果。 切换品种——面板重
Gold Xausd Hunter
Metin Erkamoglu
5 (2)
MATADOR GOLD XAUUSD M5 Scalp Signals for MT5 MATADOR GOLD is a decision-support indicator for MetaTrader 5, designed for traders who analyze short-term Gold movement on the M5 timeframe. The indicator does not open, close, or manage trades automatically. It provides buy and sell signal guidance so the user can make their own trading decisions according to their risk plan, broker conditions, and trade management rules. Main purpose MATADOR GOLD is built to help traders avoid noisy signal flow and
PrimeScalping
Temirlan Kdyrkhan
PrimeScalping is a powerful trading companion designed to generate high-probability entry signals with dynamic TP/SL/DP levels based on volatility. Built-in performance tracking shows win/loss stats, PP1/PP2 hits, and success rates — all updated live. Key Features: Buy/Sell signals with adaptive volatility bands Real-time TP/SL/DP levels based on ATR Built-in MA Filter with optional ATR/StdDev volatility Performance stats panel (Success, Profit/Loss, PP1/PP2) Alerts via popup, sound, push, or e
Pan PrizMA CD Phase
Aleksey Panfilov
The Expert Advisor and the video are attached in the Discussion tab . The robot applies only one order and strictly follows the signals to evaluate the indicator efficiency. Pan PrizMA CD Phase is an option based on the Pan PrizMA indicator. Details (in Russian). Averaging by a quadric-quartic polynomial increases the smoothness of lines, adds momentum and rhythm. Extrapolation by the sinusoid function near a constant allows adjusting the delay or lead of signals. The value of the phase - wave s
Классификатор силы тренда. Показания на истории не меняет. Изменяется классификация только незакрытого бара. По идее подобен полной системе ASCTrend, сигнальный модуль которой, точнее его аппроксимация в несколько "урезанном" виде, есть в свободном доступе, а также в терминале как сигнальный индикатор SilverTrend . Точной копией системы ASCTrend не является. Работает на всех инструментах и всех временных диапазонах. Индикатор использует несколько некоррелируемых между собой алгоритмов для класси
FFx Universal Strength Meter PRO is more than a basic strength meter. Instead of limiting the calculation to price, it can be based on any of the 19 integrated strength modes + 9 timeframes. With the FFx USM, you are able to define any period for any combination of timeframes. For example, you can set the dashboard for the last 10 candles for M15-H1-H4… Full flexibility! Very easy to interpret... It gives a great idea about which currency is weak and which is strong, so you can find the best pai
The FFx Universal MTF alerter shows on a single chart all the timeframes (M1 to Monthly) with their own status for the chosen indicator. 9 indicators mode (MACD-RSI-Stochastic-MA-ADX-Ichimoku-Candles-CCI-PSAR). Each can be applied multiple times on the same chart with different settings. Very easy to interpret. Confirm your BUY entries when most of the timeframes are showing green color. And confirm your SELL entries when most of the timeframes are showing red color. 2 Alert Options : input to s
FFx Watcher Pro MT5
Eric Venturi-Bloxs
The FFx Watcher PRO is a dashboard displaying on a single chart the current direction of up to 15 standard indicators and up to 21 timeframes. It has 2 different modes: Watcher mode: Multi Indicators User is able to select up to 15 indicators to be displayed User is able to select up to 21 timeframes to be displayed Watcher mode: Multi Pairs User is able to select any number of pairs/symbols User is able to select up to 21 timeframes to be displayed This mode uses one of the standard indicators
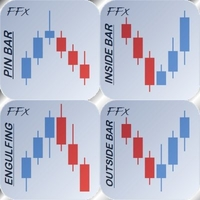
FFx Patterns Alerter gives trade suggestions with Entry, Target 1, Target 2 and StopLoss .... for any of the selected patterns (PinBar, Engulfing, InsideBar, OutsideBar) Below are the different options available: Multiple instances can be applied on the same chart to monitor different patterns Entry suggestion - pips to be added over the break for the entry 3 different options to calculate the SL - by pips, by ATR multiplier or at the pattern High/Low 3 different options to calculate the 2 TPs -
FFx Basket Scanner MT5
Eric Venturi-Bloxs
MetaTrader 4 version available here : https://www.mql5.com/en/market/product/24881 FFx Basket Scanner is a global tool scanning all pairs and all timeframes over up to five indicators among the 16 available. You will clearly see which currencies to avoid trading and which ones to focus on. Once a currency goes into an extreme zone (e.g. 20/80%), you can trade the whole basket with great confidence. Another way to use it is to look at two currencies (weak vs strong) to find the best single pairs
MetaTrader 4 version available here: https://www.mql5.com/en/market/product/25793 FFx Pivot SR Suite PRO is a complete suite for support and resistance levels. Support and Resistance are the most used levels in all kinds of trading. Can be used to find reversal trend, to set targets and stop, etc. The indicator is fully flexible directly from the chart 4 periods to choose for the calculation: 4Hours, Daily, Weekly and Monthly 4 formulas to choose for the calculation: Classic, Camarilla, Fibonac
ClassicSBA
Umri Azkia Zulkarnaen
this indicator very simple and easy if you understand and agree with setup and rule basic teknical sba you can cek in link : please cek my youtube channel for detail chanel : an for detail info  contact me  basicly setup buy (long) for this indicator is Magenta- blue and green candle or magenta - green  and green candlestik and for setup sell (short) is Black - yellow - and red candle or black - red  and red candlestik
WanaScalper
Isaac Wanasolo
1 (1)
A scalping indicator based on mathematical patterns, which on average gives signals with relatively small SL, and also occasionally helps to catch big moves in the markets (more information in the video) This indicator has three main types of notifications: The first type warns of a possible/upcoming signal on the next bar The second type indicates the presence of a ready signal to enter the market/open a position The third type is for SL and TP levels - you will be notified every time price re
Индикатор Coefficient Of Determination (COD) представляет собой значение коэффициента детерминации или квадрат коэффициента корреляции между зависимой переменной — ценой и объясняющей переменной — тиковым объемом. Что это дает нам на практике? COD отлично распознает кульминацию трендовых движений, что позволяет подбирать оптимальные точки и ловить развороты рынка. Как использовать индикатор: Наиболее популярная торговая стратегия строится совместно с трендовым индикатором Moving Average (MA), пе
作者的更多信息
Charts247 Market Structure Essentials MT5 Swing highs and lows, HH / HL / LH / LL labels, CHoCH and BOS on the close, the live intraday high and low, and the structure trend. Closed candles only; confirmed swings never move. Charts247 Market Structure Essentials reads price structure the way the Waves of Success method does: from closed candles only, with every swing confirmed before it is drawn. Nothing on history is redrawn. What it shows • Swing highs and lows. A swing high is a candle whose
FREE
Charts247 Market Structure Essentials Swing highs and lows, HH / HL / LH / LL labels, CHoCH and BOS on the close, the live intraday high and low, and the structure trend. Closed candles only; confirmed swings never move. Charts247 Market Structure Essentials reads price structure the way the Waves of Success method does: from closed candles only, with every swing confirmed before it is drawn. Nothing on history is redrawn. What it shows • Swing highs and lows. A swing high is a candle whose hig
FREE
Charts247 Market Structure Sessions The full Charts247 market structure: swings, CHoCH and BOS, intraday highs and lows by session, structure trend, session read, zigzag counter, break count, alerts and a control panel. Closed candles only. Charts247 Market Structure Sessions shows market structure the way the Waves of Success method reads it, and places each intraday high and low in the session where it printed. Everything is calculated on closed candles; nothing on history is redrawn. What
Charts247 Wave Master MTF A complete 0-5 wave count with a built-in rules panel: it reads both directions on your chart and on a higher timeframe, grades every wave, maps the major structure and marks where price spent the most time. Closed candles only. Most wave tools leave you with numbers on a chart and the hard part still to do: is this wave worth trading, which side has the trend, and does the bigger timeframe agree? Wave Master MTF answers all three on one screen. It runs the Waves of S
Charts247 Break and Count Spots the moment a rising support (or falling resistance) gives way, marks the entry candle and its stop, then maps the reversal level and counts the lows (highs) beyond it: buy low, no trade, buy low, continuation. Closed candles only. A support line that has held three times is one of the most watched structures on any chart. When it breaks, two trades follow: the break itself, and later the reversal from the exhaustion lows. Break and Count marks both, on fixed ru
Charts247 Daily Currency Matrix Every currency and every pair starts the day at zero and moves in pips, on one screen: see which currency is driving the market today, which pairs carry the move, and whether the H4 candles agree. Strongest to weakest, updated every second. A pair is only ever two currencies pulling against each other. When EURUSD rises, is the euro strong or the dollar weak? The Daily Currency Matrix answers that before you open a single pair chart: it resets every currency and
Charts247 Liquidity Engine Where the liquidity rests, when it is taken, and the entry that follows: the Waves of Success Alt count, liquidity rays and sweep count, Free State entries with entry and stop, a location gate, internal 2X setups and a higher-degree Free State structure. Closed candles only. Price moves from one pool of liquidity to the next. The highs and lows where stops collect get taken, and the move that follows a sweep is where the opportunity sits. Charts247 Liquidity Engine fo
Charts247 Price Value Bands Is price cheap, fair or stretched right now? Fair value with value bands measured from how far price really travels, the share of closes beyond each band, return arrows, a two-close T3 line, confirmed peaks and the M5 Fibonacci. Nothing repaints. Every market swings around a fair value. Most of the time it stays close; now and then it stretches far away, and from there it usually comes back. Charts247 Price Value Bands shows how far is far for the symbol and timefra
Charts247 Market Structure Sessions The full Charts247 market structure: swings, CHoCH and BOS, intraday highs and lows by session, structure trend, session read, zigzag counter, break count, alerts and a control panel. Closed candles only. Charts247 Market Structure Sessions shows market structure the way the Waves of Success method reads it, and places each intraday high and low in the session where it printed. Everything is calculated on closed candles; nothing on history is redrawn. What
Charts247 Break and Count MT5 Spots the moment a rising support (or falling resistance) gives way, marks the entry candle and its stop, then maps the reversal level and counts the lows (highs) beyond it: buy low, no trade, buy low, continuation. Closed candles only. A support line that has held three times is one of the most watched structures on any chart. When it breaks, two trades follow: the break itself, and later the reversal from the exhaustion lows. Break and Count marks both, on fixe
Charts247 Daily Currency Matrix MT5 Every currency and every pair starts the day at zero and moves in pips, on one screen: see which currency is driving the market today, which pairs carry the move, and whether the H4 candles agree. Strongest to weakest, updated every second. A pair is only ever two currencies pulling against each other. When EURUSD rises, is the euro strong or the dollar weak? The Daily Currency Matrix answers that before you open a single pair chart: it resets every currency
Charts247 Liquidity Engine MT5 Where the liquidity rests, when it is taken, and the entry that follows: the Waves of Success Alt count, liquidity rays and sweep count, Free State entries with entry and stop, a location gate, internal 2X setups and a higher-degree Free State structure. Closed candles only. Price moves from one pool of liquidity to the next. The highs and lows where stops collect get taken, and the move that follows a sweep is where the opportunity sits. Charts247 Liquidity Engin
Charts247 Price Value Bands MT5 Is price cheap, fair or stretched right now? Fair value with value bands measured from how far price really travels, the share of closes beyond each band, return arrows, a two-close T3 line, confirmed peaks and the M5 Fibonacci. Nothing repaints. Every market swings around a fair value. Most of the time it stays close; now and then it stretches far away, and from there it usually comes back. Charts247 Price Value Bands shows how far is far for the symbol and time
筛选:
无评论
回复评论