PreviousDayHighLow
- 指标
- 版本: 1.0
- 激活: 5

Trading on lower timeframes without reference to higher ones is like reading a single sentence in a book and trying to understand the whole plot. PreviousDayHighLow gives you the big picture back.
This indicator is designed for intraday traders and scalpers (M1-M15). It automatically transfers key higher-timeframe levels to your working chart, saving you from trading "blindly" inside the daily candle.
How it works:
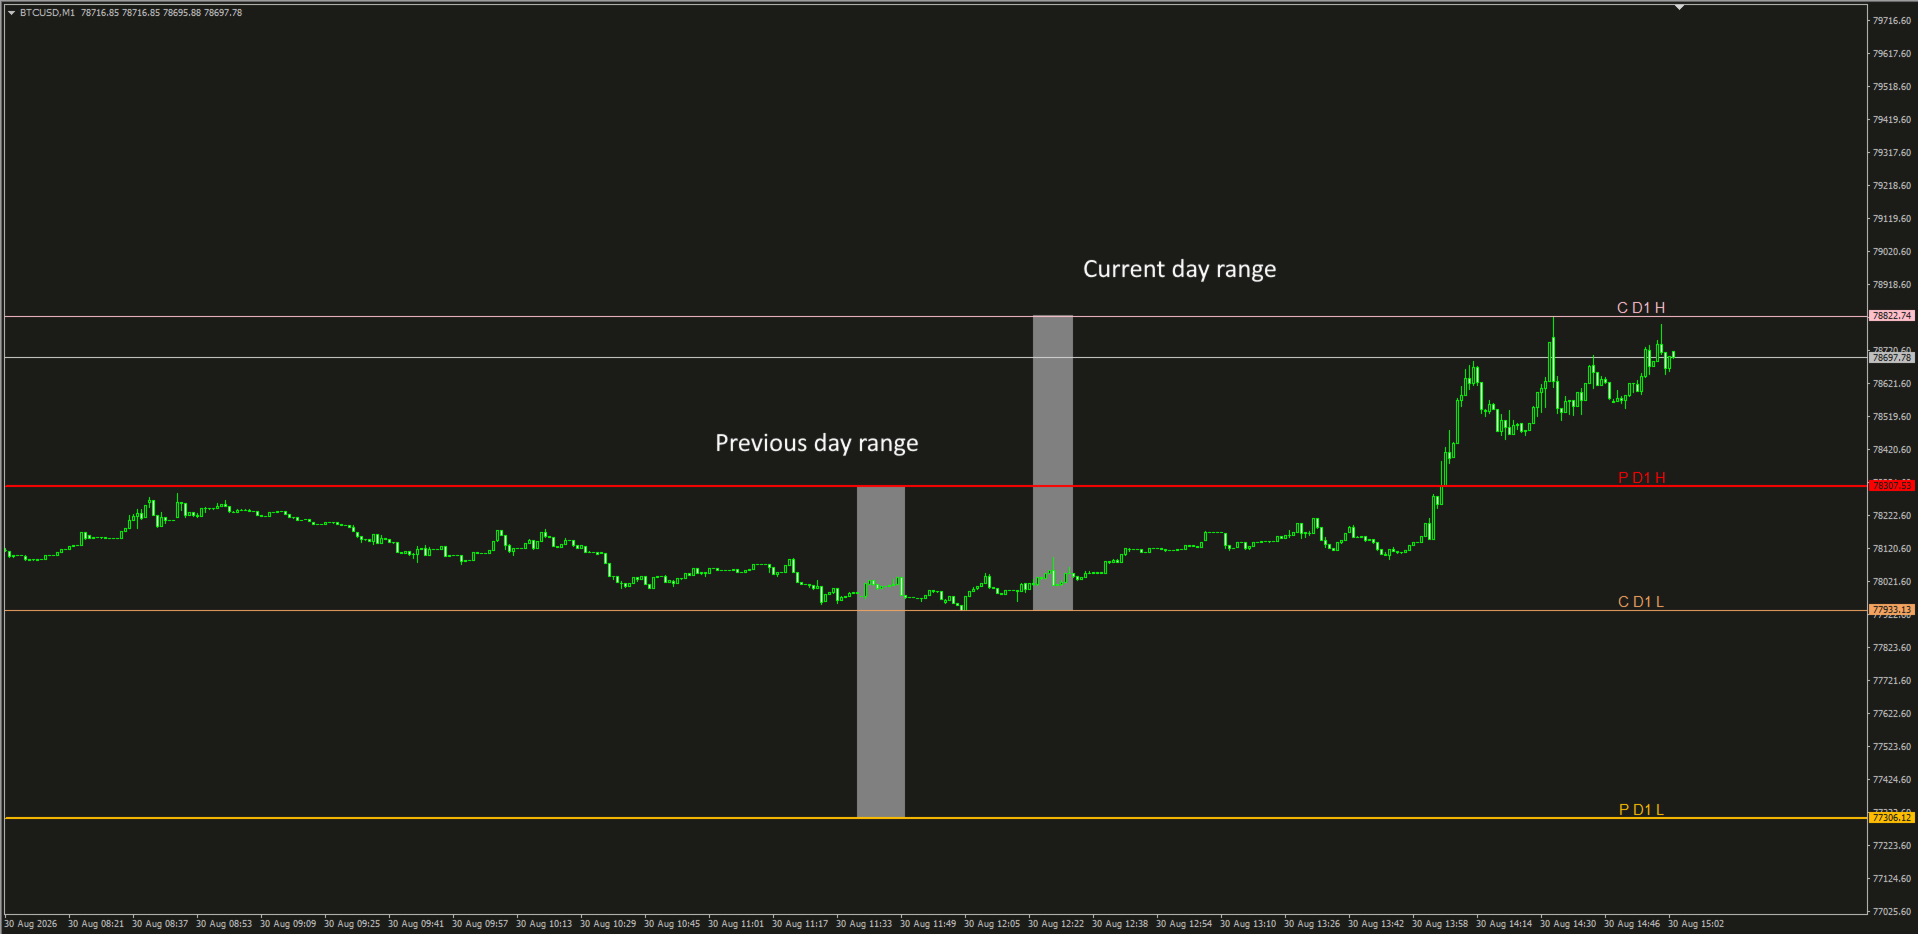
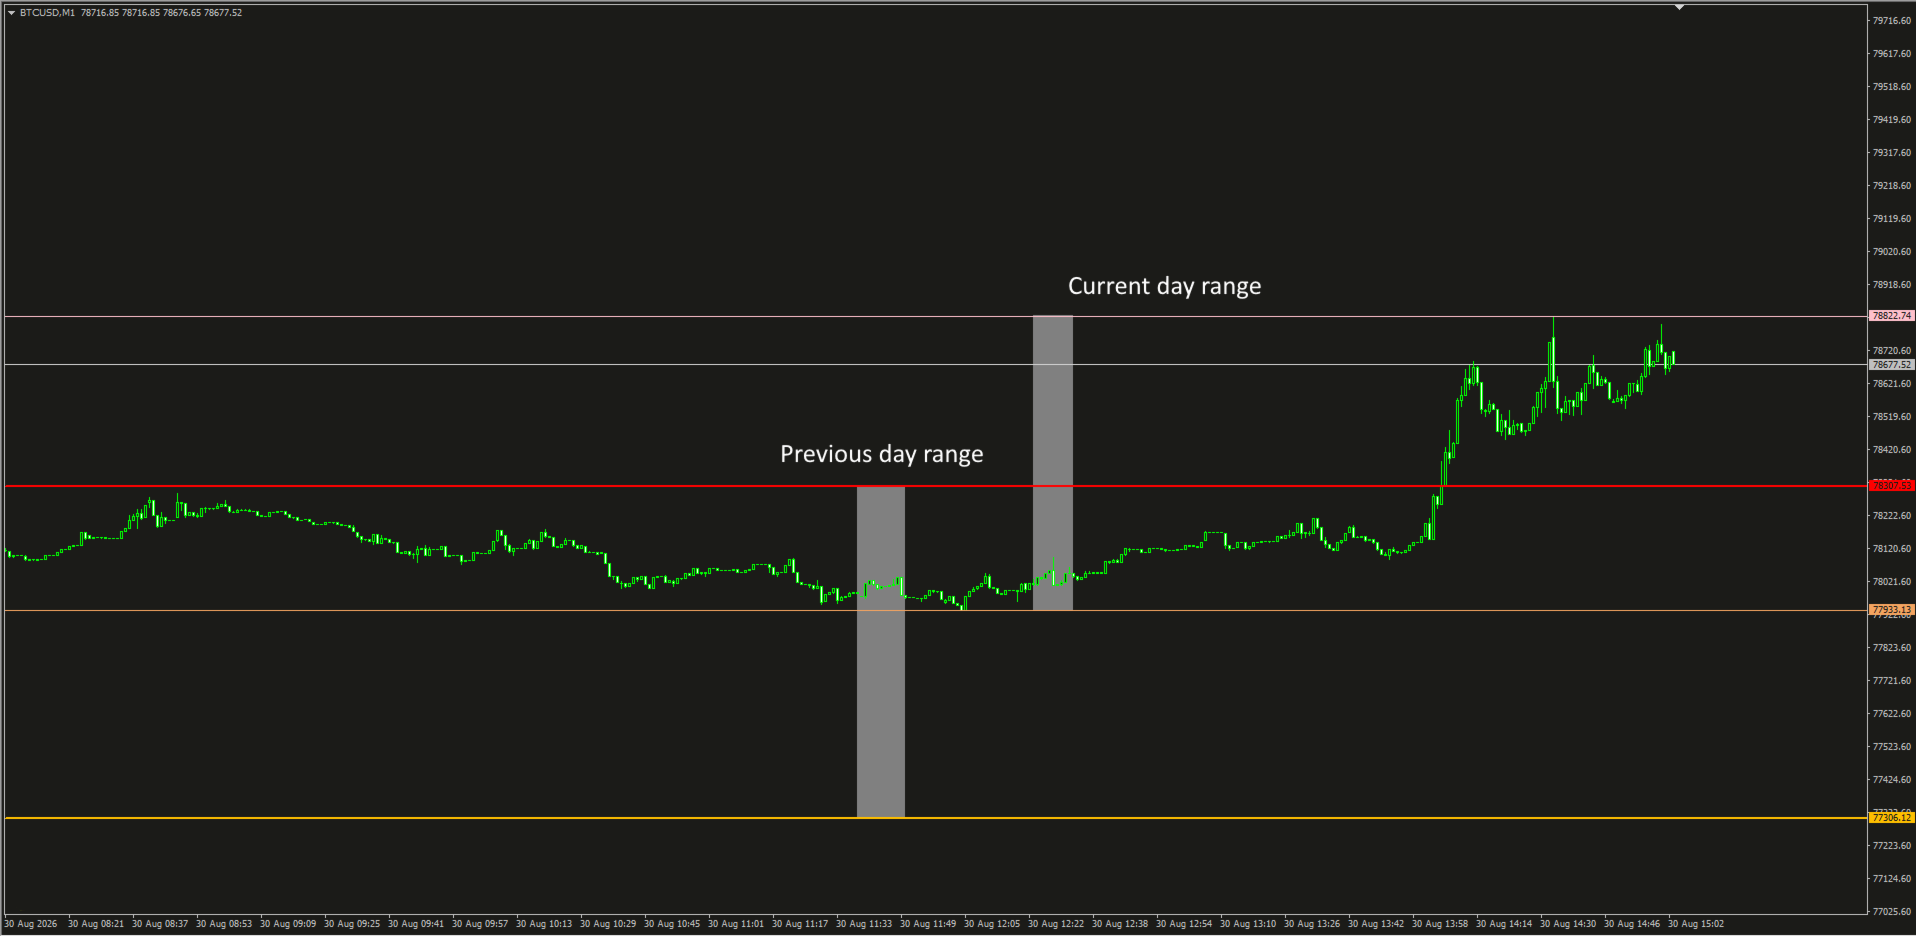
The indicator automatically calculates and plots four crucial lines on your chart:
1) Previous Day High (PDH)
2) Previous Day Low (PDL)
3) Current Day High (CDH)
4) Current Day Low (CDL)
Why is it important?
Now you always understand the market context. You can instantly see if:
- The price is tightly squeezing against yesterday's high (preparing for a breakout).
- The price broke yesterday's low and sharply reversed (forming a false breakout / liquidity grab).
- The price is stuck in the exact middle of the daily range (a zone of uncertainty where it's better to stay out).
These are three completely different market stories that require different trading setups.
Key Features:
- No repainting. Levels are built strictly on objective daily extremes.
- Clean chart. No indicator clutter — only the 4 lines that truly matter.
- Fully customizable. Adapt the visuals to your personal trading template.
Input Parameters:
- Previous Day High/Low Color — color for yesterday's extremes;
- Current Day High/Low Color — color for today's extremes;
- Lines Style & Width — choose solid or dashed lines, adjust thickness;
- Show Labels — enable/disable text labels for the lines;
- Labels Color & Size — customize text appearance.