AI Color Gradient Volume

Introduction to the use of MT4 platform AI Color Gradient Volume indicators
I. Overview of indicators

AI Color Gradient Volume is an innovative volume analysis indicator based on artificial intelligence technology for the MT4 platform. By converting the volume data into an intuitive color gradient graph, it helps traders to have a more acute insight into the inflow and outflow of funds in the market and the strength of the buying and selling forces, so as to provide strong support for trading decisions, which is suitable for various MT4 trading markets such as foreign exchange, stocks, futures and so on.
Second, installation and setup

Installation steps: First, download the AI Color Gradient Volume indicator file, which is usually in.ex4 format. Then, on the MT4 platform, click the "File" menu, select "Open Data folder", enter the "MQL4" folder, then find the "Indicators" folder, copy and paste the downloaded indicator file into this folder. Close and re-open the MT4 platform, select "Indicator" in the "Insert" menu, find the AI Color Gradient Volume indicator in the list of custom indicators and click to add it to the chart.
Parameter Settings: After installation, indicators may have some default parameter Settings, in general, these default Settings can meet the basic trading needs, but traders can also be further optimized according to their own trading strategy and market conditions.
Third, indicator interpretation
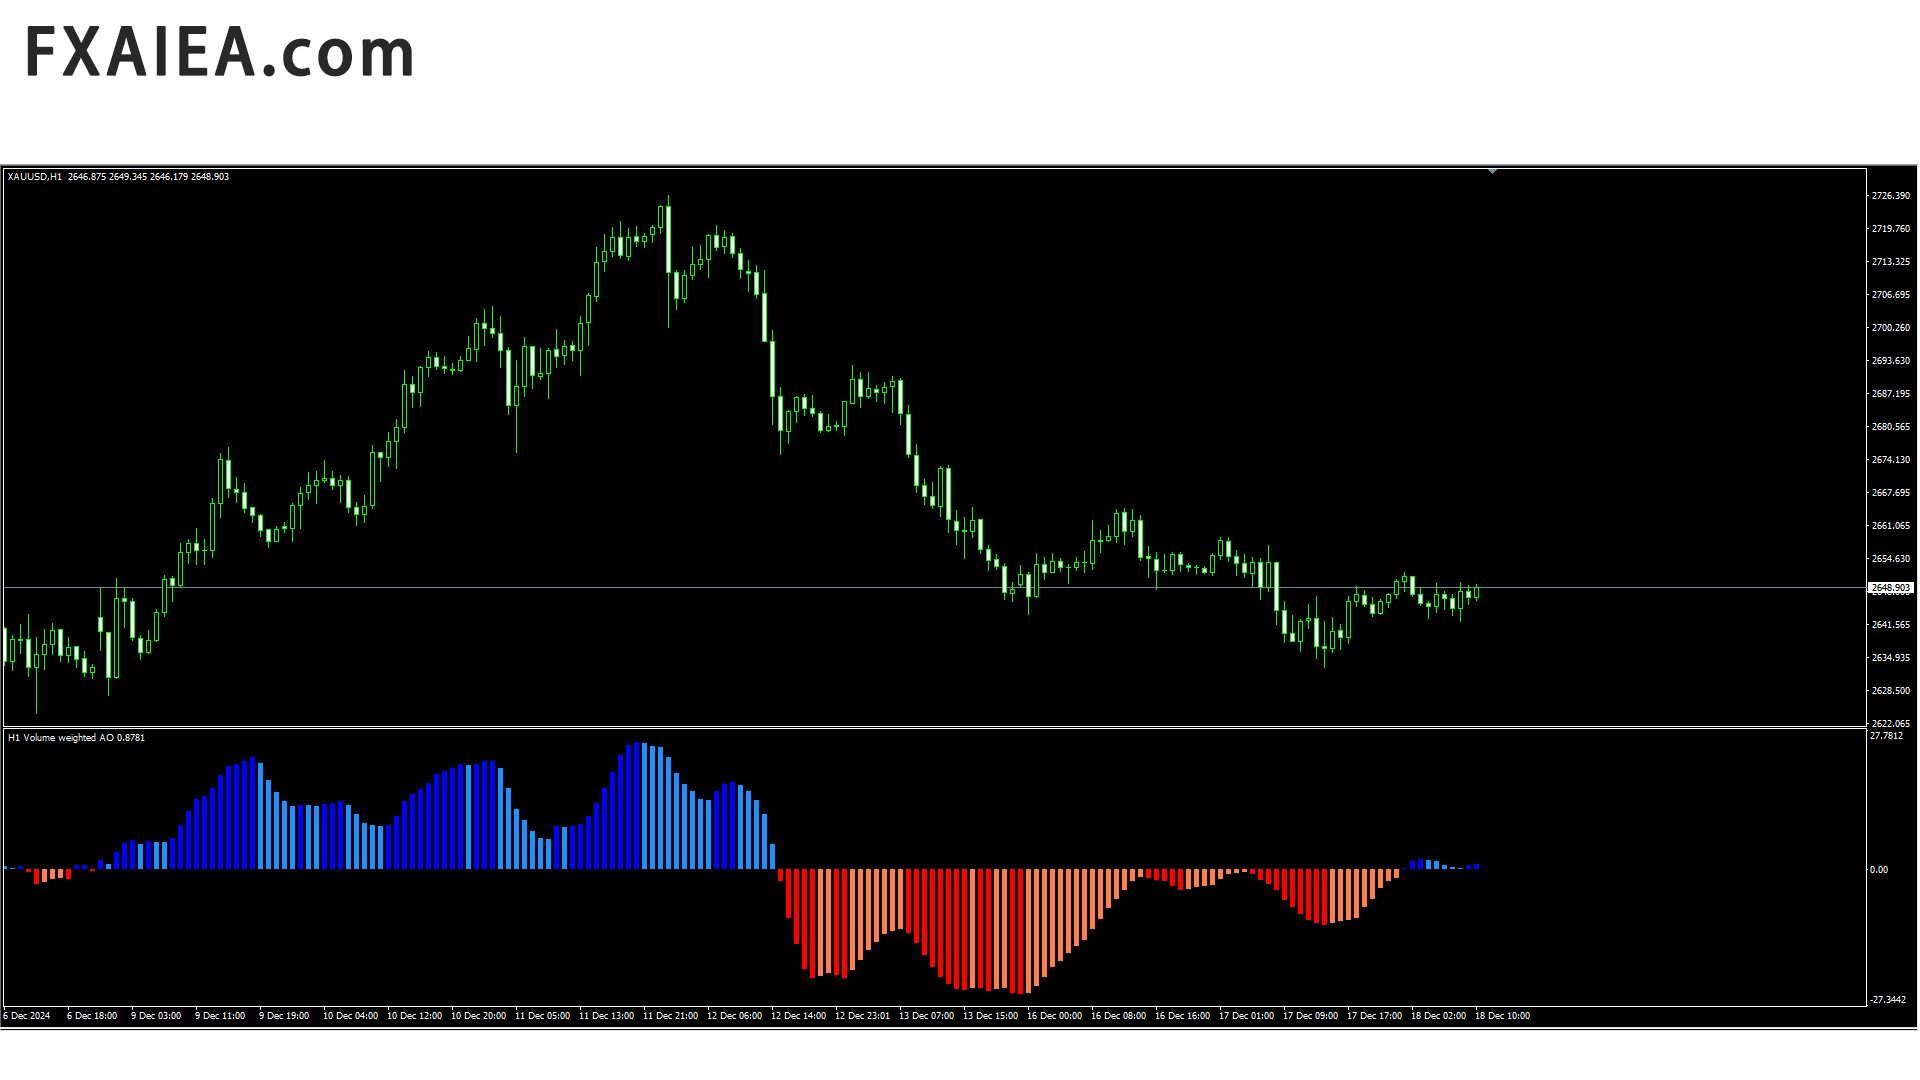
Color gradient meaning: The indicator mainly reflects the change of trading volume through color gradient. Generally speaking, lighter colors (such as light blue, light red, etc.) represent relatively low volume, which means that the market trading activity is low, and the buying and selling power is relatively balanced or weak; As the color gradually deepens (such as dark blue, dark red, etc.), it indicates that the volume is increasing, which may indicate that the market sentiment is changing, the balance of buying and selling power is beginning to be unbalanced, and more funds are flowing into the market to drive the price change. For example, in the foreign exchange market, if the Color of the AI Color Gradient Volume indicator on the chart of the euro/US dollar currency pair gradually changes from light red to dark blue, it may indicate that the trading activity of the currency pair increases significantly, and vice versa. With increased market attention, large price movements may be on the horizon, and traders need to pay close attention to changes in price movements and other technical indicators in order to find suitable trading opportunities.
Matching with price action: Observing the relationship between the color gradient of the indicator and the price action is the key to using this indicator. When the price rises, if the color of the volume also becomes darker, that is, the volume enlarges with the price rising, this is usually a positive signal, indicating that the market has strong bull power, the upward trend may have a certain continuity, traders can consider taking long or continue to hold long positions; On the other hand, if the price rises but the volume color becomes lighter or even stays at a low level, this may indicate a lack of upward momentum, the market may be about to face a correction or reversal, at this time traders should remain cautious and consider appropriate reduction or set a tight stop loss level. Similarly, in the process of price decline, the change of volume color can also provide a reference for judging the reliability of the downward trend. If the price decline is accompanied by the deepening of the volume color, it indicates that the short force is dominant and the downward trend may continue; If prices fall without a significant increase in volume, it may mean that the downtrend is not solid and the market could rebound at any time.
Fourth, trading signals and strategies

Trend judgment and following: Based on the color gradient trend of the indicator, traders can determine the overall trend direction of the market. If over a period of time, the volume color continues to remain in the darker area, and the price shows a clear upward or downward trend, this indicates that the market is in a strong unilateral trend. At this time, traders can adopt the trend following strategy, after the trend is confirmed, trade along the trend direction, that is, when the color continues to deepen and the price rises to buy on the dip, when the color continues to deepen and the price falls on the high short, and according to the change of the indicator color and the fluctuation rhythm of the price reasonably set the stop loss and stop profit, in order to obtain the profits brought by the trend market.
Reversal signal recognition: When the indicator's color gradient shows clear signs of reversal, such as a rapid change from a dark color to a light color, or a sudden start of darkening from a persistent light color, it may indicate that the market trend is about to reverse. Especially when this color reversal diverges from the price trend, the reliability of the reversal signal is higher. For example, the price keeps making new highs, but the volume color is gradually lightening, forming a top divergence pattern, which may be a signal that the market top is about to form, traders can consider gradually closing long positions, and at the right time to establish short positions; On the other hand, when the price keeps making new lows, but the volume color begins to darken, forming a bottom divergence pattern, it may be a signal of the bottom of the market, and traders can look for opportunities to buy dips.
Volatile market strategy: When the market is in a volatile range, the color of the indicator will usually fluctuate within a relatively narrow range, and there is no obvious continuous trend of darkening or lightening. At this time, traders can adopt a range trading strategy, near the upper and lower boundaries of the volatility range to sell high and buy low operations. When the price is close to the upper boundary of the shock range and the volume color is not significantly enlarged, you can consider selling; When the price is close to the lower boundary of the range and the volume color has not changed significantly, you can consider buying. At the same time, we should pay close attention to the sudden change in the color of the indicator, once the color breaks the sign of the shock range, it may indicate that the market will break through the shock pattern and enter a new trend market, at this time, it is necessary to adjust the trading strategy in time to follow the new trend direction.
5. Advantages and limitations

Advantages:
Intuitive visualization: The volume data is visually displayed on the chart through color gradient, so that traders can quickly and intuitively understand the fund dynamics and trading activity of the market, and can quickly grasp the changes in market sentiment without complex data analysis, which greatly improves the efficiency of trading decisions.
Intelligent algorithm has strong adaptability: Based on artificial intelligence algorithm, the index can automatically adapt to the changing characteristics of the volume of different market conditions and trading varieties. Whether it is in the mainstream market with high liquidity or in the niche market with relatively low liquidity, it can accurately reflect the real situation of the volume, and timely send effective trading signals, reducing the trouble that traders need to adjust the index parameters frequently due to market changes.
Comprehensive analysis ability: The combination of volume analysis and the visual effect of color gradient enables traders to analyze market information more comprehensively, not only focusing on the value of volume, but also obtaining more clues about the comparison of market buying and selling forces and the evolution of trends from the changing trend of color, so as to develop a more accurate and forward-looking trading strategy.
Limitations:
Risk of false signals: Although the indicator uses intelligent algorithms, some false signals may still be generated when the market experiences abnormal movements or is affected by sudden major events. For example, when sudden geopolitical events lead to instant panic selling or buying in the market, the volume may be dramatically amplified, and the color of the indicator will quickly become darker, but this situation may only be a short-term abnormal market reaction and does not necessarily represent a real change in the market trend, and traders may suffer losses if they blindly trade on these signals.
Reliance on volume data: The effectiveness of this indicator depends heavily on accurate volume data. However, in some markets, the volume data may be somewhat inaccurate or incomplete, especially in the over-the-counter (OTC) trading in the foreign exchange market, where the volume data is relatively less accurate than in centralized trading markets such as the stock market. In addition, some trading platforms may smooth the volume data or there are data delays and other issues, all of which may affect the accuracy and reliability of the indicators, leading traders to make wrong trading decisions.
Рекомендуем также
BoxProfile MT4
Evgeny Shevtsov
4.92 (12)
Индикатор отображает профили объёма по принципу вложенности. Периоды профилей предустановлены так, что каждый последующий профиль имеет протяжённость вдвое большую, чем протяжённость предыдущего профиля. Помимо профилей индикатор отображает кластеры объёма, отсортированные по цвету, в зависимости от содержащегося в них объёма. Особенности работы индикатора Индикатор работает на типовых таймфреймах от M5 до MN, но для вычислений использует исторические данные меньших таймфреймов: M1 - для таймфр
FREE
Этот индикатор сделан на основе дискретного преобразования Хартли. Использование этого преобразования позволяет применять разные подходы при обработке финансовых временных рядов. Отличительная особенность этого индикатора - его показания относятся не к одной точке на графике, а ко всем точкам периода индикатора. При обработке временного ряда индикатор позволяет выделять различные элементы временного ряда. На этом подходе построен первая возможность фильтрации - просто отбрасываются все ненужные
SX Supply Demand Zones accurately identifies and draws high-probability Supply and Demand zones using a sophisticated algorithm. Unlike traditional indicators that clutter your chart, this indicator is designed with a focus on performance and a clean user experience. New Unique Feature: Interactive Legend System What truly sets this indicator apart from everything else is the Interactive Control Legend. You have a professional dashboard directly on your chart that allows you to: Show/Hide: Ins
FREE
Индикатор   Visual Volatility Clustering   кластеризирует рынок на основе волатильности. Индикатор не перерисовывает и дает точные данные, не использует цены закрытия. Использует цены открытия или цены максимумов или минимумов но предыдущего завершенного бара. Поэтому вся информация будет четкой и однозначной. Суть индикатора – разделить рынок цены на определенные участки по схожему типу волатильности. Это можно делать как угодно. В данном примере индикатор сконфигурирован на временной период W
Simple QM Pattern
Suvashish Halder
4.5 (2)
Simple QM Pattern is a powerful and intuitive trading indicator designed to simplify the identification of the Quasimodo (QM) trading pattern. The QM pattern is widely recognized among traders for effectively signaling potential reversals by highlighting key market structures and price action formations. This indicator helps traders easily visualize the QM pattern directly on their charts, making it straightforward even for those who are new to pattern trading. Simple QM Pattern includes dynamic
FREE
Hurst Buy and Sell Mt4
Victor Alfonso Molina Botello
Hurst Buy and Sell  This innovative indicator, inspired by xAI Grok intelligence, uses the Hurst exponent to identify the nature of the market and generate buy/sell signals. The EA for this indicator (Hurst Razer PRO EA MT5) is now available, you can see it by clicking here!  https://www.mql5.com/es/market/product/153441?source=Site+Profile+Seller  If you want more signals from the indicator, change the minimum number of bars between consecutive signals. The lower the value, the more signals it
FREE
Индикатор (включает в себя  Volume Profile + Order Blocks)   - революционный индикатор, объединяющий две мощнейшие концепции современного технического анализа: профили объемов и блоки заказов институциональных игроков. Этот инструмент позволяет видеть то, что скрыто от большинства трейдеров, и дает существенное преимущество на рынке. Ключевые преимущества индикатора: Визуализация "умных денег" : Наглядно показывает зоны концентрации крупных игроков, выделяя области с максимальным объемом яркими
Everyday trading represents a battle of buyers ("Bulls") pushing prices up and sellers ("Bears") pushing prices down. Depending on what party scores off, the day will end with a price that is higher or lower than that of the previous day. Intermediate results, first of all the highest and lowest price, allow to judge about how the battle was developing during the day. It is very important to be able to estimate the Bears Power balance since changes in this balance initially signalize about possi
DracoAI is a revolutionary automated forex trading robot based on neural network.  Loss coverage is our premium exclusive feature. DracoAI IS: THE BEST MONEY MAKING SERVICE & STABLE PASSIVE INCOME PROFIT, EVEN IF YOU DO NOT PARTICIPATE IN BIDDING FINANCIAL INDEPENDENCE AND STABILITY DracoAI IS SAFE, BECAUSE: WE GUARANTEE THE SAFETY OF YOUR FUNDS NEGATIVE RESULTS OF TRADING ARE COVERED BY OUR RESERVE FUND 100% CONFIDENTIALITY Monitoring  - most popular signal at MQL5 :  https://www.mql5.com/en/s
Market Profile 3
Hussien Abdeltwab Hussien Ryad
3 (2)
Market Profile 3 MetaTrader 4 indicator  — is a classic Market Profile implementation that can show the price density over time, outlining the most important price levels, value area, and control value of a given trading session. This indicator can be attached to timeframes between M1 and D1 and will show the Market Profile for daily, weekly, monthly, or even intraday sessions. Lower timeframes offer higher precision. Higher timeframes are recommended for better visibility. It is also possible t
FREE
The indicator allows you to trade binary options. The recommended time frame is М1 and the expiration time is 1,2,3 minutes. The indicator suitable for auto and manual trading. A possible signal is specified as a arrows above/under a candle. You should wait until the candle closes! Arrows are not re-painted Trade sessions: TOKYO section (Half-end) Currency pairs: USD/JPY Working time frame: M1 Expiration time: 1,2,3 minutes. The indicator also shows good results when using the martingale strateg
FREE
TPO Profile MT4
Kyra Nickaline Watson-gordon
5 (1)
Definition : TPO is a Time Price Opportunity. Instead of using bars or candles with an Open, High, Low, and Close price, each "bar" in a Market Profile is represented by horizontal bars against the price It is called Market Profile terminology. In other words time-price-opportunity (TPO) profiles are histograms of how much time was spent at each price within the span of the profile. By using a TPO chart, you are able to analyze the amount of trading activity, based on time, for each price level
Эксперт Deep Analyst (mt5 https://www.mql5.com/ru/market/product/163998) Deep Analyst   — это профессиональный аналитический инструмент, использующий специализированный алгоритм для глубокого анализа рыночных циклов и амплитудных колебаний цены. Анализируя рыночную ситуацию за определенный временной промежуток, эксперт определяет силу и амплитуду цен с помощью уникальной индикационной системы, работающей исключительно на основе реальных данных. При изменении глобального тренда и его вектора, ал
Индикатор объема Effect Volume , на рынке Форекс объемы своеобразные (тиковые). Этот индикатор объема демонстрирует уровень финансовой и эмоциональной вовлеченности. Когда индикатор формирует новую вершину, это говорит о том, что покупатели сильнее продавцов за определенный период времени. Если же индикатор снижается, это говорит о том, что сильнее оказываются медведи. Почему на Форекс невозможно отследить нормальные объемы? Дело в том, что это внебиржевой рынок. Следовательно, подсчитать объе
Ugenesys AI MT4
Odaine Ramon Mcmillan
5 (1)
uGenesys AI - 90% Accurate Daytrading Indicator Introducing the ultimate forex trading indicator system, uGenesys AI, powered by cutting-edge AI technology and advanced analytical techniques, including Time-Series Analysis and Genetic Algorithms. Our AI-powered trading system leverages the power of time-series analysis to identify trends and patterns in historical price data, allowing traders to make informed predictions about future market movements. By analyzing vast amounts of data, our syst
Introducing the Delta Volume Profile Indicator - Unleash the Power of Institutional Precision!  Technical Indicator: Are you ready to trade like the pros? The Delta Volume Profile Indicator is no ordinary tool. It’s a high-precision, cutting-edge indicator that puts the power of institutional-grade trading in your hands. This unique indicator analyses delta volume distribution in real-time, revealing the market's hidden buy/sell imbalances that the biggest financial institutions rely on to antic
Индикатор Supply Demand использует предыдущее ценовое действие для выявления потенциального дисбаланса между покупателями и продавцами. Ключевым является определение зон с лучшими возможностями, а не просто вероятностей. Индикатор Blahtech Supply Demand обеспечивает функционал, не доступный ни в одной платформе. Этот индикатор 4 в 1 не только выделяет зоны с более высокой вероятностью на основе механизма оценки силы по множественным критериям, но также комбинирует его с мульти-таймфреймовым анал
Enhanced Volume Profile: The Ultimate Order Flow & Liquidity Analysis Tool Overview Enhanced Volume Profile   is an indicator for MetaTrader 5 that displays the traded volume at specific price levels over a defined period. It separates the total volume into buy and sell components, presenting them as a side-by-side histogram on the chart. This allows users to observe the volume distribution and the proportion of buy and sell volumes at each price level. Graphics Rendering The indicator uses t
FREE
Индикатор анализирует волновую структуру рынка. Что показывает на графике: 1. Волновые пивоты (семафоры) Красные значки - максимумы волн Желтые значки - минимумы волн Желто-зеленые значки - дополнительные локальные экстремумы 2. Линии трендов Фиолетовые/синие линии - тренды по максимумам (сопротивление/поддержка) Бежевые/зеленые линии - тренды по минимумам Линии автоматически строятся, соединяя волновые пивоты одного типа 3. Главная трендовая линия Красная линия - прогнозная линия основного трен
Reverse side scalper is the manual trading system, that works on choppy(anti-trend) market. As a rule markets are on 80% choppy and only 20% is trend phase. System is based on custom step Moving and RSI and reverse pattern. System defines up movement, down movement, trend / choppy phases. Indicator plots Buy signal arrow when current direction is down and phase is trend, Sell signal arrow is plotted when currently is up movement and phase is trend. As a rule it allows to "catch" local maximum/mi
Если вам нравится этот проект, оставьте 5-звездочный обзор. Данный показатель рисует открытые, высокие, низкие и закрывающие цены на указанные период и его можно отрегулировать для специфического часового пояса. Это важные уровни, которые выглядят многие институциональные и профессиональные трейдеры и могут быть полезны для вас, чтобы знать места, где они могут быть больше активный. Доступные периоды: Предыдущий день. Предыдущая неделя. Предыдущий месяц. Предыдущий квартал. Предыдущий год. Или
FREE
Volume DeltaPanel - это мощный индикатор, распознающий предложение на рынке. Он рассчитывает дельту от движения цены и разницу объемов ПОКУПОК и ПРОДАЖ. Объемы прибавляются к цене и нормализуются в пункты символа. Его особая структура позволяет вам применять все таймфреймы, имеющиеся на платформе MT4. Панель может одновременно отображать 28 инструментов, все из которых можно настроить под требования брокера. Хороший обзор инструментов позволяет найти превосходные точки входа и возможные разворот
Ska ZigZag BuySell
NKATEKO VUKOSI LEROY MASANGO
Ska ZigZag BuySell indicator determines the overbought and oversold regions within a trend. The indicator determines the overbought region by the candlestick high and the oversold region by the candlestick low. This indicator only gives signals with arrow and audible alerts each and every time when a new candlestick appear. To utilize the full strategy i recommend using "Ska ZigZag BuySell" together with "Ska ZigZag Line". The Ska ZigZag Line indicator is available for free. NOTE: Indicator is h
Ночной Призрак - Стрелочный индикатор для Бинарных опционов. Это надежный помощник вам в будущем! -Отсутствует перерисовка на графике -Работает отлично на валютных парах EUR/USD! -Точность индикатора до 90% (Особенно ночью) -Не нужно долго настраивать (Настроено идеально для Бинарных Опционов) -Не опаздывающие сигналы -Появление сигнала на текущей свече -Идеально подходит для периода М1 (Не Больше!) -Удобный для глаз цвет свечей (Красный и Синий) -Установлен Алерт  Работа с ним: -Синяя стрелка
In the age of speed, everyone wants to gets what he/she wants quickly. Trading is all about gaining money, and scalping is a way of doing it in a short time. The "Scorpion Scalper Pro" has been named on the scorpion because of its speed. The indicator serves to provide signals for the M15 timeframe. It also sends Alerts (window alert, email alert, push notification alert) whenever a buy/sell signal occurs, and the alerts are customizable (they can be turned ON or OFF). Indicator inputs : - Buy
️ Real Flow Defense Levels: Уровни Защиты Высокого Воздействия Индикатор Real Flow Defense Levels — это проприетарный инструмент, разработанный для выявления и построения значимых ценовых зон с высокой уверенностью непосредственно на вашем основном торговом графике. Он использует динамический, основанный на объеме анализ для определения того, где рынок ранее демонстрировал самую сильную защиту или концентрацию активности . Эти построенные линии служат динамическими уровнями поддержки и сопроти
NEXT price Actions - Daily Pivots 1. Auto Mapping Projection Price Action XAUUSD to get the most accurate setup for each Entry Lines. 2. The tool used has been customized according to Swap Pivots setup. 3. The setup that results after Mapping is suitable for Intraday 4. This setup does not need a marking and depends on SNR & SND. 5. This setup only depends 100% on the tool used. 6. This setup is very suitable for getting an Entry in a shadow candle stick. 7. This setup will also follow th
TMA AI Bands
Monique Ellen Miranda Dos Santos
Индикатор TMA AI Bands основан на Треугольной скользящей средней (TMA) с динамическими верхними и нижними полосами и четкими стрелками покупки/продажи, нанесенными непосредственно на график. Он оснащен интегрированным ИИ для адаптивной оптимизации и гарантирует отсутствие перерисовки, предоставляя точные сигналы разворота при касании цены полос. * Пары: работает со всеми валютными парами * Рекомендуемые таймфреймы: D1 / W1 / MN * Настраиваемые внешние переменные:   * TimeFrame – период расч
Данный индикатор предназначен для гармонических трейдеров. Он ищет гармонические паттерны и помогает найти сформировавшиеся паттерны посредством анализа исторических рыночных данных. Индикатор распознает следующие паттерны: AB=CD Butterfly (Бабочка) Gartely (Гартли) Crab (Краб) Bat (Летучая мышь) Индикатор отображает следующее: Завершенные паттерны с критической зоной, выделенной серым Три предполагаемых уровня тейк-профита (зеленого цвета) Предполагаемый уровень стоп-лосса (красного цвета) Отно
Adjustable Consecutive Fractals  looks for 2 or more fractals in one direction and sends out a on screen alert, sound alert and push notification, for strong reversal points . Adjustable Consecutive Fractals, shows the fractals on chart along with a color changing text for buy and sell signals when one or more fractals appear on one side of price. Adjustable Consecutive Fractals is based Bill Williams Fractals . The standard Bill Williams fractals are set at a non adjustable 5 bars, BUT withe th
С этим продуктом покупают
Индикатор Miraculous – 100% ненарисовывающийся инструмент для Форекс и бинарных опционов, основанный на Квадрате Девяти Ганна Это видео представляет индикатор Miraculous – высокоточный и мощный торговый инструмент, специально разработанный для трейдеров Форекс и бинарных опционов. Что делает этот индикатор уникальным, так это его основа на легендарном Квадрате Девяти Ганна и Законе вибрации Ганна , что делает его одним из самых точных инструментов прогнозирования, доступных в современном трейдин
Precautions for subscribing to indicator This indicator only supports the computer version of MT4 Does not support MT5, mobile phones, tablets The indicator only shows the day's entry arrow The previous history arrow will not be displayed (Live broadcast is for demonstration) The indicator is a trading aid Is not a EA automatic trading No copy trading function The indicator only indicates the entry position No exit (target profit)  The entry stop loss point is set at 30-50 PIPS Or the front hi
BinaryIndicator - высокоточный индикатор для торговли бинарными опционами. Отличные результаты показывает при скальпинге. Основу данного индикатора составляет многофакторный анализ трендовых индикаторов, а также подтверждающих осцилляторов, что в итоге дает повышенную точность сигналов. Преимущества индикатора Повышенная точность сигналов; Показывает отличные результаты при торговле бинарными опционами с временем экспирации от M30 до M1 ; Работает на любых временных интервалах; Работает с любым
Rtc ML Ai | Predictor CORE MACHINE LEARNING ENGINE Adaptive ML Market Predictor – Multi-Bar Trend & Candle Forecast What This Indicator Does This indicator is a  real-time market prediction engine  designed to analyze price behavior and estimate  future market tendencies . Unlike conventional indicators, this system  does not rely on static parameters or historical curve-fitting , but adapts its internal state dynamically during live market operation. Instead of using static rules, the indic
Индикатор FFx Engulfing Setup Alerter дает торговые рекомендации по входу в рынок, TP 1, TP 2 и SL. Предлагаются следующие варианты: Рекомендации по входу - количество пипсов, которые будут добавлены после перелома для входа в рынок 3 различных варианта расчета SL - по пипсам, с использованием множителя ATR или по модели High/Low. 3 различных варианта расчета двух TP - по пипсам, с использованием множителя ATR или соотношения Риск/Прибыль Смещение панели - любое положение на графике Рекомендации
Индикатор FFx InsideBar Setup Alerter дает торговые рекомендации по входу в рынок, TP 1, TP 2 и SL. Предлагаются следующие варианты: Рекомендации по входу - количество пипсов, которые будут добавлены после перелома для входа в рынок Минимальный размер свечи - чтобы избежать предложения слишком близких точек входа на рынок для buy/sell 3 различных варианта расчета SL - по пипсам, с использованием множителя ATR или по модели High/Low 3 различных варианта расчета двух TP - по пипсам, с использовани
Индикатор FFx OutsideBar Setup Alerter дает торговые рекомендации по входу в рынок, TP 1, TP 2 и SL. Предлагаются следующие варианты: Рекомендации по входу - количество пипсов, которые будут добавлены после перелома для входа в рынок. 3 различных варианта расчета SL - по пипсам, с использованием множителя ATR или по модели High/Low. 3 различных варианта расчета двух TP - по пипсам, с использованием множителя ATR или соотношения Риск/Прибыль. Смещение панели - любое положение на графике. Рекоменд
Индикатор FFx PinBar Setup Alerter дает торговые рекомендации по входу в рынок, TP 1, TP 2 и SL. Предлагаются следующие варианты: Рекомендации по входу - количество пипсов, которые будут добавлены после перелома для входа в рынок Минимальный размер свечи - во избежание слишком маленьких свечей 3 различных варианта расчета SL - по пипсам, с использованием множителя ATR или по модели High/Low 3 различных варианта расчета двух TP - по пипсам, с использованием множителя ATR или соотношения Риск/Приб
Целью этой новой версии стандартного MT4 индикатора, входящего в поставку платформы, является отображение в подокне нескольких таймфреймов одного и того же индикатора и его расхождений. См. пример, приведенный на рисунке ниже. Однако индикатор отражается не как простой индикатор MTF. Это реальное отображение индикатора на его таймфрейме. Доступные настройки в индикаторе FFx Divergences: Выбор таймфрейма для отображения (от M1 до MN) Установка ширины (количество баров) для каждого окна таймфрейма
Целью этой новой версии стандартного MT4 индикатора, входящего в поставку платформы, является отображение в подокне нескольких таймфреймов одного и того же индикатора и его расхождений. См. пример, приведенный на рисунке ниже. Однако индикатор отражается не как простой индикатор MTF. Это реальное отображение индикатора на его таймфрейме. Доступные настройки в индикаторе FFx Divergences: Выбор таймфрейма для отображения (от M1 до MN). Установка ширины (количество баров) для каждого окна таймфрейм
Индикатор FFx Dashboard MTF Alerter показывает все тайфреймы (от M1 до месячного) на одном графике, отображая статус каждого из них. Два варианта оповещения: Один таймфрейм: при появлении сигнала индикатор генерирует оповещение для каждого выбранного таймфрейма по-отдельности Мульти-таймремовый вариант: сигнал должен быть подтвержден на всех выбранных таймфреймах для появления оповещения Для обоих вариантов есть возможность выбора таймфреймов во входных параметрах для генерации алертов. Интерп
Торговая система для ручной торговли The [GRAFF] III основана на многочисленных индикаторах MetaTrader (MT4). Собранные вместе, эти индикаторы представляют собой эффективный торговый инструмент. Система включает в себя более 20 различных пользовательских индикаторов, которые были тщательно отобраны и протестированы на длительном историческом периоде. Каждый конкретный индикатор основан на той или иной формуле расчета. Таким образом вся система настроена таким образом, чтобы отсеивать ложные сигн
FFx Universal Strength Meter PRO не просто измеряет силу. Помимо расчета цены, он располагает 19 встроенными режимами + 9 таймфреймов. С индикатором FFx USM вы сможете определить любой период для любого сочетания таймфреймов. Например, вы можете установить панель для последних 10 свечей для M15-H1-H4… Настройки очень гибкие! Индикатор прост в работе... Он выдает информацию по силе и слабости валют, позволяя вам находить наиболее подходящие пары для торговли. Пример: Если EUR сильна, а USD слаба,
Pan PrizMA CD Phase аналог индикатора из МetaТrader 5 , является опцией построенной на базе индикатора Pan PrizMA . Подробнее . Усреднение полиномом второй-четвертой степени повышает гладкость линий, добавляет инерцию и соответственно ритмичность. Экстраполяция функцией синусоиды около константы позволяет регулировать запаздывание или опережение. Значение фазы - параметра состояния волны (близко по смыслу тригонометрической фазе или углу поворота радиус-вектора в тригонометрической плоскости) по
Индикатор отображает в отдельном окне разность между количеством пунктов, которые увеличили цену, и количеством пунктов, которые уменьшили цену за заданный в настройках интервал времени. Временной интервал, за который проводится расчет, выражается в количестве баров графика, на который индикатор прикреплен. Данный подход позволяет оценить в какую сторону (рост или падение) движется цена инструмента, силу движения и величину движения в пунктах. В работе индикатор использует только тики поступающи
Версия для MetaTrader 5 доступна здесь : https://www.mql5.com/ru/market/product/24882 FFx Basket Scanner ищет до пяти индикаторов среди 16 доступных на всех парах и таймфреймах. Таким образом вы можете ясно увидеть торговли по каким валютам следует избегать, а на каких сосредоточить внимание. Когда валюта переходит в экстремальную зону (например, 20/80%), вы можете торговать всей корзиной с большей уверенностью. Другая область применения индикатора – определение сильных и слабых валют для поиск
NostradamusMT4
Andrey Spiridonov
1 (1)
NostradamusMT4 - мощный индикатор из набора профессионального трейдера. В основе индикатора лежит авторский метод Андрея Спиридонова расчета цены (ESTIMATED PRICE) для текущей цены свечи. Преимущества Индикатор не перерисовывается; Работает на любых временных интервалах; Работает с любыми торговыми инструментами; Отлично подходит для скальпинга и торговли бинарными опционами. Параметры Color - цвет линии ESTIMATED PRICE FUTURE . Порядок работы с индикатором Индикатор формирует расчетную цену
Версия для MetaTrader 5 доступна здесь: https://www.mql5.com/ru/market/product/25794 FFx Pivot SR Suite PRO - это полный набор инструментов для построения уровней поддержки и сопротивления. Поддержка и сопротивление - самые используемые уровни во всех видах торговли. Их можно использовать для поиска разворотов тренда, установки уровней тейк-профита и стоп-лосса и т.д. Индикатор можно полностью настроить непосредственно с графика Выбор из 4 периодов для расчетов: 4-часовой, дневной, недельный и
BinaryScalping - профессиональный индикатор для торговли бинарными опционами и скальпинга. Алгоритм работы индикатора основан на расчете опорных точек ( Pivot) для каждого временного периода отдельно, анализируется расположение цены торгового инструмента относительно опорных точек и вычисляется вероятность совершения торговой операции. В индикатор встроен фильтр торговых сигналов по глобальному тренду. Индикатор устанавливается обычным образом и работает с любым торговым инструментом. На графике
Другие продукты этого автора
本EA通过智能AI程序筛选符合条件的订单,以毫秒级极速按使用者任意条件进行平仓; 帮助交易员快速 平盈利单:平仓该图表品种所有盈利的单,获得利润; 帮助交易员快速 平亏损单:平仓该图表品种所有亏损的单,截断亏损; 帮助交易员快速 SELL平仓:平仓该图表品种所有SELL的单,快速解套锁仓; 帮助交易员快速 BUY平仓:平仓该图表品种所有BUY的单, 快速解套锁仓; 帮助交易员快速 全部平仓:平仓该图表品种所有单,快速落袋为安。 智能快速平仓面板:共五个按钮 平盈利单:平仓该图表品种所有盈利的单 平亏损单:平仓该图表品种所有亏损的单 SELL平仓:平仓该图表品种所有SELL的单 BUY平仓:平仓该图表品种所有BUY的单 全部平仓:平仓该图表品种所有单
Автоматическая стопорная потеря: EA использует продвинутую программу искусственного интеллекта, Отслеживание графических заказов в реальном времени, Точное попадание заказа на сделку с картой, загруженной EA, EA автоматически добавляет беспрерывный ущерб заказу по отношению к установленному сбросу, Существенно экономия трейдеров на то время, которое они заказывают, автоматически добавляется в EA после того, как она будет добавлена Также добавьте защитное ограждение для трейдеров, которые
The main function of this EA: use AI to quickly capture the price of the order, batch modify the stop profit and stop loss to the specified price position. For example, you have 5 buy orders for XAUUSD, and the opening prices are 2510, 2508, 2506, 2504, 2495 respectively. You can modify the stop profit to 2530 and the stop loss to 2480 through this EA batch. Good luck with your deal! Wechat: FX-AIEA QQ: 2813871972 Email: lxy284628@163.com Wechat public account: Xinyou Jinke FXAIEA.com Welcome
江恩理论 江恩理论是金融市场分析中的一种重要工具,它基于市场周期性和自然法则的假设,通过特定的技术分析工具来预测市场走势。江恩理论的主要内容包括: 市场周期 :江恩认为市场存在周期性波动,这些周期可以通过特定的时间周期和价格周期来识别。 价格和时间 :江恩理论强调价格和时间之间的相互作用,认为两者是市场分析的关键要素。 江恩角度线 :这是江恩理论中的一种重要技术分析工具,用于识别市场的支撑和阻力水平。 江恩轮中轮 :又称“江恩圆形图”,是江恩发明的另一种重要技术分析工具,用于预测市场的未来走势。 量化分析 :T3指标可能通过特定的数学模型或算法来量化市场的行为或特征。 趋势识别 :T3指标可能用于识别市场的趋势方向,包括上升趋势、下降趋势或横向整理。 交易信号 :基于T3指标的分析,投资者可能能够获得买入或卖出的交易信号。
Arbitrage Indicators is a professional and easy-to-use Forex trading indicator that uses the best trading principles of the latest AI arbitrage models. This indicator provides accurate buy and sell signals. Applies to currency pairs only. It has six different metrics options, MACD, KDJ, RSI, CCI, RVI, DEMARK. It can be freely switched by users, and intuitively shows the direction and reversal signal of the currency pair. When the two lines cross colors, the currency has a high probability of rev
AI Fibonacci Indicators (Non-Redraw) is a professional and easy-to-use AI fully automated Fibonacci generator Forex trading indicator that uses the latest AI technology to automatically identify accurate Fibonacci positions on charts and automatically plot them on charts. This indicator provides accurate Fibonacci important price positions. Applicable to any currency pair and other products. It has seven function switches, There are five different Fibonacci types (" Fibonacci retracement line "
Two line MACD index composition MACD line (express line) : Usually calculated by subtracting the 12-cycle EMA from the 26-cycle EMA, it is more sensitive to price changes, can quickly reflect the change of the recent price trend, its fluctuation is relatively frequent, used to capture the dynamics of short-term market trends. Signal line (slow line) : Generally a 9-cycle EMA of the MACD line, its role is to smooth the MACD line, filter out some short-term noise and false signals, make the indic
AI Supertrend timely alerts MT4 Super Trend timely reminder indicator introduction I. Overview of indicators The MT4 Super Trend Alert Indicator is a technical analysis tool specifically designed for the MetaTrader 4 platform to help traders accurately capture changes in market trends and send timely signals to alert traders to potential trading opportunities. It is based on a unique AI-based algorithm that takes into account factors such as price volatility, trend strength, and market volatil
MT4 platform AI T3 MA Super Fill indicator use introduction I. Overview of indicators The AI T3 MA Super Fill indicator is a powerful analytical tool that combines advanced algorithms and T3 moving average technology to provide traders on the MT4 platform with accurate market trend judgments and trading signals. It uses intelligent algorithms to deeply process the price data, and displays the changes of the T3 moving average in a unique way to help traders more effectively grasp the market dyn
MT4CandleTime index introduction MT4CandleTime is an indicator for the MT4 platform, which can display the remaining time of the current K line in the form of an intuitive digital countdown, which is convenient for traders to grasp the trading rhythm. Precise time control: The MT4CandleTime indicator provides traders with extremely accurate K-line remaining time data, enabling them to fine manage the time rhythm in the trading process, avoiding the hasty or delayed trading decisions caused by
MT4 ATR Stops indicator introduction: This is a dynamic support resistance indicator based on average true volatility (ATR) that calculates the volatility of the price, plots the channel on a K chart, and suggests trading timing with intuitive color and dot-like signals. Open and close positions 1. Go long (go long) Signal feature: The color of the K line changes to green, and a green dot appears on the chart. Logic: Price broke above the dynamic upper track resistance calculated by ATR, indica
This "MT4 Auto Delete Pending Orders by Timeframe" EA is a high-tech trading efficiency tool designed for modern traders. It does not perform any trading or decision-making. ​ It fundamentally solves the core pain point in traditional trading where forgotten pending orders or sudden market changes lead to tied-up capital and missed new opportunities, by automatically managing order expiration . ️ Core Working Principle: Intelligent Pending Order Management The core of this EA lies in its intell
MT4 Time-Based Auto Close System EA ​ is an intelligent time-algorithm-based automated order management trading tool. Utilizing a high-tech decision-making engine, it automatically executes precise closing operations when preset holding periods expire, designed to help traders maintain strict trading discipline and avoid emotional interference   . Core Closing Modes The five core closing modes you mentioned form the cornerstone of this EA's strategic logic, allowing flexible configuration base
The main function of this EA: Quick batch modification stop profit stop loss to the specified price position. For example: you have five XAUUSD  BUY orders, the opening price is 2510, 2508, 2506, 2504, 2495you can through this EA, batch unified change the profit is 2530, stop loss is 2480.Good luck with your deal! Wechat:FX-AIEA QQ:2813871972 Email:lxy284628@163.com Wechat public account: Xinyou Jinke FXAIEA.com Welcome to your attention ( Xinyou Jinke FXAIEA.com) Around A1, big data, cloud com
Arrow Trend indicators Trading with the trend is often one of the most basic pieces of advice given by experienced traders. In addition, experienced traders will often advise traders to prioritize the long-term trend, as prices usually follow the direction of the long-term trend. Arrow trend indicators are tools that traders can use to determine the direction of a trend toward a long-term trend. What is an arrow trend indicator? An arrow trend indicator is a trend-following technical indicator
This EA will not automatically open the position, open the position needs the user manually!! MT5 position profit/loss up to the set amount of automatic closing EA\n will open the position is the apprentice, will close the position is the master, when all your order profit reaches the amount you set, the ea will automatically help you to close the position in bulk, the loss value will also be all closed Recommended time frame: Any time frame will work, but we like to use the M5, M15, M30 and H1
This "MT5 Auto Delete Pending Orders by Timeframe" EA is a high-tech trading efficiency tool designed for modern traders. It does not perform any trading or decision-making. ​ It fundamentally solves the core pain point in traditional trading where forgotten pending orders or sudden market changes lead to tied-up capital and missed new opportunities, by automatically managing order expiration . ️ Core Working Principle: Intelligent Pending Order Management The core of this EA lies in its intell
MT5 Time-Based Auto Close System EA ​ is an intelligent time-algorithm-based automated order management trading tool. Utilizing a high-tech decision-making engine, it automatically executes precise closing operations when preset holding periods expire, designed to help traders maintain strict trading discipline and avoid emotional interference   . Core Closing Modes The five core closing modes you mentioned form the cornerstone of this EA's strategic logic, allowing flexible configuration base
Фильтр:
Нет отзывов
Ответ на отзыв