Macd Kolay Al Sat

Certainly. Here's the explanation in English:

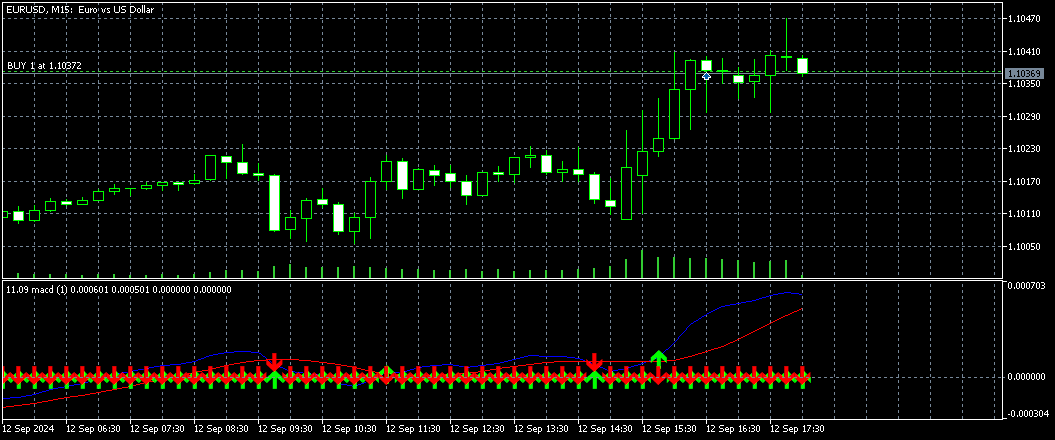
This program is a custom indicator that calculates the MACD (Moving Average Convergence Divergence) and shows the crossovers between the MACD and Signal lines. Here are the main functions of the program:

  1. MACD Calculation:

    • Calculates the difference between the Fast EMA (Exponential Moving Average) and Slow EMA.
    • This difference forms the MACD line.
  2. Signal Line Calculation:

    • Creates the Signal line by taking a simple moving average (SMA) of the MACD values.
  3. Indicator Drawing:

    • Draws the MACD line in blue.
    • Draws the Signal line in red.
    • Calculates a histogram showing the difference between MACD and Signal lines (though this is not plotted).
  4. Crossover Detection and Marking:

    • Places a green up arrow at points where the MACD line crosses above the Signal line (Bullish Crossover).
    • Places a red down arrow at points where the MACD line crosses below the Signal line (Bearish Crossover).
  5. Separate Window Display:

    • The indicator is displayed in a separate window below the main price chart.
  6. Parameters:

    • Users can adjust the periods for Fast EMA, Slow EMA, and Signal SMA.

This indicator can be used to identify trend changes and potential buy/sell points:

  • Green up arrow (Bullish Crossover): MACD crossing above the Signal line may indicate the beginning of an uptrend and a potential buying opportunity.
  • Red down arrow (Bearish Crossover): MACD crossing below the Signal line may indicate the beginning of a downtrend and a potential selling opportunity.


推荐产品
Renko System
Marco Montemari
This indicator can be considered as a trading system. It offers a different view to see the currency pair: full timeless indicator, can be used for manual trading or for automatized trading with some expert advisor. When the price reaches a threshold a new block is created according to the set mode. The indicator beside the Renko bars, shows also 3 moving averages. Features renko mode median renko custom median renko 3 moving averages wicks datetime indicator for each block custom notification
Секвента Демарка (Sequential) - индикатор, демонстрирующий развитие тренда, его структуру. Довольно точно отображает начальную и конечную точки, важные точки перелома. Срабатывает по открытию свечи, поэтому перерисовок не будет никогда. Здесь нет сложных формул, только статистика, отсчёт свечей, выбранных по определённым критериям. При этом индикатор может давать очень точные сигналы для входа, особенно при поддержке какого-нибудь индикатора уровней, например, этого . Алгоритм нахождения сигнала
The   Trendlines Oscillator   helps traders identify trends and momentum based on the normalized distances between the current price and the most recently detected bullish and bearish trend lines. The indicator features bullish and bearish momentum, a signal line with crossings, and multiple smoothing options. USAGE The   Trendlines Oscillator   works by systematically: Identifying pivot highs and lows. Connecting pivots to form bullish (support) and bearish (resistance) trendlines. Measuring
Donchian Channel DC
Renato Takahashi
Donchian Channel DC is the indicator of Donchian Channels, that plots maximum and minimum values of a specific period, besides mean value line. It´s possible to configure simple period for analysis and the indicator will plot all three values. You can trade with this indicator as trend or reversal, according to each strategy. Do not let to test others indicators as soon as others expert advisors.
All about time and price by ICT. This indicator provides a comprehensive view of ICT killzones, Silver Bullet times, and ICT Macros, enhancing your trading experience.  In those time windows price either seeks liquidity or imbalances and you often find the most energetic price moves and turning points. Features: Automatic Adaptation: The ICT killzones intelligently adapt to the specific chart you are using. For Forex charts, it follows the ICT Forex times: In EST timezone: Session: Asia: 20h00-0
Gekko MACD Plus
Rodrigo Galeote
3 (3)
Type: Oscillator This is Gekko's Cutomized Moving Average Convergence/Divergence (MACD), a customized version of the famous MACD indicator. Use the regular MACD and take advantage of several entry signals calculations and different ways of being alerted whenever there is potential entry point. Inputs Fast MA Period: Period for the MACD's Fast Moving Average (default 12); Slow MA Period: Period for the MACD's Slow Moving Average (default 26); Signal Average Offset Period: Period for the Signal A
Ichimoku Signals Pro
Shahabeddin Baset
Features All Ichimoku Signals (Selectable) : Display all reliable signals generated by the Ichimoku indicator. You can choose which signals to view based on your preferences. Filter by Signal Strength : Sort signals by their strength—whether they are weak, neutral, or strong. Live Notifications : Receive real-time notifications for Ichimoku signals. Transparent Cloud : Visualize the Ichimoku cloud in a transparent manner. Available Signals Tenkensen-Kijunsen Cross Price-Kijunsen Cross Price-C
Индикатор iVeles_Perfect_Oscilator является опережающим и одним из самых лучших осциляторов на сегодняшний день,  использует специализированный расчет текущих цен графика.  Очень качественно и своевременно показывает смену направления, очень точный подход к уровням перекупленности и перепроданности, что позволяет своевременно принять решение по сделке.  Работает качественно на любом ТФ и с любым инструментом. Параметры: Period - период расчетов Average  - усреднение  МА Method - применяемый мето
Ichimoku Kinko Hyo 的目的-建立在几乎每一个交易市场被成功应用的趋势交易系统。它在许多方面都是独一无二的,但它的主要优势是其使用多个数据点,为交易者提供一个更深入,更全面的价格走势视角。这种深入视角,事实上,Ichimoku 是一款非常优秀的可视系统,能够令交易者从那些高概率中 "一目了然" 地快速识别和过滤低概率的交易设置。 本指标基于标准的 MT5 Ichimoku Kinko Hyo 指标,但我已经将它设计为跟踪其它数值 (RSI, CCI, Momentum, TEMA, ...),且替换至子窗口。 您可以使用它作为其它策略的确认,或者如果您是一个专门的 Ichimoku 用户,您可以将它作为您的 Ichimoku 图表一个梦幻般的辅助。 这是免费版本, 您只能在子窗口里使用 RSI-Ichimoku/原始 Ichimoku。 参看 专业 和 专业多时间帧 版本。
HLC bar MT5 Wyckoff
Eduardo Da Costa Custodio Santos
創建 MT5 的指標“HLC_bar_MT5 Wyckoff”是為了方便交易時的分析。 HLC Bar 由 Richard Wyckoff 使用,目前廣泛用於“VSA”操作。 Wyckoff 發現使用 High、Low 和 Close 使圖表更清晰、更易於分析。 指標“HLC_bar_MT5 Wyckoff”允許: # 改變條寬; # 保持條形相同的顏色; # 並突出顯示以相同價格開盤和收盤的柱。 顏色和寬度很容易在設置中修改 要使用該指標,只需將其拖到圖表上即可。 當與成交量一起使用時,威科夫將 HLC 圖表稱為條形圖。 他們試圖隱藏這些信息多年,但現在每個人都可以訪問這些信息,並可以使用此類圖表改進他們的操作。 HLC bar MT5 Wyckoff Chart 可用於任何市場和任何圖表時間,使操作員更加舒適。
Ichimoku Aiko MTF
Michael Jonah Randriamampionontsoa
Ichimoku Aiko MTF is a collection of technical indicators that show support and resistance levels, as well as momentum and trend direction. It is a multi-timeframe indicator so you don't need to change the chart timeframe when you want to see the ichimoku clouds on a higher timeframe.  eg. The chart timeframe is M15 and you want to see on the M15 timeframe chart the H1 ichimoku indicators (the ichimoku in Metatrader can't do that) that's why you need to use Ichimoku Aiko MTF.
Trilliant Trend
Philip Sint Sae
Trilliant趋势指标. Trilliant趋势是一个先进的外汇指标,结合了隐藏的受尊敬的指标来早日发现趋势。 正如名字所示,它是一种趋势指标,但被纳入交易几乎所有外汇战略(所有在一个),操纵设置,带和线在指标。 任何外汇策略都可以使用三元趋势进行交易。 当形成蜡烛触及三角形上带给出购买信号的箭头时,条件会得到满足,而下带则给出卖信号箭头。 中心线(MA)会发出信号箭头,条件是形成蜡烛会穿过它。 Trilliant指标有四个伟大的指标; 1. Trillient带 -- TB (main indicator -None Repainting) 2. 相对强度指数 -- -- 先进的RSI 3. T rilliant Moving Average --Advanced MA 4. 平均真实范围 -- ATR 用来交易时间范围,市场大多是由相对于一天的时间的会议定义。 这取决于每届会议的流动性和速度。 注 : 这个指标中所看到的频段与波林格频段不一样,这是一个名为Trilliant的特别频段,它对早期和比任何频段指示器更快的信号检测产生了最佳效果。 Trilli
Italo Trend Indicator MT5
Italo Santana Gomes
4.9 (10)
BUY INDICATOR AND GET EA FOR FREE AS A BONUS + SOME OTHER GIFTS! ITALO TREND INDICATOR  is the best trend indicator on the market, the Indicator works on all time-frames and assets, indicator built after 7 years of experience on forex and many other markets. You know many trend indicators around the internet are not complete, does not help, and it's difficult to trade, but the Italo Trend Indicator is different , the Italo Trend Indicator shows the signal to buy or sell, to confirm the signal t
JAC Trend Color Candle
Eduardo Da Costa Custodio Santos
The indicator "JAC Trend Color Candle" for Meta Trader 5, was created to visually facilitate the trend for the trader. It is based on three parameters, which identifies the uptrend, downtrend and non-trending market. The colors are trader-configurable, and the average trader-configurable as well. trend parameters cannot be configured as they are the indicator's differential.
Owl Smart Levels MT5
Sergey Ermolov
4.03 (32)
MT4版本  |   FAQ Owl Smart Levels Indicator 是一個完整的交易系統,包含 Bill Williams 的高級分形、構建正確的市場波浪結構的 Valable ZigZag 以及標記準確入場水平的斐波那契水平等流行的市場分析工具 進入市場和地方獲利。 策略的详细说明 指示灯使用说明 顾问-贸易猫头鹰助手助理 私人用户聊天 ->购买后写信给我,我会将您添加到私人聊天中,您可以在那里下载所有奖金 力量在於簡單! Owl Smart Levels 交易系統非常易於使用,因此適合專業人士和剛開始研究市場並為自己選擇交易策略的人。 策略和指標中沒有隱藏的秘密公式和計算方法,所有策略指標都是公開的。 Owl Smart Levels 允許您快速查看進入交易的信號,突出顯示下訂單的水平並向您發送有關已出現信號的通知。 優點很明顯: 清楚地顯示主要和更高時間框架的趨勢方向。 指示儀器信號的出現。 標記開單、止損設置和固定利潤的水平。 沒有多餘的,只有必要的結構! ZigZag 表示全球趨勢的方向,因此也表示貿易方向。 市場反轉點的短線清楚地表明在什麼水平上構建斐波那
Daily Active Fractals AO
Elvin Entero Tomolin
### **Product Title:** **Daily Active Fractals AO - Smart Support & Resistance**  ### **Tagline:** High-probability reversal levels validated by Momentum. Filters false breakouts automatically.   ---   ### **Description: ** Stop cluttering your charts with weak fractals. **Daily Active Fractals AO** is a professional price action tool that identifies the most significant Support and Resistance levels for the current trading day.   Unlike standard indicators, this tool doesn’t just show every
All Power In One MT5
Ashkan Hazegh Nikrou
当前产品价格为49美元,仅限时优惠,下一个All Power In One价格为99美元。 全能一体(APIO)指标 全能一体(APIO)指标是一种强大的工具,用于评估主要货币(包括美元、欧元、英镑等)的强弱。通过分析可选时间框架内不同货币对的走势和方向,APIO为交易者提供货币强度和潜在交易机会的清晰洞察。 APIO的MT4版本现已上线,点击以下链接访问MT4版本: https://www.mql5.com/en/market/product/129225 使用此指标您可以获得什么? 实时货币强度: 监控美元、欧元、英镑等货币的实时强度。 最佳买入机会列表: 提供包含最佳买入交易机会的货币对列表。 最佳卖出机会列表: 提供包含最佳卖出交易机会的货币对列表。 实时多时间框架访问: 可以在多个时间框架内实时访问强度,通过GUI按钮轻松切换。 加入  Koala Trading Solution频道  ,获取关于所有Koala产品的最新消息,加入链接如下: https://www.mql5.com/en/channels/koalatradingsolution 主要特点: 全面的货
Stochastic R
Antony Augustine
Stochastic  Reversal  allows you to recognize reversals professionally. Stochastic Indicator: This technical indicator was developed by George Lane more than 50 years ago. The reason why this indicator survived for so many years is because it continues to show consistent signals even in these current times. The Stochastic indicator is a momentum indicator that shows you how strong or weak the current trend is. It helps you identify overbought and oversold market conditions within a trend.  Rules
HiperCube Renko Candles
Adrian Lara Carrasco
欢迎使用 HiperCube Renko Candles Darwinex Zero 25% 折扣码:DWZ2328770MGM 此指标为您提供真实的市场信息,将其转换为 Renko Candle Style。 定义 Renko 图表是一种金融图表,用于测量和绘制价格变化,使用砖块(或条形)表示价格变动。与传统烛台图不同,Renko 图表不显示基于时间的信息,仅关注价格波动。 特点: 单独窗口中的指标 自定义蜡烛颜色 自定义蜡烛/砖块大小(以点为单位) Chatgpt 和 AI 被用于开发它 Renko 策略示例: 识别趋势 等待回调和使用 Renko 蜡烛吞没 输入您的入场点 SL 吞没的较低点 TP 风险回报 1:2、1:3... 请注意,这是一个示例,可以作为基础或新策略,无论如何在真实账户中尝试和测试它,这些信息仅供您了解如何使用 Renko Candles Hipercube 指标
FREE
Multi-timeframe trend indicator based on the ADX / ADXWilder indicator with Fibonacci levels The indicator shows trend areas using ADX or ADXWilder indicator data from multiple timeframes. The impulse mode of the indicator allows you to catch the beginning of a trend, and several "Screens" with different timeframes allow you to filter out market noise. Fibonacci levels are added to the price chart, which have flexible settings. How the indicator works: if PDI is greater than NDI, then   it`s
FREE
Introducing   Order Blocks Breaker , a brand-new way to identify and leverage order blocks in your trading strategy. After developing multiple order block tools with unique concepts, I’m proud to present this tool that takes things to the next level. Unlike previous tools,   Order Blocks Breaker   not only identifies order blocks but also highlights   Breaker Order Blocks —key areas where the price is likely to retest after a breakout. MT4 -  https://www.mql5.com/en/market/product/124101/ This t
ZigZag Wave Entry Alert MT5
Azad Amanuel Gorgis Gorgis
The ZigZag Wave Entry Alert** indicator, created by Azad Gorgis in 2024, is designed for MetaTrader 5 and aims to provide traders with entry signals based on ZigZag patterns. Here's a brief overview of its functionality and key features: Functionality: - Detection of ZigZag Patterns: The indicator identifies significant price movements and outlines potential ZigZag patterns on the chart. It detects new highs and lows based on user-defined parameters such as Depth, Deviation, and Backstep. - A
Follow The Line MT5
Oliver Gideon Amofa Appiah
4.59 (34)
This indicator obeys the popular maxim that: "THE TREND IS YOUR FRIEND" It paints a GREEN line for BUY and also paints a RED line for SELL. (you can change the colors). It gives alarms and alerts of all kinds. IT DOES NOT REPAINT and can be used for all currency pairs and timeframes. Yes, as easy and simple as that. Even a newbie can use it to make great and reliable trades. NB: For best results, get my other premium indicators for more powerful and reliable signals. Get them here: https://www.m
FREE
LT Rainbow Trend
Thiago Duarte
5 (1)
Do you, like me, like to trade with the trend? Then this indicator will help you! Rainbow Trend is a trend indicator, which uses several Moving Averages on the chart. It measures different trend strenght zones for different periods: very long term, long term, mid term, short term and very short term. Each zone has its color, and it is possible to have sound alert when the prices leaves a zone and enters another. Its configuration is very simple. If you find any bug or have any suggestions, conta
The indicator detects and displays М. Gartley's Butterfly pattern. The pattern is plotted by the extreme values of the ZigZag indicator (included in the resources, no need to install). After detecting the pattern, the indicator notifies of that by the pop-up window, a mobile notification and an email. The pattern and wave parameters are displayed on the screenshots. The default parameters are used for demonstration purposes only in order to increase the amount of detected patterns. Parameters z
Half ma
Artem Svistunov
The Half ma arrow indicator for the MetaTrader 5 trading terminal is a simple but effective tool that gives a signal about a change in the current trend. The Half ma indicator looks like a solid dynamic line that changes color at the points where the trend changes. At these points, the indicator draws arrows of the corresponding color and direction.The Half ma arrow indicator for the MT5 terminal is not an independent source of input signals. It will be most effective to use it as a trend filte
Will Spread
Paulo Henrique Faquineli Garcia
The Larry Wiliams' indicator named WillSpread considers the influence of the secondary Asset (Symbol) on the current Asset (trading). Indicator essence is to transform the correlation between assets in accumulated history data, providing an opportunity to detect various peculiarities and patterns in price dynamics which are invisible to the naked eye. Based on this information, traders can assume further price movement and adjust their strategy accordingly. As exposed on his Book, Larry says: "a
The new update makes this indicator a complete tool for studying, analyzing and operating probabilistic patterns. It includes: On-chart Multi-asset percentage monitor. Configurable martingales. Twenty-one pre-configured patterns, including Mhi patterns and C3. An advanced pattern editor to store up to 5 custom patterns. Backtest mode to test results with loss reports. Trend filter. Hit operational filter. Martingale Cycles option. Various types of strategies and alerts. Confluence between patter
Auto Optimized RSI   是一款智能且易于使用的箭头指标,旨在实现精准交易。它利用基于历史数据的模拟,自动识别当前品种和时间周期中最有效的 RSI 买入和卖出水平。 该指标既可以作为独立的交易系统使用,也可以结合您的其他交易策略一起使用。尤其适合日内交易者使用。 与传统 RSI 指标使用固定的 70/30 水平不同, Auto Optimized RSI   会根据真实的价格行为和回测结果动态调整水平。它会跟踪胜率、回撤和平均盈亏等关键指标,从而适应市场当前的走势,并基于“实际有效”的逻辑发出信号。 当 RSI 穿越经过优化的关键区域时,指标会在图表上显示 Buy 和 Sell 箭头,帮助交易者找到成功率更高的进场机会。 购买后请务必联系我,以获取额外赠送的工具和专属交易建议! 祝您交易顺利,稳步盈利!
Mitimom
Danil Poletavkin
The indicator is based on Robert Miner's methodology described in his book "High probability trading strategies" and displays signals along with momentum of 2 timeframes. A Stochastic oscillator is used as a momentum indicator. The settings speak for themselves period_1 is the current timeframe, 'current' period_2 is indicated - the senior timeframe is 4 or 5 times larger than the current one. For example, if the current one is 5 minutes, then the older one will be 20 minutes The rest of the s
FREE
该产品的买家也购买
购买此指标即可免费获得我的专业交易管理器。 首先,值得强调的是,这个交易系统是一个非重绘、非重画和非滞后的指标,这使得它非常适合手动和机器人交易。 在线课程,手册和下载预设。 “智能趋势交易系统 MT5”是专为新手和经验丰富的交易者量身定制的综合交易解决方案。它结合了超过 10 个优质指标,具有 7 多个强大的交易策略,使其成为适用于各种市场条件的多功能选择。 趋势跟随策略:提供精确的入场和止损管理,以有效地跟随趋势。 反转策略:识别潜在的趋势反转,使交易者能够利用区域市场的机会。 剃头策略:专为快速准确的日内交易和短期交易而设计。 稳定性:所有指标都不会重绘、不会重画和不会滞后,确保可靠的信号。 定制:支持自定义策略,以满足个人交易偏好。超过 7 种策略和组合可帮助您找到最佳策略。 信号清晰度:提供箭头信号,以指示清晰的入场和退出点。 实时警报:通过交易进出警报使交易者保持了解。 深入分析:提供更高时间框架的趋势分析和实时交易监控。 自适应颜色编码:利用蜡烛颜色编码来显示成交量、趋势和反转蜡烛信号。通过蜡烛颜色分析市场方向。 “智能趋势交易系统 MT5”赋予交易者必要的工具,以便在
Divergence Bomber
Ihor Otkydach
4.99 (77)
购买该指标的每位用户将额外免费获得以下内容: 原创工具“Bomber Utility”,该工具会自动跟踪每一笔交易,设置止损和止盈点,并根据策略规则自动平仓; 适用于不同交易品种的指标设置文件(Set 文件); 三种不同风险模式下的 Bomber Utility 设置文件:“最低风险”、“平衡风险” 和 “观望策略”; 一套详细的 视频操作手册,帮助您快速完成安装、配置并开始使用本交易系统。 注意: 要获取以上所有赠品,请通过 MQL5 的私人消息系统联系卖家。 我为您介绍原创的自定义指标 “Divergence Bomber”(背离轰炸机),它是一套基于 MACD 背离交易策略 的“全功能”交易系统。 该技术指标的主要任务是识别 价格与 MACD 指标之间的背离,并发出交易信号(包括推送通知),指示未来价格可能的运动方向。平均而言,这些信号的准确率超过 98%。有关该指标如何工作的详细说明,请观看本页面上的视频演示。 该系统使用 止损订单 和 动态回撤平仓机制 来管理交易。 Divergence Bomber 指标的主要特点: 支持交易的品种: AUDCAD、AUDCHF、AUDSG
Gold Sniper Scalper Pro
Ich Khiem Nguyen
5 (4)
Gold Sniper Scalper Pro - MetaTrader 5 黄金 (XAU/USD) 交易系统 专为认真的交易者设计: 采用结构化、数据驱动的方法进行黄金交易,该方法结合了多种市场分析因素。此工具旨在支持您的黄金交易分析。 限时价格机会 这是在价格上涨之前拥有 Gold Sniper Scalper Pro 的机会。 产品价格将在每接下来的 10 次购买后增加 $50。 最终价格: $498 定义您的分析优势的功能 Gold Sniper Scalper Pro 是一个全面的工具包,旨在为您提供深刻见解和清晰的统计优势: 详细的指标使用指南,包括系统信息、输入自定义设置以及指标使用注意事项,已在下方 MQL 文章中呈现。请参阅该文档。 Gold Sniper Scalper Pro - Gold (XAU/USD) Trading System on MetaTrader 5 - Trading Systems - 8 November 2025 - Traders' Blogs 多算法架构: 系统的核心是多个分析算法的智能组合,它们同步运行以过滤市场噪音并确定潜在
Entry In The Zone and SMC Multi Timeframe 是一款基于 Smart Money Concepts(SMC) 开发的实时市场分析工具,旨在帮助交易者以系统化方式分析市场结构,并更加清晰地掌握整体市场方向。 系统能够在多周期中自动分析 反转点、关键价格区域以及市场结构 ,并显示 兴趣点(POI) 、 无重绘信号 以及 自动斐波那契水平(Auto Fibonacci Levels) ,用于精准识别回调位置与潜在反转点。 系统提供的 实时信号与提醒功能 可确保当价格进入关键区域或在区域内出现反转信号时,交易者不会错过重要机会。 此外,本系统同时具备 指标功能 和 信号系统功能(2 合 1) ,将区域分析与实时入场信号集成于同一工具中。所有参数亦可完全自定义,以适配任何交易风格。 ------------------------------------------------------------------------------ 免费赠送!FABLE Pro Suite — 为智能资金交易者打造的一体化交易工具包 购买此指标后,您将免费获得 F
Atomic Analyst MT5
Issam Kassas
4.31 (26)
首先值得强调的是,该交易指标是非重绘、非延迟的指标,这使其成为手动和机器人交易的理想选择。 用户手册:设置、输入和策略。 Atomic Analyst是一种PA价格行动指标,利用价格的力量和动量来寻找市场上更好的机会。配备了高级过滤器,可帮助去除噪音和假信号,并提高交易潜力。使用多层复杂的指标,Atomic Analyst扫描图表,并将复杂的数学计算转化为任何初学者都能理解并用来做出一致交易决策的简单信号和颜色。 “Atomic Analyst”是专为新手和经验丰富的交易者量身定制的综合交易解决方案。它将高级指标和一流功能融合为一体的交易策略,使其成为所有类型交易者的多功能选择。 日内交易和剥头皮策略:专为快速准确的日内交易和短期交易而设计。 日内和摆动交易策略:可用作追求价格大幅波动的日内和摆动交易者的可靠工具。 多货币和市场:凭借其可靠的精度,在不同的工具和市场上运作。 多个时间框架:可在多个时间框架上使用,性能良好。 稳定性:所有指标均不重绘、不重绘和不滞后,确保可靠的信号。 信号清晰度:提供箭头信号,用于清晰的入场和出场点。 实时警报:通过交易入场、SL和TP警报通知交易者
FX Power MT5 NG
Daniel Stein
5 (28)
FX Power:分析货币强度,助您做出更明智的交易决策 概述 FX Power 是一款专业工具,帮助您全面了解主要货币和黄金在任何市场条件下的真实强度。通过识别强势货币用于买入,弱势货币用于卖出, FX Power 简化了交易决策,并帮助您发现高概率的交易机会。不论您是想跟随趋势还是通过极端的 Delta 值预测反转,这款工具都能完美适应您的交易风格。别再盲目交易——用 FX Power 让您的交易更加智慧。 1. 为什么 FX Power 对交易者极具价值 实时货币和黄金强度分析 • FX Power 实时计算并显示主要货币和黄金的相对强度,助您全面了解市场动态。 • 监控领先或落后资产,轻松识别值得交易的货币对。 全面的多时间框架视图 • 跟踪短期、中期和长期时间框架的货币和黄金强度,以便将您的交易策略与市场趋势保持一致。 • 无论是快进快出的短线交易还是更长期的投资策略, FX Power 都能为您提供所需的信息。 Delta 动态分析用于趋势和反转 • 极端 Delta 值常常预示反转机会,而平缓的 Delta 变化则确认趋势延续。 • 使用 Delta 分析,轻
Quantum TrendPulse
Bogdan Ion Puscasu
5 (19)
介绍 Quantum TrendPulse   ,这是一款终极交易工具,它将 SuperTrend   、   RSI 和 Stochastic 的强大功能整合到一个综合指标中,以最大限度地发挥您的交易潜力。该指标专为追求精准和效率的交易者而设计,可帮助您自信地识别市场趋势、动量变化以及最佳进入和退出点。 主要特点: 超级趋势整合: 轻松跟随当前的市场趋势并乘上盈利浪潮。 RSI 精度: 检测超买和超卖水平,非常适合把握市场逆转时机,可用作 SuperTrend 的过滤器 随机精度: 利用随机振荡在波动的市场中寻找隐藏的机会, 用作超级趋势的过滤器 多时间范围分析: 从 M5 到 H1 或 H4,在不同时间范围内关注市场动态。 可定制的警报: 当您的自定义交易条件得到满足时收到通知,这样您就不会错过任何交易。 无论您是新手还是经验丰富的交易员,   Quantum TrendPulse 都能为您提供所需的优势,帮助您增强策略并自信地进行交易。借助这一强大的指标,将洞察力转化为利润 — 掌控您的交易! ***购买 Quantum TrendPulse,即可免费获得 Quantum Tr
Grabber System MT5
Ihor Otkydach
4.79 (19)
向您介绍一款优秀的技术指标——Grabber,它是一套即开即用的“全包式”交易策略。 在一个代码中集成了强大的市场技术分析工具、交易信号(箭头)、提醒功能和推送通知。 每位购买该指标的用户还可免费获得以下内容: Grabber辅助工具:用于自动管理已开仓位 视频操作指南:逐步教学如何安装、设置和使用该指标进行交易 原创Set文件:可快速自动配置,帮助实现最佳交易效果 忘掉其他策略吧!只有Grabber能够真正激励你在交易中攀登新高峰! Grabber策略的主要特点: 交易周期:从M5到H4 适用资产:任意,但我推荐我亲自测试过的品种(GBPUSD、GBPCAD、GBPCHF、AUDCAD、AUDUSD、AUDSGD、AUDCHF、NZDUSD、NZDCAD、EURCAD、EURUSD、EURAUD、EURGBP、EURCHF、USDCAD、USDSGD) 交易时间:全天候 24/7 交易效果:我分享自己的真实交易结果,并在此教学如何操作: https://www.mql5.com/ru/market/product/134563?source=Site+Market+MT5+Indic
首先,值得强调的是,这个交易工具是非重绘、非重画和非滞后的指标,非常适合专业交易。 在线课程,用户手册和演示。 智能价格行动概念指标是一个非常强大的工具,既适用于新手,也适用于经验丰富的交易者。它将超过20个有用的指标合并到一个指标中,结合了高级交易思想,如内圈交易员分析和智能资金概念交易策略。该指标侧重于智能资金概念,提供有关大型机构交易方式的见解,帮助预测它们的动向。 它在流动性分析方面尤其擅长,有助于理解机构的交易方式。它擅长预测市场趋势,并仔细分析价格波动。通过将您的交易与机构策略对齐,您可以更准确地预测市场走向。该指标多才多艺,擅长分析市场结构,识别重要的订单区块,并识别各种模式。 它擅长识别BOS和CHoCH等模式,理解动量的转变,并突出显示供需强劲的关键区域。它还擅长发现强大的不平衡,并分析价格创造更高高点或更低低点的模式。如果您使用斐波那契回撤工具,该指标可以满足您的需求。它还可以识别相等的高点和低点,分析不同的时间框架,并通过仪表板显示数据。 对于使用更高级策略的交易者,该指标提供了工具,如公平价值差指标和优惠和折扣区域的识别。它特别关注高时间框架订单区块,并
Entry Points Pro for MT5
Yury Orlov
4.47 (136)
这款指标用于 MT5,可提供准确的入场交易信号,且无重绘。 它可应用在任何金融资产:外汇、加密货币、贵金属、股票、指数。 它将提供极其精准的评估,并告诉您何时开仓和平仓的最佳时机。 观看 视频 (6:22),其中包含一个仅处理单一信号的示例,该信号即可值回指标购价! 大多数交易者在 Entry Points Pro 指标的帮助下,在第一个交易周内即改善了他们的交易结果。 订阅我们的 Telegram 群 ! Entry Points Pro 指标的益处。 入场信号无重绘 如果信号出现,并得到确认,则它不会再消失;不像是重绘指标,它会导致重大的财产损失,因为它们可以在显示信号后再将其删除。 无差错开仓 指标算法可令您找到入场交易(买入或卖出资产)的理想时机,从而提高每位交易者的成功率。 Entry Points Pro 可操作任何资产 它允许您在 MT5 平台上交易任何经纪商的加密货币、股票、贵金属、指数、大宗商品和货币。 提供任何方向的信号 Entry Points Pro 指标提供针对任意价格走势的入场交易信号 - 上涨、下跌或横盘(横向)。 最大盈利潜力 离场信号
SynaptixQuant Dominance Matrix
Devie Arevalo Montemayor
5 (1)
SynaptixQuant Dominance Matrix: Institutional-Grade Market State Extraction Engineered for traders who require a data-driven view of market behaviour beyond surface-level indicators. The Synaptix Quant (SQ) Dominance Matrix is not a conventional currency strength display. Behind its intentionally streamlined interface runs a sophisticated analytical architecture designed to quantify market conditions with precision. Every output is generated through layered signal processing built to identify d
Trend indicator AI mt5
Ramil Minniakhmetov
5 (12)
趋势人工智能指标是一个伟大的工具,将加强交易者的市场分析结合趋势识别与可操作的进入点和逆转警报。 该指标使用户能够自信和精确地驾驭外汇市场的复杂性 除了主要信号,趋势Ai指标识别在回调或回调期间出现的次要入口点,使交易者能够利用既定趋势内的价格修正。 重要优势: *MT4及MT5工程 *明确买入或卖出信号 ·不重绘 *适用于所有资产 小心我不卖EA或设置电报它骗局. 所有设置免费在这里的博客。  重要! 购买后立即与我联系,以获得指示和奖金! 真实的操作监控以及我的其他产品可以在这里找到: https://www.mql5.com/en/users/mechanic/seller&nbsp ; 设置和输入: 建议为所有资源设置默认设置。 第...
FX Volume MT5
Daniel Stein
4.79 (24)
FX Volume:从经纪商视角洞察真实市场情绪 简要概述 想要提升您的交易策略? FX Volume 可提供零售交易者和经纪商的持仓实时数据——远早于诸如 COT 之类的延迟报告。不论您希望获得持续稳定的收益,还是想在市场中多一分制胜的砝码, FX Volume 都能帮您识别重大失衡、确认突破以及完善风险管理。立即开启体验,让真实的成交量数据为您的交易决策带来革新! 1. 为什么 FX Volume 对交易者格外有用 极具准确度的早期预警 • 快速捕捉有多少交易者正在买入或卖出某个货币对——比大多数人提前一步。 • FX Volume 是 唯一 能够整合多家零售经纪商真实成交量数据并以简洁方式呈现的工具。 强力风险管理 • 及时识别多头或空头仓位的巨大不平衡,这往往预示着潜在的趋势反转,帮助您更自信地设置止损和目标位。 • 独家而真实的数据让每一次交易决策更具可靠性。 优化进场与出场点 • 发现“过度集中”的交易(大多数交易者都在同一方向),并通过真实成交量来确认突破。 • 避免依赖常见指标可能带来的误导信号,而是利用真实的实时成交量。 适配各种交易策略 • 将 FX
TPSproTREND PrO MT5
Roman Podpora
4.72 (18)
立即购买 TREND PRO 并免费获得另一个高级趋势指标 如需接收,请写私人消息。 VERSION MT4     -     ИНСТРУКЦИЯ RUS       -     INSTRUCTIONS  ENG 主要功能: 准确的输入信号,无需渲染! 如果出现信号,它仍然相关!这是与重提指标的一个重要区别,重提指标可以提供信号然后改变信号,这可能导致存款资金的损失。现在您可以以更高的概率和准确度进入市场。还有一个功能是在箭头出现后为蜡烛着色,直到达到目标(止盈)或出现反转信号。 显示止损/获利区域 为了提高搜索切入点时的视觉清晰度,创建了一个模块,该模块最初显示买入/卖出区域,在该区域中搜索进入市场的最佳点。用于处理止损水平的附加智能逻辑有助于随着时间的推移减小其大小,从而降低进入交易(移动 sl)时的初始风险。 显示较高时间范围内的最小值/最大值(MTF 模式) 添加了一项功能,可以显示较高时间间隔的最小/最大校正位置,并显示趋势变化。此外,MIN/MAX 现在有编号,显示修正内容。 风险回报率 (RR) 使用指标算法,可以检测精确的入场点,平均风险回报比超过1k2。
RelicusRoad Pro MT5
Relicus LLC
5 (24)
您购买了多少次交易指标,它们拥有 出色的回测, 真实账户表现证明 拥有惊人的数字和 各种统计数据, 但使用后您却 账户爆仓? 您不应该只相信一个信号本身,您需要知道它最初出现的原因,这正是 RelicusRoad Pro 的最佳之处! 用户手册 + 策略 + 培训视频 + 带 VIP 访问权限的私人群组 + 提供移动版本 观察市场的新方式 RelicusRoad 是 全球最强大、最好的交易指标 ,适用于外汇、期货、加密货币、股票和指数,为交易者提供发展账户所需的所有信息和工具。我们提供 技术分析 和 交易计划 ,帮助 每位交易者取得成功 ,无论是 初学者 还是 高级交易者 。 它是一个 关键交易指标 ,提供足够的信息来 预测 未来市场。我们相信一个 完整的解决方案 ,而不是图表上几个没有意义的不同指标。这是一个 一体化指标 ,显示 信号 、 箭头 + 价格行为 信息,这是 无与伦比 且 非常准确的 。   RelicusRoad 利用机器学习 (AI) 技术,为交易者提供必要的信息和工具,帮助他们成为成功的、知情的交易者。   通过领先指标预测未来价格 几乎 所有技术指标都滞后 ,
Atbot
Zaha Feiz
4.62 (55)
AtBot: 它是如何工作的以及如何使用它 ### 它是如何工作的 “AtBot”指标用于MT5平台,通过结合技术分析工具生成买入和卖出信号。它集成了简单移动平均线(SMA)、指数移动平均线(EMA)和平均真实波幅(ATR)指标,以识别交易机会。此外,它还可以利用Heikin Ashi蜡烛来增强信号的准确性。 购买后留下评论,您将获得特别的奖励礼物。 ### 主要特点: - 不重绘: 信号在绘制后不会改变。 - 不变动: 信号保持一致,不会被更改。 - 无延迟: 提供及时的信号,没有延迟。 - 多种时间框架: 可在任何时间框架上使用,以适应您的交易策略。 ### 操作步骤: #### 输入和设置: - firstkey (TrendValue): 调整趋势检测的灵敏度。 - Secondkey (SignalValue): 定义买入/卖出信号生成的灵敏度。 - masterkey (ExitValue): 控制信号的退出策略。 - h: 切换是否根据Heikin Ashi蜡烛生成信号(真/假)。 - notifications: 启用或禁用信号提醒。 #### ATR计算: ATR测
Blahtech Supply Demand MT5
Blahtech Limited
4.54 (13)
Was: $299  Now: $99  Supply Demand uses previous price action to identify potential imbalances between buyers and sellers. The key is to identify the better odds zones, not just the untouched ones. Blahtech Supply Demand indicator delivers functionality previously unavailable on any trading platform. This 4-in-1 indicator not only highlights the higher probability zones using a multi-criteria strength engine, but also combines it with multi-timeframe trend analysis, previously confirmed swings a
TrendLine PRO MT5
Evgenii Aksenov
4.67 (33)
Trend Line PRO   指标是一个独立的交易策略。 它显示趋势变化,交易的入口点,以及自动计算三个级别的止盈和止损保护 Trend Line PRO  非常适合所有元交易者符号:货币,金属,加密货币,股票和指数 该指标用于真实账户交易,这证实了该策略的可靠性 您可以在这里找到使用   Trend Line PRO   和真实信号的机器人:   https://www.mql5.com/zh/users/neurofx/seller 目前,Trend Line PRO指标的售价为75美元。 促销后价格为 149 美元 。 趋势线专业的优点 永远不要重绘它的信号; 将其作为独立策略的可能性; 它有三个自动水平止盈和止损水平  该指标具有iCustom信号缓冲区,允许您基于它创建交易机器人 具有通知功能 该指标已证明其在真实账户交易中的有效性 如何设置和优化趋势线PRO指标: 通过更改幅度参数以及 TP 和 SL 水平,将重点放在指标面板上的利润上 您可以使用以下方式自动优化指标参数: Optimizer Utility 详细说明(ENG): 这里 趋势线PRO指标如何工作:
Blahtech Market Profile MT5
Blahtech Limited
5 (10)
Was: $249  Now: $99   Market Profile defines a number of day types that can help the trader to determine market behaviour. A key feature is the Value Area, representing the range of price action where 70% of trading took place. Understanding the Value Area can give traders valuable insight into market direction and establish the higher odds trade. It is an excellent addition to any system you may be using. Inspired by Jim Dalton’s book “Mind Over Markets”, this indicator is designed to suit the
Quantum Trend Sniper
Bogdan Ion Puscasu
4.74 (53)
介绍   量子趋势狙击指标 ,突破性的 MQL5 指标,正在改变您识别和交易趋势反转的方式!由拥有超过13年交易经验的资深交易员团队开发,     量子趋势狙击指标   旨在通过其创新的方式以极高的准确度识别趋势反转,将您的交易之旅推向新的高度。 ***购买量子趋势狙击指标,即可免费获得量子突破指标!*** 当量子突破指标识别出趋势反转时,它会向您发出警报和信号箭头,并建议您三个止盈水平。 它既适合新手交易者,也适合专业交易者。 量子 EA 通道:       点击这里 MT4版本:       点击这里 建议: 时间范围: 所有时间范围。为了获得最佳结果,我们建议在 M15、M30 和 H1 时间范围内使用它。 货币对:欧元兑美元、英镑兑美元、澳元兑美元、欧元兑英镑、, EURAUD,  XAUUSD 账户类型:ECN、Raw 或 Razor,点差极低 经纪时间:任意 经纪商:IC Markets、Pepperstone with Raw 和 Razor 的点差最低 建议止损:50 点 建议止盈水平:20 点、50 点和 100 点 规格: 不重漆! 最
ARIScalping
Temirlan Kdyrkhan
ARIScalp is a powerful trading companion designed to generate high-probability entry signals with dynamic TP/SL/DP levels based on volatility. Built-in performance tracking shows win/loss stats, PP1/PP2 hits, and success rates all updated live. Key Features: Buy/Sell signals with adaptive volatility bands Real-time TP/SL/DP levels based on ATR Built-in MA Filter with optional ATR/StdDev volatility Performance stats panel (Success, Profit/Loss, PP1/PP2) Alerts via popup, sound, push, or email Cus
该指标识别价格和振荡器/指标之间何时出现背离。它识别常规和隐藏的分歧。它有一个 RSI 过滤器选项,可以只过滤掉最强的设置。该指标还提供等待 Donchian 通道突破或价格穿越移动平均线的选项 (见截图 #3)     在发出交易机会信号之前确认分歧。结合您自己的规则和技术,该指标将允许您创建(或增强)您自己的强大系统。 特征 可以检测以下振荡器/指标的背离:MACD、OsMA、随机指标、RSI、CCI、RVI、Awesome、ADX、综合指数、ATR、OBV、MFI 和动量。只能选择一个振荡器/指示器。 为常规/经典(潜在逆转)背离绘制实线,为隐藏(趋势延续)背离绘制虚线。线条绘制在图表和指标窗口中。 当背离或 突破/交叉时发送警报   已被检测到。 支持所有 Metatrader 原生警报类型。 包含 1 个缓冲区,开发人员可以将其与智能交易系统 (EA) 中的 iCustom() 函数一起使用。缓冲区索引为 4,移位始终为 0。代码示例和缓冲区返回值可以在末尾找到     博客 。 输入参数 请在此处 找到输入参数的说明和解释 。
Trend Forecaster
Alexey Minkov
5 (7)
The Trend Forecaster indicator utilizes a unique proprietary algorithm to determine entry points for a breakout trading strategy. The indicator identifies price clusters, analyzes price movement near levels, and provides a signal when the price breaks through a level. The Trend Forecaster indicator is suitable for all financial assets, including currencies (Forex), metals, stocks, indices, and cryptocurrencies. You can also adjust the indicator to work on any time frames, although it is recommen
Shock Pullback
Suleiman Alhawamdah
5 (1)
简单来说,当白色数字(称为“点”)开始出现在当前蜡烛图旁边时,您就可以开始交易了。白色“点”表示当前的买入或卖出交易正在进行,并且方向正确,其白色即为标志。当白色点的移动停止并变为静态绿色时,这表示当前动能已结束。绿色数字表示以“点”为单位的总利润,无论是来自买入还是卖出交易。 此外,还可以通过指标中的其他高级专业分析工具来开仓。通过观察指标中显示的信号和颜色,您可以高精度地捕捉大量剥头皮交易机会。只需确保在测试或实时图表中理解该指标的运作方式。 适用于大多数外汇市场:非常适合交易黄金和热门指数市场——道琼斯、标普500、纳斯达克、DAX等,以及外汇货币对如欧元/美元、英镑/美元、美元/日元等众多强势货币对。也支持主要加密货币如比特币、以太坊和稳定币——非常适合在数字资产与传统市场之间进行多元化策略。 限时特价优惠。 Shock Pullback 指标在识别回调和积累区域方面是一项真正的突破。它基于完全创新的算法构建,使交易者能够轻松而清晰地识别交易机会、跟踪价格走势,并检测回调、积累区域、缺口和突破。 Shock Pullback V 3.3 新版本更新 Shock Pullbac
Market Structure Patterns
Samuel Manoel De Souza
4.47 (19)
Available for   MT4   and   MT5 . Join the Market Structure Patterns channel to download materials available for study and/or additional informations. Related posts: Market Structure Patterns - Introdução Market Structure Patterns   is an indicator based on   smart money concepts   that displays   SMC/ICT   elements that can take your trading decisions to the next level. Take advantage of the   alerts ,   push notifications   and   email messages   to keep informed from when an element is form
Advanced Currency Strength28 MT5
Bernhard Schweigert
5 (3)
任何新手或专家交易者的最佳解决方案! 这个指标是一个独特的、高质量的、可负担得起的交易工具,因为我们纳入了一些专有的功能和一个新的公式。只需一个图表,你就可以读出28个外汇对的货币强度!想象一下,你的交易将如何得到改善,因为你的交易是在你的手中进行的。想象一下,你的交易将如何改善,因为你能够准确地确定新趋势或剥头皮机会的触发点? 用户手册:点击这里  https://www.mql5.com/en/blogs/post/697384 这是第一本,原版的! 不要买一个毫无价值的崇拜者的克隆品。 特别的 子窗口中的箭头显示强劲的货币势头GAP将指导你的交易! 当基础货币或报价货币处于超卖/超买区域(外盘斐波那契水平)时,在个人图表的主窗口中出现警告信号。 当货币力量从外围区间回落时,回撤/反转警报。 十字星模式的特别警报 可选择多个时间框架,以快速查看趋势! 货币强度线在所有的时间框架中都非常平稳,当使用较高的时间框架来识别总体趋势,然后使用较短的时间框架来确定精确的入口时,效果非常好。你可以根据自己的意愿选择任何时间框架。每个时间框架都由其自身进行了优化。 建立在新的基础算法
Super Signals Channel Indicator Its channel is a non-repaint indicator that reacts more with recent price movements. For this reason, the Super Signals Channel Indicator is a better match for short-term or day trading strategy. The Super Signals Channel only plots swing trading opportunities. So most of its trade signals appear during consolidation or sidelined periods of the market. Super Signals Channel Indicator for MT5 Explanation The green band below the price shows the dynamic support lev
Volume Profile Pro Signals  精确的量价分析与自动信号生成相结合。 功能概述 Volume Profile Pro Signals 构建实时、数据驱动的量价分布图,揭示价格被接受或拒绝的市场区域。它高亮显示 POC、VAH、VAL,并精准识别 HVN/LVN 区域。在此基础上生成实时的 VAH/VAL 突破信号,并根据 ATR 波动性绘制智能 SL/TP 水平。 所有设置 —— 从剖面分辨率到提醒方式 —— 均可调整以适配你的交易风格,无论是快速抢短线还是多日持仓的波段交易。 核心亮点 按价位的成交量洞察:在 MT5 图表上直观绘制 Point of Control 和 Value Area。 突破提醒:当价格收盘超过 VAH 或跌破 VAL 时即时发出信号。 自适应风险水平:基于 ATR 自动计算的止损与止盈。 智能过滤:EMA 趋势过滤器与可选的 POC 斜率确认减少误报。 HVN/LVN 识别:区分高活跃与低量区,提供更明确的交易背景。 多时间框架兼容:可在多个图表和时间框架上高效运行。 使用场景 指标持续更新市场的动态剖面,无需手动绘制或单独查看
AriX
Temirlan Kdyrkhan
1 (4)
AriX Indicator for MT5 A powerful trend-following and signal-evaluation tool AriX is a custom MT5 indicator that combines Moving Averages and ATR-based risk/reward logic to generate clear buy/sell signals. It visualizes dynamic SL/TP levels, evaluates past trade outcomes, and displays win/loss statistics in a clean on-chart panel. Key features include: Buy/Sell signals based on MA crossovers ATR-based SL/TP1/TP2/TP3 levels with visual lines and labels Signal outcome tracking with real-time stat
MACD 日內趨勢 PRO 是通過改編自 Gerald Appel 在 1960 年代創建的原始 MACD 而開發的指標。 通過多年的交易,觀察到通過使用斐波那契比例更改 MACD 的參數,我們可以更好地呈現趨勢運動的連續性,從而可以更有效地檢測價格趨勢的開始和結束。 由於其檢測價格趨勢的效率,還可以非常清楚地識別頂部和底部的背離,從而更好地利用交易機會。 特徵 MACD 日內趨勢 PRO 指標適用於任何貨幣對、任何時間範圍以及 Renko 圖表。 可以通過選擇 6 種模式來設置趨勢檢測速度: 最快的 快速地 普通的 減緩 最慢 資源 它有 6 個可配置的警報: MACD回調信號線 MACD穿越信號線 MACD穿過零水平 信號線過零電平 MACD 變化趨勢顏色 信號線變化趨勢顏色 對於每個警報,可以配置: 彈出 聲音(有 13 種聲音可用。) 智能手機通知 彈出窗口和聲音 彈出窗口和智能手機通知 聲音和智能手機通知 彈出窗口、聲音和智能手機通知 與智能交易系統或其他指標集成 有 8 個緩衝區可用於訪問和與專家顧問或其他指標集成,即使關閉警報,它們也會被填滿,它們是: 緩衝
作者的更多信息
这个高级MACD指标保留了标准MACD的基本功能,同时提供了几个额外的特性: 直方图着色:直方图使用四种不同的颜色清晰地显示增加和减少。浅绿色表示增加的正值,灰色表示减少的正值,红色表示减少的负值,橙色表示增加的负值。 信号线交叉箭头:在MACD线穿过信号线的点显示买卖信号的箭头。蓝色箭头表示买入信号,红色箭头表示卖出信号。 直方图变化箭头:在直方图从正转负或从负转正的地方绘制箭头,显示趋势变化。 背离检测:检测价格和MACD之间的背离。这有助于提前预测潜在的趋势反转。 超买/超卖水平:在用户定义的水平标记超买或超卖条件。 趋势线:使用EMA(指数移动平均线)显示长期趋势。 波动率指标:基于MACD值的变化测量市场波动率。 信号强度指标:通过比较MACD和信号线之间的差异与波动率来衡量信号强度。强信号显示为绿色,中等信号显示为黄色,弱信号显示为红色。 零线:显示MACD的零水平,有助于确定趋势变化。 警报和通知:当出现重要信号时向用户发送警报和通知。 这个指标产生更活跃和敏感的信号,特别是在5分钟图表上。当所有这些特性结合在一起时,与标准MACD相比,可以获得更全面和经过过滤的信号。该
筛选:
无评论
回复评论