 MetaTrader 5
 专家
 指标
 程序库
 实用工具
 窗口小部件
 规则
适用于MetaTrader 5的EA交易和指标 - 78
 使用EA交易和指标,使外汇交易获得更多盈利。EA交易可使您自动开启和关闭交易,而指标将帮助您更准确地预测市场行为。
该页面提供MetaTrader 5应用程序的目录。

AI ZONE RADAR — 用价格区域查看支撑与阻力 请选择与平台对应的版本 此页面为MT5版,另有MT4版可选。 查看MT4版商品 MT4版和MT5版是独立Market商品,本次购买仅包含所选平台的版本。 在判断信号之前,也看清价格位置 出现买入信号时,上方是否紧邻阻力?看到回调时,附近的支撑在哪里?增加更多水平线并不一定让这些问题更容易判断。AI ZONE RADAR 将附近价格区域及其相对强度集中呈现,帮助您先确认信号所处的位置。 AI ZONE RADAR 是 MetaTrader 5 图表分析指标。面板、状态信息和提示支持Market全部11种语言,可自动或手动切换。 English / Russian / Chinese (Simplified) / Spanish / Portuguese / Japanese / German / Korean / French / Italian / Turkish 水平线周围的区域、1至5星相对强度以及不同线宽,帮助您查看重要价格位置。面板集中显示品种、周期、附近支撑与阻力、距区域的点差距离(pips)、当前状态及方向倾向。星级

Risk Line Calculator Risk Line Calculator 是一款简单轻量的 MetaTrader 5 风险和手数计算指标。 用户只需设置风险百分比,然后在图表上拖动 Stop Loss 线,指标就会根据当前价格与止损线之间的距离自动计算建议交易手数。 主要功能 可直接拖动的 Stop Loss 线 自动风险手数计算 用户自定义 Risk % 显示 Stop Loss 距离 显示账户货币风险金额 自动识别 BUY 或 SELL 方向 可使用 Balance、Equity 或 Free Margin 作为风险基础 读取当前交易品种的经纪商规格 自动考虑最小手数、最大手数和手数步长 支持外汇、贵金属、指数和 CFD 等品种 自动适应浅色和深色图表背景 简洁透明显示,不使用大型控制面板 使用方法 1. 在指标参数中设置所需的 Risk %。 2. 将红色 SL 线拖动到计划的止损位置。 3. 指标会立即更新建议手数和风险信息。 SL 在线位于当前价格下方时,方向显示为 BUY。 SL 在线位于当前价格上方时,方向显示为 SELL。 显示信息 RISK 1.00% LO
FREE

Session / Killzone / Time Filter
只在市场真正运行时交易 许多自动化策略在回测中盈利,在实盘中亏损,因为它们在死时段、节假日或每日滚动点差扩大时执行。已针对 FTMO 、 The Funded Trader 、 MyFundedFX 和 FundedNext 的工作流程测试。 Session / Killzone / Time Filter 阻止在配置的交易时段之外开仓,并可在市场进入低流动性时段时关闭仓位或取消挂单。一个工具,一次拖放到图表,完全控制您的 EA 何时被允许交易。
兼容 MetaTrader 4 和 MetaTrader 5。任意品种、任意时间周期。 过滤器内置 London、New York 和 Asia 三个交易时段,两个完全自定义的 Killzone,自动处理欧洲和美国的夏令时规则,按星期过滤,以及可选的星期五提前收盘。当前状态被写入一个GlobalVariable,终端中的任何其他 EA 都可以用一行 MQL 读取它。 主要功能 三个内置时段:London、New York 和 Asia,默认参数合理。 两个自定义 Killzo

如果您在金融市场交易,那么您肯定知道点差有多重要——买入价(ask)和卖出价(bid)之间的差异会严重影响您的利润。 Spread Size 是一个简单但非常实用的指标,它直接在图表上显示当前点差。不再需要手动持续监控数据——一切尽在眼前! 为什么需要它?
点差不只是一个数字。它是您真实的资金。低点差意味着开仓和平仓的成本更低。高点差,尤其是在新闻发布或流动性低的时候,可能会“吞噬”您的一部分利润,甚至将盈利交易变成亏损交易。Spread Size 帮助您及时察觉这些情况。 它是如何工作的?
该指标以文本形式在图表上显示点差。但最方便的是,它会根据情况改变颜色: 绿色——点差低,可以安心交易。
红色——点差高,最好等待或重新检查条件。
颜色和触发阈值可以根据您的需求自定义。 还有什么用处?
节省时间——不需要频繁切换窗口。
帮助避免意外情况——例如,经纪商在新闻发布前突然扩大点差。
适合所有人:剥头皮交易者、日内交易者,甚至关注成本的投资者。 点差扩大的风险示例
假设您在正常时间以10点的点差开了一个EUR/USD的仓位。一切顺利,价格朝着您的方向移动。但突然发布了重要的美元新闻—
FREE

一条深达六层加权均线的线,它改变方向,而不是去穿越什么。Cascade WMA Trend MTF把六条加权移动均线串成一链,它们的周期像斐波那契数列那样增长,这让结果的平滑程度远远超过同样长度的单条均线所能达到的水平,而信号则取自成品线改变方向。任何图表上的任何上位时间周期,读取的只有已收盘的上位K线。它是免费的:没有试用期,没有锁定功能,没有升级页面。 六条加权移动均线串成一链,每一条都取自前一条的输出,而它们的周期由前两个相加得出。用出厂值三和五,就得到三、五、八、十三、二十一、三十四这一串。信号是成品线的方向改变,并没有什么去穿越什么。 六级加权造出一条极难被推动的线,这既是该方法的全部意义,也是它的全部代价。设置中的ATR周期只调整箭头画在距离它那根K线多远的位置,绝不触及转向本身。 图表上有什么 在价格窗口里绘制:按方向上色、跨越转向而不断开的级联线,以及方向改变那根K线上的BUY和SELL箭头。本产品没有通道,因此Styles选项卡提供的只有线条、它的粗细和箭头大小。 面板 价格图表上的画布面板,可拖动、可折叠、可关闭。它显示当前生效的时间周期,以及实际参与计算的设置数值
FREE

Green Red Sweep Candle by RWBTradeLab
A clean, non-repainting two-candle sweep detector for MetaTrader 5. It finds the moment a candle raids the far side of the one before it and then closes clean through the opposite side — the liquidity grab and the commitment, in the same candle. All from CLOSED candles only.
What This Indicator Does
Both candles of the pattern share the same colour. The second one first SWEEPS the far side of the first, and only then CLOSES beyond the opposite side, so i
FREE

VWAP Institutional Pro:真实价值地图 VWAP Institutional Pro 是识别市场公平价格的终极工具,让您能够参考与大型投资基金和高频算法相同的标准进行交易。该指标实时计算成交量加权平均价,揭示动态支撑和阻力的隐形水平,机构订单流通常在这些水平上做出精准反应。
配置参数指南 请使用 MetaTrader 面板中显示的相同名称调整您的策略:
TimeFrame VWap:定义锚定周期(日线、周线等),指标在此周期重新开始成交量和价格计算。 Show Line STD 1 a 5:用于激活或停用 5 条可用波动带的视觉开关。 STD 1 a 5:标准差带的自定义倍数;用于扩大或缩小机构超买和超卖区域。
视觉与操作解读 系统投影出一条中央平衡线 (VWAP) 和五个波动包络线。内线(STD 1 和 2)通常充当趋势延续区,而外线(STD 3 到 5)则标志着极端衰竭水平。当价格触及上轨或下轨并表现出拒收迹象时,会出现有效的反转信号,寻求回归中心价值。
优化与建议 资产:指数(纳斯达克、德指 DAX)、黄金 (XAUUSD) 和主要货币对。 时间周期
FREE
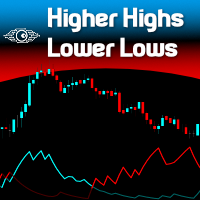
"Spotting emerging trends, defining correction periods, and anticipating reversals can benefit your trading in many ways..." So be it: Higher Highs & Lower Lows indicator. This is an indicator created by Vitali Apirine and presented to the public through the article "Time To Buy. Time to Sell - It's a Stochastic, Higher Highs & Lower Lows" in the Stocks & Commodities magazine . This is a Momentum indicator that helps determine the direction of a trend. Higher Highs and Lower Lows are two indicat
FREE

Trend Meter – Your Tool for Identifying Strong and Reliable Trends Trend Meter is an advanced and highly customizable indicator designed to help traders identify the direction and strength of the current trend with greater accuracy, significantly reducing noise and the reliance on single signals. It's the ideal solution for those seeking reliable signals and wanting to trade with more confidence. Key Features: Three Independent Trend Meters : Choose from various trend logic options, such as MACD

XAU Head Shoulders M15 Expert Advisor for MetaTrader 5 — Gold / XAUUSD focus
Version: 1.00 What it is XAU Head Shoulders M15 is an Expert Advisor for gold on the M15 chart. Head-and-shoulders style reversal pattern participation on M15 gold. Built for structured automated participation — not grid , not martingale . Evaluate on your broker and risk profile before any live use. This product is a technical system . Exact thresholds and entry equations remain internal product design and are not pub
FREE

SMC 拉里威廉姆斯结构是一种分析价格图表结构的指标,它使用著名交易员拉里威廉姆斯在其畅销书“短期交易的长期秘密”中的方法构建和连接最重要的摆动点,为适应市场结构和使用智能货币概念分析大型参与者的兴趣领域奠定了坚实的基础。 摆动构建的基础是简单而清晰的逻辑——在三个连续K线中,当中间K线相对于相邻K线形成明显的最高点或最低点时,固定关键的局部极值点。与比尔·威廉姆斯(Bill Williams)的经典分形不同,拉里·威廉姆斯方法的独特之处在于附加规则:如果中心蜡烛形成局部最高点(其最高价高于相邻蜡烛的最高价),那么其最低价也必须高于相邻蜡烛的最低价——相反一侧形成"底部"。同样,对于局部最低点——中心蜡烛的最低价低于相邻蜡烛的最低价,而最高价高于相邻蜡烛的最高价。这个条件提供了更清晰和明确的重要摆动识别,减少了虚假信号的数量,提高了构建结构的可靠性。 特别关注内部K线和外部K线的处理:指标忽略内部K线(inside bars),将其排除在关键摆动形成之外,以避免"噪音"极值,并专注于与市场参与者活动相关的重要K线,这些活动推动市场走势。这种方法对于分析市场结构和考虑累积/分发区域是必要

Clone MT5 是一款用于在图表历史中查找相似市场情形的交互式工具。您可以用框选中任意一段价格走势,Clone 会在同一交易品种的历史中寻找最相似的区段,在图表上标记它们,并让您与当前样本进行比较。 这不是信号指标,也不是智能交易系统(EA)。它是一款市场研究工具,用来帮助回答一个简单的问题:“过去哪里出现过类似的走势,之后又发生了什么?”
样本 (Sample) — 图表上由蓝色边框标出的区段。您可以直接使用鼠标改变它的长度和位置。 克隆 (Clone) — 与样本长度相同,并按照所选比较模式与样本最相似的历史区段。 波动范围 — 根据扩展的历史克隆样本后续走势,对近期可能出现的价格波动幅度进行估计。
工作方式:
指标会在最新的若干根K线上放置样本框,并自动开始搜索克隆。 拖动样本框两侧的手柄可以改变样本长度;拖动整个框可以移动所选区段。 释放鼠标按钮后,指标会基于可用历史数据重新开始搜索。 找到的克隆会标记在图表上,您可以通过面板按钮在它们之间切换。
主要功能:
默认分析样本之前最多 50,000 个历史窗口;搜索深度可以调整。 样本长度为 8 至 200 根K线,可

Advanced Gold Scalping Signal Indicator XAU M1 Trend Pro is a precision-built trend and signal indicator designed specifically for XAUUSD (Gold) on the M1 timeframe . It combines multi-layer filtering, volatility analysis, and smart scoring logic to deliver high-quality BUY and SELL signals while avoiding market noise. Built for traders who demand accuracy, speed, and consistency in fast-moving gold markets. Key Features Smart Buy & Sell Signals
Generates real-time alerts when high-probabili
FREE

Bneu Vortex Pro v2.03 — AMD Phase Engine + 30 Strategies + Adjustable Cloud AI Gate
Bneu Vortex Pro v2.03 is the upgraded MetaTrader 5 Expert Advisor built around an Accumulation / Manipulation / Distribution (AMD) phase engine. Instead of using one fixed signal, the EA first classifies market phase, then only enables the strategies designed for that phase. Every potential trade is also passed through an adjustable Cloud AI quality gate.
CORE UPGRADE
The previous simple scorer has been repla
FREE

Fractal3K Pro – 高精度顶底分型指标 简短描述:
Fractal3K Pro 是一款基于三K分型结构设计的专业交易指标,可自动识别市场顶分型和底分型,提供买卖信号的可视化提示,适合短线与中长线交易。 完整描述:
Fractal3K Pro 是一款专为捕捉市场关键反转点而开发的高精度顶底分型指标,基于三根K线分型结构,可自动识别顶分型(卖出信号)与底分型(买入信号)。指标提供可选严格模式(Strict Mode),有效过滤震荡市场的噪音,提高信号可靠性。同时支持D线触发模式,使信号在非重绘条件下更加稳定,适合结合EA自动交易使用。图表上使用红色和蓝色箭头直观显示买卖点,用户无需手动判断即可清晰捕捉交易机会。Fractal3K Pro 适用于黄金(XAUUSD)、外汇、指数以及加密货币市场,可帮助交易者优化入场与出场时机,提高交易决策的准确性与效率。该指标界面简洁,操作方便,适合新手和专业交易者使用,是一款功能全面、稳定可靠的专业交易工具。 功能亮点: 自动识别顶分型与底分型 可选严格模式,过滤震荡信号 可选D线触发模式,信号无重绘 图表上箭头提示买卖点 支持黄金、外汇、
FREE

Stop Switching Timeframes! Are you tired of constantly clicking back and forth between timeframes just to check key levels? Sniper Multi-SR is the ultimate multi-timeframe dashboard designed for traders who demand precision, clarity, and speed. This indicator plots critical Support and Resistance levels from your selected timeframes directly onto your active chart. It gives you a "Sniper's View" of the market, allowing you to identify institutional-grade levels at a glance without cluttering you
FREE

[FREE UTILITY] EA41 TANIN FOOTPRINT ORDER FLOW CHART
Tired of guessing what happens inside a candlestick? Transform your MetaTrader 5 into a professional volumetric analysis terminal. EA41 Tanin Footprint Order Flow Chart reveals the hidden bid and ask volumes at every price level, helping you trade alongside institutional money. 100% Free!
KEY FEATURES:
* See Inside The Candles: Displays raw order flow data directly on your chart, showing exactly where aggressive buyers and sellers are
FREE

保护资金,让盈利单瞬间变成零风险单。Auto Break-Even 是一款 MT5 工具,订单达到设定盈利时,自动把止损移至入场价(加可调偏移)。 让交易管理摆脱情绪:盈利单不再变成亏损单,您可以更有信心地持仓等待更大目标。 主要功能 - 自动保本:盈利 X 点后把止损移至入场价。 - 偏移(Pips Offset):加少量缓冲(如 0.3 点)以覆盖点差和佣金。 - 多品种:单个图表,或在一个窗口管理多个货币对。 - Magic Number 过滤:管理手动订单或其他 EA 的订单。 参数说明 - Auto Break-Even:开/关。 - Pips in Profit:触发保本所需盈利点数。 - Pips Offset:新止损距入场价的距离。 - Symbols:要管理的品种(如 EURUSD, GBPUSD),留空 = 当前图表。 - Magic Number:指定订单或全部订单。 适合:趋势交易者、波段交易者,以及难以克服心理障碍、不敢自己移动止损的人。 需要一键部分平仓 + 保本?试试 Close Partial MT5。 如果觉得有用,请留下简短评价——这对我帮助很大!
FREE

"CHOMPER PULLBACK"
Trend Pullback Reversed – Aggressive Reversal Strategy Trend Pullback Reversed is a high-performance Expert Advisor designed for M5/M15 trading on XAUUSD, Forex, and other major pairs. This EA implements an aggressive reversal pullback strategy , detecting deep pullbacks in trending markets and executing trades against the classic pullback signal , turning potential continuations into high-probability reversals. Key Features: Reversed Signal Logic: Buys on classic sell-pullba
FREE
交易系統 您選擇當日的一根柱子進行交易,當該柱子關閉時,機器人將發送兩個訂單,一個在蠟燭的高位,另一個在蠟燭的低位,再次獲得另一個將被取消 止損 在買入的情況下,止損將比低點低一格,在賣出的情況下,止損將比高點高一格 止盈 take可以設置你想要多少止損的範圍,可以在策略優化中進行costumized 優化 此機器人具有獲得風險回報的輸入,因此您可以在元交易的策略優化中運行它以獲得您將要交易的品種的最佳輸入 jiāoyì xìtǒng nín xuǎnzé dāngrì de yī gēn zhùzi jìnxíng jiāoyì, dāng gāi zhù zǐ guānbì shí, jīqìrén jiāng fāsòng liǎng gè dìngdān, yīgè zài làzhú de gāowèi, lìng yīgè zài làzhú de dīwèi, zàicì huòdé lìng yīgè jiāng bèi qǔxiāo zhǐ sǔn zài mǎi rù de qíngkuàng xià, zhǐ sǔn jiāng bǐ dī diǎn dī yī
FREE

Check Live Signal - Click Here
Markets are becoming increasingly volatile these days. Navigating wild price swings requires a systematic, mechanical, and disciplined approach rather than relying on directional guesswork. The Simple Hedge Replace Fibonacci Expert is a highly specialized MetaTrader 5 system designed specifically for active markets like XAUUSD. It utilizes a continuous hedge-replacement framework combined with a mathematical lot progression to manage trades and capitalize on pric
具有多时间框架支持、可自定义视觉信号和可配置警报系统的OsMA(MACD柱状图)指标。
自由职业编程服务、更新和其他TrueTL产品可在我的 MQL5主页 获取。
非常欢迎您的反馈和评价!
什么是OsMA? OsMA(移动平均振荡器)是MACD与其信号线之间的差值,也称为MACD柱状图。正值表示MACD位于信号线上方(看涨动量),负值表示MACD位于信号线下方(看跌动量)。零线穿越对应MACD/信号穿越,标志着潜在的趋势转变。增长的柱体显示动量增强,缩小的柱体显示动量减弱。 OsMA信号在零线穿越(趋势转变)、OsMA与价格之间出现背离以及检测到柱状图峰谷时生成。该指标帮助交易者高精度地测量动量运动的强度和方向。 功能特点: 带箭头和垂直线的视觉信号标记 三个独立信号缓冲区,具有可配置触发器 信号检测选项:方向变化、级别穿越、峰/谷 每个信号可配置警报(电子邮件、推送、声音、弹出窗口) 具有插值方法的多时间框架(MTF) 柱状图或折线图显示模式 多种颜色模式(单色、基于方向、基于级别) 通过iCustom访问缓冲区,可与专家顾问(EA)集成 输入参数: 基本设置: 快速EMA周期
FREE

Neural Market Scalper ML
Overview: Neural Market Scalper ML is an innovative automated trading solution designed specifically for traders seeking reliable, adaptive, and strategic performance in Forex and CFD markets. Utilizing advanced machine learning algorithms combined with proven trading indicators, it dynamically adjusts its strategies to current market conditions.
Recommended Instruments & Timeframes:
Recommended Symbol:ETHUSD, BTCUSD, XAUUSD Recommended Timeframe:M5 (5-minute chart)
FREE

Gatotkaca Support Resistance Trendline Indicator is a simple indicator that detects support, resistance and trendlines. It will helps you find breakout momentum based on lines calculated by this indicator. This is conceptually based on fractals, but with customizable periods. Compatible for any timeframes. You can customize how this indicator work by setting up the period input.
FREE
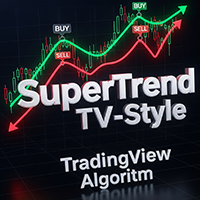
SuperTrend TV-Style replicates the classic SuperTrend indicator from TradingView, now available for MetaTrader. It uses ATR-based volatility to detect trend direction and plot dynamic buy/sell zones on the chart. Green line: uptrend Red line: downtrend Arrows: buy/sell signals at trend shifts Customizable source price (HL2, HLC3, etc.) and ATR method Simple, fast, and familiar - ideal for traders switching from TradingView or looking for a clean trend-following tool.
FREE

Short Description Yesterday H/L, Today H/L and ADR% on any chart. Color-coded gradient signals overextension at a glance. Full Description Mattrix Day Levels is a clean, lightweight indicator that displays the four key reference levels every day trader needs: Yesterday High and Low (YH, YL) Today High and Low (TH, TL) Average Daily Range percentage (ADR%) Drawn directly on the chart, the indicator marks the current trading day's progression against its historical range. The today range is shown
FREE

持 仓 监 控 面板 我在 自己 的 真实 交易 中 使用 这 款 指标。 我 不仅 希望 展示 交易 结果, 也 希望 让 大家 了解 我在 实际 市场 交易 中 使用 的 工具。 您 可以 在 MQL5 Signals 中 查看 我的 交易 历史、 未 平 仓 和 已 平 仓 交易, 以及 真实 交易 账户 的 统计 数据。 我的 真实 交易 账户: https://www.mql5.com/ru/signals/2385035?source=Site +Signals+My 这 款 指标 有 什么 用途? 当 同时 管理 同一 交易 品种 的 多个 仓 位 时, 了解 整体 持 仓 结构 非常 重要, 包括 Buy 和 Sell 的 总 手数、 净 敞口、 平均 价格, 以及 在 指定 亏损 限 额 下 可能 对应 的 价格 变动。 该 指标 将 这些 参数 整合 到 一个 信息 面板 中, 帮助 您 监 控 当前 持 仓 结构, 并 将 计算 出 的 价格 水平 与 当前 市场 价格 及 Equity 的 变化 进行 对比。 主要 功能 1. 计算 回 撤 价格 水平 指
FREE

Game Changer Gold — Smart Hedge Recovery EA for XAUUSD Game Changer Gold is an automated Expert Advisor designed primarily for XAUUSD (Gold) trading, with settings optimized for fast-moving market conditions on the M1 timeframe . The EA combines a trend-following + RSI pullback entry system with an intelligent opposite-direction hedge recovery mechanism . Instead of simply adding positions in the same direction when the market moves against a trade, Game Changer Gold alternates hedge positions a
FREE

LONDON CALLING是一款每日一次的均值回归EA,只交易伦敦16:00外汇定盘价(WM/Reuters fix)之后的行情。定盘价之前,实需资金流往往将价格推向一个方向;定盘价之后,这段冲高的一部分往往回落。LONDON CALLING只在定盘前45分钟的冲高超过2.5倍ATR的日子交易这一结构性偏差。定盘价2分钟后逆势入场一次,止盈为冲高幅度的40%回撤,止损设在冲高起点加ATR缓冲,持仓45分钟后强制平仓。每个品种最多一个持仓、每天一笔——绝不使用马丁格尔、网格或加仓摊平。一张图表同时运行14个货币对: 将EA挂到一张图表(推荐GBPJPY M1),即可同时监控并交易内置14对中通过ExtUse_开启的所有货币对。每对有独立的魔术编号、点差上限(x ATR)和滑点设置。所有货币对共用一套参数——无逐对拟合。默认开启6对: 在我的测试中(raw点差数据、M1、2020年3月–2026年8月、初始$10,000、扣除双边佣金$7/手;过去的成绩不保证未来表现),只有在夏令时和冬令时两个季节均盈利的货币对才默认开启(单对成绩为每笔风险0.5%): EURGBP PF 1.5
FREE
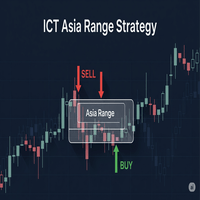
CT Asia Range EA: Trade the "Judas Swing" Like a Pro Are you tired of setting your bias correctly, only to be stopped out by a sudden, manipulative spike before the market moves in your intended direction? Do you see the market constantly engineering liquidity grabs above the Asian session high, only to reverse moments later? It's time to stop being the victim of stop hunts. The ICT Asia Range EA is meticulously engineered to turn this common market manipulation into your most reliable trading s
FREE

If you heard about The Wyckoff Method, Volume Spread Analysis, etc... You are probably searching for the candlestick indicator that shows you the Volume spread all over the current bar, signaling every types of market status... You can control the several Market Levels with custom colors...
It is up to you to decide how to use it. Our job is provide you with the indicator...
If you like this indicator, all I am asking is a little Review (not a Comment, but a REVIEW! )... This will mean A LO
FREE
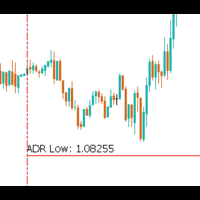
The Average Daily Range (ADR) is a powerful tool for traders, especially those focused on intraday and scalping strategies. It provides valuable insights into the expected price movement for the day and how price action is behaving relative to historical trends. The ADR indicator shows the following key information: Today's ADR : The typical range of price movement for the current trading day, based on historical data. 3x Today's ADR : Three times the current ADR, showing potential price moveme
FREE

XAU Regime Pulse AI is an automated trading EA made for gold trading .
It is designed to watch the market, understand the current price condition, and choose how to react automatically. This EA does not rely on only one trading style.
It looks at different market situations such as: when the market is trending when the market is moving in a range when price is starting to break out strongly By checking these conditions, it aims to use the most suitable trading logic for each situation. XAU Regim
FREE

用三种颜色查看每根K线的波动率对这个市场来说是低、中还是高。No repaint。
任何货币对、任何周期、任何市场。2分钟即可加载到您的图表。可在策略测试器(Strategy Tester)中免费测试。
Get more indicators here
Baselines, volatility filters and oscillators. No repaint.
为什么您需要它 同样的波幅在不同市场、不同时间含义不同。您看着最后一根K线,却无法判断它的波幅对当前这个市场来说是大还是小。手动设置的固定平均真实波幅(ATR)水平,一旦波动率变化就会过时。您在平静的市场和快速的市场里放同样的止损,市场会让您为这个差别付出代价。 您将获得 Fabii Atr Volatility Zones 按波动率区间给每根K线着色,让您不再凭肉眼判断行情的大小。 三个区间三种颜色,灰色代表低波动,黄色代表中波动,绿色代表高波动,一眼读懂市场。 区间来自市场自身历史的滚动百分位,您无需手动设置水平,同一套参数适用于任何货币对、指数、金属、加密货币或股票。 每根K线的波幅除以快慢两条ATR基准之和
FREE
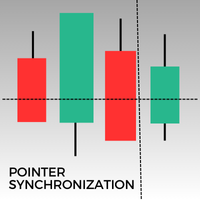
此MetaTrader 5指标可在相同资产的所有打开图表上自动同步指针。无论您是在1分钟图还是日线图上,指针都会自动对齐到所有打开窗口中的相同价格。此功能确保了分析的一致性和快速性,从而增强决策过程。同步多个图表之间的指针,对于希望在不同时间框架内保持价格变动准确概览的交易者来说,这是一个宝贵的工具。
FREE

通过我们创新的专家顾问——Awesome Comparative,了解令人敬畏的振荡指标的最有效策略。
使用Awesome Comparative,您可以在MetaTrader5策略测试器中进行全面测试,以确定哪些令人敬畏的振荡策略最适合您的经纪人、您喜欢的资产和时间框架。
我们的专家顾问提供了三种内置策略:Saucer(碟形)、Twin Peaks(双峰)和Zero Line Cross(零线交叉)。此外,它还允许您以9种不同的方式组合这些策略,使您能够获得结果和截图作为示例。
Awesome Comparative的一个优点是它专注于令人敬畏的振荡指标。它不包含额外的过滤器或进入触发器,让您可以全面探索和了解该指标的特点。此外,它不包含会改变仓位退出的止损或止盈水平,而始终遵循令人敬畏的振荡策略。总之,它是一个专为您的研究和学习目的而设计的工具。
此外,您将收到图表,您可以在图表上绘制其他对象和指标进行自己的分析和比较。请记住,这些测试应该在演示账户上使用策略测试器进行。
Awesome Comparative的多功能性使您可以将9种策略可能性与您想要的任何资产和时间框架
FREE

主要功能及设置说明 1️⃣ 灵活的图表集成 可与其他指标协同工作 – 添加任何技术工具,不会发生冲突。
单图表控制 – 要在单个图表上停止 EA,只需将其移除即可(请勿使用 Ctrl+E – 这会停止所有 EA 并破坏追踪止损)。
2️⃣ 多图表可扩展性 无限图表 – 同时运行 100 多个图表(前提是您的 PC/网络支持)。
轻量级设计 – 最低 CPU 占用率(直接基于指标的逻辑,无需繁琐的算法)。
3️⃣ 魔数系统 每个图表使用唯一的魔数 – 确保无交易冲突。
示例:
图表 1:Magic 1231242(5 分钟欧元/美元)
图表 2:Magic 1231352(1 小时黄金)
4️⃣ 多时间周期和多货币对策略 最佳时间周期:5 分钟、15 分钟、1 小时、4 小时、8 小时、12 小时、每日。
跨货币对分散投资 – 使用 EURUSD、USDJPY、黄金等货币对的价差 EA 来保持稳定。
自由切换时间周期 – 根据市场机会调整图表。
5️⃣ 利润最大化技巧 更高的时间周期 = 更顺畅的交易(建议使用 4 小时/每日,以减少错误信号)。
使用 ECN/
FREE
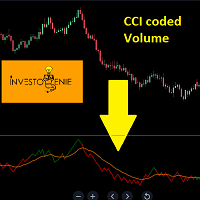
The Indicator is based on Commodity Channel Index (CCI) coded on Volume. The concept is to try and analyze the movement of Volume and Price in a certain direction
Concept:
If the Price of the indicator moves below the threshold price, it turns RED indicating the direction downwards is getting strong.
If the Price of the indicator moves above the threshold price, it turns GREEN indicating the direction upwards is getting strong.
The moving average acts as a great filter to decide entry/exit poi
FREE
SyntheticaFX Dex 900 Down EA
The SyntheticaFX Dex 900 Down EA is a specialized trading tool designed exclusively for the Dex 900 Down index. This Expert Advisor is engineered to deliver steady, long-term account growth by leveraging a strategic approach tailored to this unique market. For optimal performance, it is recommended to run the EA on a Virtual Private Server (VPS) with a minimum account balance of $300 using default settings. Ideal for traders seeking consistent progress, SyntheticaF

MTF RSI Candles on Current Chart MT5 Non-repainting multi timeframe RSI candle colouring Overview
MTF RSI Candles colours the candles on your chart using the RSI of a higher timeframe.
You keep working on the timeframe you normally trade. In the background the indicator watches RSI on a higher timeframe you choose. When that higher timeframe closes a candle, the RSI is read once and the colour is set: • MTF candle RSI closed above the level – Current chart candles turn the Buy colour. •
FREE

Professional Non-Repainting TMA Channel Indicator for MetaTrader 5 TMA Channel PRO Non Repaint is a professional trend and volatility channel indicator designed for traders who work with dynamic support/resistance zones, trend continuation, reversals, and channel-based trading systems.
MAIN FEATURES • Non-Repainting Logic
• Dynamic TMA Channel
• Vertical Histogram Cloud
• Median Trend Lines
• Buy & Sell Signal Zones
• Adaptive Volatility Structure
• Multi-Timeframe Compatibility
• Suita

Just One Click Trade Free demo version A manual trading panel for MetaTrader 5. You set the risk and the levels directly on the chart, while lot calculation and position handling are done automatically. This is not a trading robot — it is a tool for those who trade manually and want to do it faster and more precisely. Risk management The trade volume is calculated automatically — as a percentage of the balance or in the account currency. You can also open a trade with a fixed lot and switch bet

OrderX 是一款适用于 MetaTrader 5 的工具,可直接在图表上手动下单、按风险计算仓位并管理交易。 网站: https://orderx.quoc.app
Youtube: https://youtu.be/R0Es4O2qxxI 主要功能 根据设定的风险金额以及 Entry 与 Stop Loss 之间的距离计算交易手数。 基于图表上的 Entry 和 Stop Loss 价位下市价单、限价单和止损单。 直接在图表上拖动 Entry、Stop Loss 和 Take Profit 价位。 可选的分批 Take Profit,分别设置较低和较高的 R:R 目标。 按一个键即可从 ChartX(或 ZoomX)导入已绘制的多/空交易计划——Entry、Stop Loss 和 Take Profit 会填入草稿,并进行全部成功或全部失败的校验。 完整的键盘操作:X 面板,P 风险获取,Z 导入,J 执行,M/S/R/H/T 对应面板按钮,"-" 最小化面板。 每个图表可独立显示或隐藏面板;价格、风险和状态标志仍会在同一品种的各图表之间同步。 显示当前品种的持仓和挂单。

Close Vol (%N): 关闭您未平仓头寸的一半(或您想要的任何百分比)手数。例如,如果您有五个 0.06 手的未平仓订单,并且想关闭每个订单的一半,您只需点击它,它就会关闭每个单独订单的指定交易量。 Close Order (%N): 关闭您未平仓订单总数的一半(或您想要的任何数量)。例如,如果您有十个未平仓订单,并且想关闭其中一半或任何特定数量。 (注意:平仓过程基于订单利润;利润最低的订单最先被平仓)。 AUTO BE (ON & OFF): 一旦您的订单达到 100 点(或您指定的任何目标)的利润,就会自动将您的订单移至盈亏平衡点 (Break Even)。 (注意:它单独计算每个订单。例如,如果您有两个未平仓订单——一个盈利 100 点,另一个盈利 50 点——它只会将盈利 100 点的订单移至盈亏平衡点)。 SL @ ENTRY: 将所有未平仓订单的止损 (Stop Loss) 移至入场价(前提是它们处于盈利状态)。此外,它可以一次性移除所有订单的止损*(双击以执行此移除操作)。*
FREE

Raja Trading PRO - Smart Recovery Expert Advisor Product Description Every trader has experienced it: a position moves against you, floating losses begin to grow, and your capital becomes locked in the market while waiting for price to recover. During that time, new trading opportunities continue to appear, but your capital is still tied up in existing positions. Raja Trading PRO was built with a different philosophy: Fast Recovery, Consistent Growth, and Safety First. Instead of chasing large

VM Trend Candles Indicator - Complete Trend Trading Solution Trend Candles Indicator is a professional, intuitive, and easy-to-use Forex trading system designed to transform complex trend analysis into clear, high-probability trading signals. Based on proven trend-following principles and enhanced with intelligent market filtering, the indicator provides accurate BUY/SELL signals together with automatically calculated Stop Loss and Take Profit levels according to market volatility. The system su
This indicator provides a clear, at-a-glance dashboard for monitoring both the Relative Strength Index (RSI) and Stochastic Oscillator on any instrument or timeframe.
Whenever both RSI and Stochastic %K simultaneously exceed their respective overbought or oversold levels, the indicator displays an arrow signal in the indicator window.
These signals highlight strong momentum and can help traders quickly identify high-probability reversal zones. As with all my free tools, the arrow symbol can be e
FREE

The Stochastic RSI (StochRSI) is a technical indicator that combines the characteristics of the Relative Strength Index (RSI) with the Stochastic Oscillator, resulting in a more sensitive tool that generates a higher number of trading signals. Developed by Tushar Chande and Stanley Kroll, the indicator was designed to overcome a perceived limitation of the traditional RSI: the low frequency of overbought and oversold levels activation (commonly 80 and 20), especially in less volatile assets. Ho
FREE

VBOT HYDRA SCALP TREND Launch Special: Only $79 until April 30
After the promotion ends, the price will be $129 . VBOT Hydra Scalp Trend is a trend-following Expert Advisor designed for real-market execution, built around three core principles: simplicity – discipline – stability . Just attach the EA to your chart and run — no complex setup required. Key Features Trend-following logic aligned with market direction No Grid, no martingale, no averaging down Focused on trade quality and risk cont
FREE

Dow+ICT AI Visualizer | 连接AI大脑的钥匙 自动生成道氏拐点数据,让AI帮你分析市场——你的AI交易助理的数据接口
Dow+ICT AI Visualizer 不只是画线工具,更是“数据生成器”:
多品种支持,贵金属(XAU,XAG),原油(XBR,XTI),股指(US500,US100),外汇(EUR,GPD,CHF,JPY,AUD,CAD), 加密货币(BTC,ETH)
多周期支持,M5-M15-M30-H1-H4
自动生成道氏拐点数据(HH/HL/LL/LH序列)
自动整理K线数据(OHLC)
实时更新,保存到数据文件夹
TXT格式直接拷贝贴给AI 您的AI很聪明,但它需要有效的数据 ,
→ 你只需要在你的AI界面新开一个话题并贴入我们设计的提示词,
→ 然后不断更新最新的数据给它,你的AI就能基于道氏结构+ICT策略规则,分析出日内进场点,
这不是“看图说话”,这是“让AI真正理解市场”。
数据存放位置说明 :
您的MT5(桌面版)界面菜单"文件->数据文件夹" 或者快捷方式 "Ctrl+Shift+D"。打开后,继续进
FREE

Fibo Zones Manual — Manual Fibonacci with Buy/SL/TP Zones
Fibo Zones Manual is a fully manual Fibonacci tool — drag the two points to your swing high/low, exactly like the native MT5 Fibonacci retracement. On top of it, the indicator draws three colored zones directly on the chart: entry zone (Buy/Sell), SL zone, and TP zone, each with the exact price displayed.
Key Features
• Manual placement, drag-and-drop like the native tool • Colored zones (entry, SL, TP), fully adjustable • Price and pe
FREE

This is a simple Volume Weighted Average Price (VWAP) indicator. Simply add it to the chart and adjust the vertical line that is used as start anchor point and it is done.
Volume Weighted Average Price (VWAP) is a trading benchmark that represents the average price a security has traded at throughout the day, based on both volume and price. It is calculated as the sum of price times volume for each trade, divided by total volume.
FREE

EA Risk Commander is the central risk manager of the From Learn to Earn EA System for MetaTrader 5. The EAs of the system send every trade proposal to it; EA Risk Commander executes it, executes it with an adjusted lot, or rejects it, and writes the reason in its journal. It does not open trades by itself.
Important: it works only together with the EAs of the From Learn to Earn EA System (BoS CHoCH Engulfing, Engulfing In Engulfing, Manual Trader) in their versions with the input group "0. EA R
FREE

Moving Average ATR Channel Experimental indicator that constructs a dynamic price channel around a Moving Average by applying Average True Range multiples. The channel consists of an inner and outer boundary on both the upper and lower side of the moving average, creating a visual “tunnel” that expands and contracts with market volatility. Default parameter values are completely untested and are not derived from any back-tested strategy, statistical study, or recommended trading system. They se
FREE

在图表上显示前一日最高价、最低价、收盘价、交易时段开盘跳空和开盘区间,适用于指数、黄金、外汇和加密货币。
描述: Session Levels Ultimate 在任何品种的图表上直接绘制日内交易者每天关注的价位。 - 前一日最高价、最低价和收盘价 - 交易时段开盘线(默认服务器时间 16:30,即 GMT+2 / GMT+3 服务器上的美股开盘) - 时段开盘跳空:以价格和日 ATR 倍数显示,向上为绿色,向下为红色 - 时段开盘区间(默认前 60 分钟),以方框显示 跳空超过设定大小时在开盘提醒,可选手机推送。 时间为经纪商服务器时间:美股 16:30,法兰克福或伦敦 10:00,东京 02:00(GMT+2 / GMT+3 服务器),或您交易的任何时段。适用于指数、黄金、外汇、加密货币和股票,H1 及以下周期。 自动交易美股开盘:Index Bender EA https://www.mql5.com/en/market/product/200096
FREE

Convenient drawing of parabolic channels by four points (two lower and two upper extremums). Additional control keys: N (New) - Start drawing a new channel. C (Clear) - Deletes the current channel. By default, the current channel is the last channel. But you can click on the line of any channel to make it current. Click on the gear in the upper right corner to set some parameters for all channels or the current channel. All work is visible from the animated Gif.
Do not forget to express your w
FREE
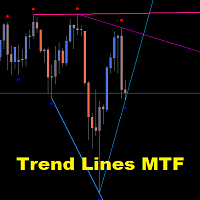
Gold TL MTF - this is a fine stock technical indicator. The indicator algorithm analyzes the movement of the asset price and reflects trend lines along the fractals of a specific timeframe (TF).
Benefits of the indicator: The indicator produces signals with high accuracy. The confirmed signal of the indicator does not disappear and is not redrawn. You can trade on the MetaTrader 5 trading platform of any broker. You can trade any assets (currencies, metals, cryptocurrencies, stocks, indices e
FREE

clock, Server Time, Local Time, MT5 Clock, Clock Indicator, Digital Clock
DualClockPro - Local and Server Clock for MetaTrader 5 DualClockPro is a visual clock indicator for MetaTrader 5 that displays local computer time and trading server time directly on the chart. It also supports displaying the corresponding dates, helping traders monitor time differences between their local environment and the broker's server. The panel has a compact design and customizable settings, allowing users to ada
FREE

KS 日/周/月分隔线及倒计时指标
这是一个专为 MetaTrader 5 设计的视觉增强指标,旨在帮助交易者快速识别图表上的时间周期分界线,同时提供实时K线收盘倒计时功能。
主要功能
1. 垂直时间分隔线
日分隔线:在每个新交易日开始处绘制垂直线。
周分隔线:在每周开始处(以周一为准)绘制垂直线。
月分隔线:在每月开始处绘制垂直线。
每种分隔线均可完全自定义:
可单独启用或禁用
颜色、线宽及线条样式(实线、虚线、点线等)
可选是否在直线上显示文本标签
2. 智能顶部标签
在图表顶部(固定 Y 轴位置)的每个分隔线上方显示信息标签。
标签示例:
15/07
Wk 15/07
Jul 2026
15/07 | Wk 15/07 | Jul 2026
3. K线倒计时面板
一个时尚、紧凑的面板,显示多个时间周期的实时K线收盘倒计时。
支持的时间周期(用户可选):
M1, M5, M15, M30, H1, H4, D1
面板特性:
双列布局(每行显示 2 个时间周期)
简洁的数字倒计时格式 (HH:MM:SS)
可自定义位置(4 个角落)、
FREE
具有多时间框架支持、可自定义视觉信号和可配置警报系统的Williams %R指标。
自由职业编程服务、更新和其他TrueTL产品可在我的 MQL5主页 获取。
非常欢迎您的反馈和评价!
什么是Williams %R? Williams %R是由拉里·威廉姆斯开发的动量振荡器。它在-100到0的范围内运动。接近0的值表示超买状态,接近-100的值表示超卖状态。Williams %R是一个反向随机振荡器,测量收盘价相对于特定时期高低点范围的位置。超买/超卖水平(-20和-80)的穿越产生交易信号。 该指标帮助交易者识别潜在的反转点:当%R向下穿越-20线时,可能预示着即将到来的调整;当它向上穿越-80线时,可能表明可能的反弹。Williams %R与价格之间的背离可能在趋势反转前提供强烈的预警信号。 功能特点: 带箭头和垂直线的视觉信号标记 三个独立信号缓冲区,具有可配置触发器 信号检测选项:方向变化、级别穿越、峰/谷 每个信号可配置警报(电子邮件、推送、声音、弹出窗口) 具有插值方法的多时间框架(MTF) 柱状图或折线图显示模式 多种颜色模式(单色、基于方向、基于级别) 通过iCu
FREE

ATC Currency Strength Meter 在一个面板上测量 USD、EUR、GBP、JPY、AUD、NZD、CAD 和 CHF,并将它们从最强到最弱排名。
此工具也是 All In One Trade Management Panel MT5 的一部分,与仓位工具、交易管理和绩效分析一起
演示账户的免费试用版 ——在实时图表上试用,无时间限制。
计算方法:
• 强度是自所选蜡烛开盘以来的百分比变化,取自7个主要USD货币对。
• USD强度是其他货币对其走势的平均值。
• 经纪商符号后缀(例如 EURUSD.m)会自动检测。
主要功能:
• M15、H1、H4、D1 和 W1 的时间周期按钮。所选时间周期会为每个图表记住。
• 带居中条的排名行:盈利向右为绿色,亏损向左为红色,并显示百分比值。
• 最强对最弱:由顶部和底部货币组成的货币对,当您的经纪商提供该符号时,显示其自身的百分比变化。
• 每秒更新。
输入:
• 从N根蜡烛前的开盘测量(默认1)
• 面板位置和宽度
您的经纪商必须提供7个主要USD货币对。缺少货币对的货币显示为 n/a。
FREE

TradeAquila Monitor streams your MetaTrader 5 account to TradeAquila, a real-time dashboard for every trading account you run: broker, prop firm and crypto accounts, side by side. What it does Pushes a live snapshot of your account every 10 seconds: balance, equity, margin, open positions with their floating P/L, pending orders, and the closed trades of your history. On the dashboard you get today's realized P/L with its reset at 17:00 Chicago time, your prop firm rules (daily loss, max drawdown
FREE

A daily loss limit only helps if it is enforced, also on the day you would rather ignore it. Daily Loss Limit enforces it: you set one line for the day, and when equity reaches it, Daily Loss Limit closes everything and keeps the account flat until the next daily reset. Free, fully working, no time limit. No nag screens, no upgrade prompts inside the program. It never opens a trade on your account. What it does Daily loss limit in money or in % of the day reference (default: 5 %). The day refere
FREE

If you love this indicator, please leave a positive rating and comment, it will be a source of motivation to help me create more products <3 What is Schaff Trend Cycle indicator? The Schaff Trend Cycle (STC) is a technical analysis indicator used in trading and investing to identify trends and generate trading signals. The STC is designed to identify trends and trend reversals by measuring the strength of the trend and the speed of price changes. The STC indicator helps to identify trends in a
FREE

此免费EA专用于M5时间周期。 此外,交易货币仅限日元(JPY)计价。 其设计规格不支持以美元(USD)或欧元(EUR)计价进行回测或实际交易。 交易手数也固定为0.01。 请将其视为仅供回测使用的测试版EA。 由于我本人也在实际前瞻交易中使用该EA,如果下载实时信号的需求持续增加,我计划将其公开。
TYO EA LAB的开发理念
TYO EA LAB致力于开发融合了自营交易公司运作理念的量化EA。 我们重视的并非单个EA的短期业绩,而是多种策略组合后的稳定性、分散性以及实际操作中的可复现性。
在开发过程中,除了长期验证数据外,我们还运用了基于AI的数据挖掘技术。 通过对市场数据进行多角度分析,提取如时间段、月度趋势、价格波动偏向等反复出现的统计优势,以此构建交易逻辑。
此外,TYO EA LAB的EA作为量化EA,其设计前提是支持多策略同时运行。 各EA虽各具特色,但设计上旨在使整个投资组合协同运作,其真正的优势在组合运行时比单独运行更能充分展现。
TYO EA LAB以 AI ×
FREE

Spots EA — Candlestick Patterns, Fully Automated
Spots EA turns the Spots indicator into a fully automated trading robot, trading the classic candlestick patterns — engulfing, hanging man, doji and more. It was built with one goal in mind: dependable automation with low drawdown. Ready-to-use set files are included.
What it does for you Pattern-based automation: trades classic candlestick signals automatically. Built for low drawdown: designed around steady, controlled trading. Set files inclu
FREE
The Stochastic Momentum Index (SMI), developed by William Blau and featured in the January 1993 edition of Technical Analysis of Stocks & Commodities magazine, introduces a unique perspective to trading analysis. Distinguished from the conventional Stochastic Oscillator, which evaluates the current close in relation to the recent x-period high/low range, the SMI assesses the close's position relative to the midpoint of this range. This innovation yields an oscillator with a range of +/- 100, re
FREE

Trade Sessions Visualizer – Professional Session Indicator for MT5 Overview Trade Sessions Visualizer is a powerful, lightweight indicator that plots major global trading sessions directly on your chart. Each session is displayed as a clearly colored rectangle spanning its actual high and low prices, with an optional overlap highlighting and customizable labels. Gain instant visual insight into when and where the market is most active—perfect for Forex, indices, commodities, and crypto traders.
FREE

RSI EA is a fully automated Forex trading strategy based on the MACD indicator, one of the most popular and widely used trend-following methods in technical analysis. This expert advisor automatically opens and manages buy and sell trades using RSI to capture market momentum while removing emotional decision-making. Premium advanced version with +40 filter! : Click Here Or search "RSI ProLab mt5" on the market
FREE

Big Figure Levels – Key Psychological Price Zones for MT5 Big Figure Levels is a professional trading tool designed for MetaTrader 5 that automatically identifies and draws major psychological price levels, including quarter and half levels. These levels are known to act as powerful support and resistance zones due to their influence on both institutional and retail trader behavior. This indicator is perfect for any trading style—whether you're a scalper, day trader, or swing trader—and is compa
FREE
MetaTrader市场是独有的自动交易和技术指标商店。
阅读MQL5.community用户备忘更多地了解我们提供给交易者的独特的服务:复制交易信号,自由职业者开发的自定义应用程序,通过支付系统完成的自动付款和MQL5云网络。
