 MetaTrader 5
 专家
专家 指标
指标 程序库
程序库 实用工具
实用工具 窗口小部件
窗口小部件 规则
规则适用于MetaTrader 5的技术指标 - 189
 技术指标的信号外汇和股票市场的开仓交易和平仓交易起着至关重要的作用。指标的本质就是一种交易品种的数学转换,旨在预测未来的价格变化。
测试技术指标可以更有利于预测市场行为并从中获利。
技术指标的信号外汇和股票市场的开仓交易和平仓交易起着至关重要的作用。指标的本质就是一种交易品种的数学转换,旨在预测未来的价格变化。
测试技术指标可以更有利于预测市场行为并从中获利。 
VibeFox Market Scanner — 一个由 30 项指标构成的共识仪表盘,将每个品种从 Strong Buy 到 Strong Sell 逐一评级 VibeFox Market Scanner 是一款面向 MetaTrader 5 的实时多品种仪表盘。对于您关注的每个品种,它会在当前图表周期上运行一组 30 项经典指标,让每项指标投出一票,并将这整群意见浓缩成一个色彩编码的单一评级——从 Strong Buy 经 Neutral 到 Strong Sell。您无需打开十几张图表逐一手动解读每个振荡器,只需在一个紧凑、可交互的面板中,即可看到整个自选清单的聚合市场情绪。 指标的工作原理 其引擎是一台投票机。对于清单中的每个品种,每项启用的指标都会在当前周期上进行评估,并返回三种投票之一: Buy (+1)、 Neutral (0)或 Sell (-1)。所有启用指标的投票被计数并取其平均值,该平均值被映射到一个五级汇总评级上。由于单个品种可能与整个市场逆向运行,每个品种都被独立评估,因此仪表盘会显示共识在何处看涨、在何处看跌,以及在何处意见分歧。 网格跟随图表自身的周期:将

概述: DYJ BetaLogicDynamics 是一款专为追求数据严谨性与市场概率分析的交易员打造的专业级分析指标。该指标摒弃了传统滞后信号,核心搭载了我们自主研发的 Beta 分布拟合引擎 ,通过计算价格偏离的相对置信度,精准识别市场极端状态。 核心功能: Beta 分布引擎: 不同于依赖移动平均线的传统指标,我们的核心算法通过动态统计拟合,将价格波动映射至概率密度函数中,从而量化市场趋势的真实概率。 极端行情锁定: 高精度识别超卖/超买区域,并在触发时自动锁定极端行情信号。 专业元数据集成: 实时监控并输出信号源详细信息,包括程序类型、交易品种、周期、精确触发价格及时间。 轻量高效: 经过深度性能优化,确保零延迟运行,提供专业、简洁的可视化交互界面。 通用架构: 采用模块化开发,确保核心算法在不同周期与品种下保持逻辑一致性。 技术规格: 分析方法: 统计学 Beta 概率建模。 输出形式: 实时可视化信号,支持多种定制化提醒(推送通知、邮件、终端弹窗)。 配置管理: 简易参数设置,支持多语言(中文/英文)切换。 参数配置说明: 参数名称

KS Fibonacci Level Alert 是一款专为 MetaTrader 5 设计的、用户友好的自定义斐波那契回调/扩展指标。
核心功能
1. 一键绘制与可拖动斐波那契工具
点击“+ New Fibonacci”(新建斐波那契)按钮,即可在图表上立即创建新的斐波那契对象。
该工具完全支持拖动操作——拖动任意锚点即可设定波段高点或低点。
开箱即用,支持回调(0–1 之间的水平位)及扩展(>1 或负值的水平位)。
2. 图表内设置面板
使用“Show/Hide Panel”(显示/隐藏面板)按钮切换面板显示。
实时自定义选项:
颜色(循环切换预设颜色)
样式(实线、虚线、点线等)
线宽(1 到 5)
标签(显示/隐藏水平位上的百分比及价格标签)
声音提醒(内置 MT5 声音或自定义 .wav 文件)
推送通知(发送至移动端 MT5 应用程序)
独立水平位开关——可针对新工具单独启用或禁用 15 个斐波那契水平位中的任意一个
3. 智能提醒系统
监控所有已绘制工具上的活跃斐波那契水平位。
当价格触及或穿过已启用的水平位时触发提醒。
提醒类型:

KS 斐波那契趋势线价格预警组合工具
这是一款专为 MetaTrader 5 设计的多功能预警指标,将三种绘图工具整合在一个便捷的套件中:
主要功能
三合一绘图工具(均内置价格触碰预警功能):
水平价格线(经典的支撑/阻力位预警)
趋势线(可拖动,支持倾斜角度)
斐波那契回调/扩展工具(支持自定义水平位)
当价格触碰任意线条或水平位时触发智能预警:
声音提示(使用 MT5 内置音效或自定义 .wav 文件)
弹出式预警窗口
移动端推送通知
视觉反馈(触发后线条/水平位变为灰色)
核心能力
统一控制面板,用于创建和管理所有工具
一键创建按钮:+ 新建预警线、+ 新建趋势线、+ 新建斐波那契工具
对象完全可拖动(遵循 MT5 标准操作习惯)
通过面板自定义默认设置:
颜色、样式、线宽
斐波那契水平位选择(包含 15 个标准水平位,用户可自由启用或禁用任意组合)
标签显示(百分比 + 价格)
声音、弹窗及推送通知的开关控制
持久预警——记录触发状态,直到您再次移动该对象
重新加载到图表时自动恢复所有对象及预警设置
支持滚动的设置面板,便于管理

Read detailed blogpost here: https://www.mql5.com/en/blogs/post/772233
Features at a Glance Linear regression center line with statistically accurate curved deviation bands Three band calculation modes: RMA of High-Low Range, Standard Deviation, and True ATR Candle coloring in two modes: Heatmap (position inside the bands) and Volume-Weighted Colored Bars (VWCB) Straight regression channel (Channel 1) with up to 3 deviation levels Future projection channel (Channel 2) with optional Higher Timef

Introducing Oneiro UMBS! This indicator is built to enter trending markets with an optimal position for more profitable trades. Two MAs identify the trend and an envelope to assure the most optimal entry.
Recommendations:
This Indicator best works on trending pairs such as XAUUSD , so is the default settings. If you want to try other pairs, you can play around the settings.
Risk: 1:1 Risk ratios has the highest win rate and best suitable for prop firm trading! Always risk 1% for best consiste

MTTD Buy Sell Signals is an all-in-one chart tool designed to help traders spot high-probability reversal zones and key intraday price levels without cluttering the chart. Key Features: 1. Dual RSI Signal Engine (14 & 7 period)
Two independent RSI-based detectors run in parallel, each fully configurable: Overbought/Oversold thresholds Bullish/Bearish Engulfing confirmation Hammer / Shooting Star pattern detection (Fibonacci retracement based) "Two consecutive candles" momentum confirmation
Each

KS RSI 水平线警报(支持背离监控)
这是一款适用于 MetaTrader 5 的 RSI 指标,它结合了标准的相对强弱指数(RSI)与直观易用的水平警报线功能,这些警报线直接绘制在 RSI 刻度(0–100)上。
主要功能:
标准的 RSI 计算(默认周期为 14,参数完全可自定义)
点击创建警报线:点击“+ New RSI Alert Line”(新建 RSI 警报线)按钮,即可在当前 RSI 数值处立即添加一条可拖动的水平线。
可拖动线条:上下拖动任意线条,即可精确设定 RSI 警报水平(例如 30、50、70 等)。
多重警报系统:当 RSI 穿过任意警报线时,会触发以下警报:
声音警报(使用 MT5 内置声音或自定义 .wav 文件)
弹窗警报 (Alert())
移动端推送通知
视觉反馈:线条被触发后会改变颜色(默认为灰色),便于区分待触发与已触发的警报。
设置面板(可切换显示/隐藏):
更改新线条或选中线条的颜色、线型及宽度
开启/关闭声音和推送通知
测试声音
将设置应用于选中线条
删除选中线条
管理按钮:
新建警报线
删除所有线

Order Block & Liquidity Detector is a Smart Money Concepts (SMC)-based indicator that identifies institutional footprint zones directly on your chart — helping traders spot potential reversal and continuation areas where large market participants may have entered positions. Key Features: 1. Automatic Order Block Detection
The indicator scans for swing highs and swing lows using a configurable lookback length, then identifies the last opposing candle before the swing — the classic order block de

JTC Smart Gold Indicator is a professional trading indicator designed exclusively for the XAUUSD (Gold) 5-minute timeframe on MetaTrader 5. It focuses on identifying high-quality trading opportunities during the New York session while helping traders maintain a disciplined and structured trading approach. Unlike indicators that generate excessive signals, JTC is designed to prioritise quality over quantity, typically highlighting a small number of carefully selected opportunities during active

VSA Wyckoff Volume is a volume analysis tool built on Volume Spread Analysis (VSA) and Wyckoff methodology principles. Instead of showing raw volume bars, it classifies every bar's volume relative to its own trailing average, making it immediately clear when a bar's activity is unusually high or low — often the first sign of institutional participation, climax moves, or exhaustion. Key Features: 1. Six-Level Volume Classification
Each volume bar is compared against a Wilder-smoothed volume movi

Order Block Liquidity Sniper is a complete institutional-grade market structure system built for traders who want to read price action the way professional and institutional participants actually trade it, rather than reacting to lagging classic indicators after the move has already happened. Instead of offering a single isolated tool, it combines seven distinct analytical engines into one unified, non-repainting indicator: a market structure engine that detects and labels breaks of structure an

ATR-normalized MA slope in degrees, comparable across all instruments. Color-coded labels flag strong trend moves.
AngleIndicator turns the slope of a simple moving average into an objective, comparable angular measure. Most "angle" indicators calculate slope from the raw price change, so the result depends on the instrument's absolute scale and on the timeframe: the same degree value means completely different things on a currency cross, an index, or a volatile symbol. AngleIndicator solves th

English Version Unlock the Power of Volume with Next-Generation Volume Profile This advanced Volume Profile indicator transforms your MetaTrader 5 chart into a powerful volume analysis tool. Unlike standard volume indicators that only show volume over time, this tool displays volume distribution across price levels , allowing you to pinpoint exactly where the "big money" is trading. Why choose this indicator? Dynamic Price Bins: Set your own precision (number of rows) to view volume clust

Magic KAMA System is a trading system based on Kaufman's Adaptive Moving Average (KAMA), with several other indicators as filters. This algorithm provides highly reliable entry points, and its simple settings allow it to be used for any symbol and trading style. Settings for notification alerts and SL/TP multiples of the ATR are included, making it flexible enough to handle market fluctuations. Similarly, settings for all indicators used are customizable. Signals are generated at the closing of

Aegis Quantum Reversal is a straight rules-based trading tool built to stop you from chasing bad entries, most indicators repaint or shift arrows backward to look good on past history but this one doesn't, the signals plot only when a bar closes and what you see on the chart stays there forever with no tricks, there is no generic retail moving average lag either because the engine uses a refined Nadaraya-Watson core combined with standard deviation lookbacks, it creates dynamic bands to map

ULTIMAX DASHBOARD — YOUR ENTIRE FOREX MARKET ON ONE SCREEN
One screen. All 28 pairs. One clear verdict. Stop flipping through charts to find and confirm your next setup.
Great setups don't wait while you juggle ten indicators across dozens of charts. Ultimax Dashboard replaces that whole ritual with a single, information-dense terminal panel that scans all 28 major, minor and cross forex pairs every second and ranks them — so the best opportunities find you. It's a decision-support scanner:

Hull Suite — Responsive Trend Engine for MT5 (figure 1) Overview **Hull Suite** brings the famous **Hull Moving Average** — created by Alan Hull in 2005 — to MetaTrader 5 in a single, flexible, ready-to-trade package. The Hull Moving Average is prized for one reason: it is **extremely responsive yet remarkably smooth**. It hugs price closely, cuts lag to a minimum, and still delivers clean, readable curves — exactly what a discretionary or systematic trader needs to read trend direction at a gl

Structure Flow MT5 – Smart Money Concepts Indicator Structure Flow MT5 is an advanced market structure indicator for MetaTrader 5 designed for traders who use Smart Money Concepts (SMC), Price Action, and institutional trading techniques. The indicator automatically detects and visualizes key market structure elements directly on the chart, helping traders understand price movement without manually drawing levels. Main Features Automatic Market Structure detection (BOS & CHoCH) Swing High /

Let's be honest for a second.
You've watched price sweep your stop, then rocket in the exact direction you wanted. You've entered on a "clean break" that turned out to be a trap. You've stared at a chart covered in lines and still had no idea what the market was about to do.
That's the gap SMC Structure Edge closes.
This isn't another indicator that paints pretty swing labels and leaves you to figure out the rest. It watches the market the way smart money actually moves it — and it tells you

Angel Signal Panel is a chart-based market observer for MetaTrader 5. It reads native MT5 candle data and displays a compact decision panel directly on the chart.
The panel combines EMA trend stack, MACD and RSI momentum, range structure, breakout context and latest closed candle confirmation.
The output is intentionally simple: CALL / UP, PUT / DOWN, or NO PREDICTION, with confidence, selected symbol, signal timeframe, next-candle timing, spread status, UP and DOWN scores, agreement count, c

Market Structure Indicator The Market Structure Indicator is a powerful smart trading tool designed to help traders understand price action and identify high-probability trading opportunities with ease. It automatically detects key market structure events, eliminating the need for manual chart analysis. Key Features Automatic Break of Structure (BOS) Detection – Instantly identifies when the market confirms a continuation of the current trend. Change of Character (CHoCH) Detection – Detects pote

Pattern Builder Pro — MetaTrader 5 自定义摆动形态扫描器 Pattern Builder Pro 是一款 MetaTrader 5 指标和市场扫描工具,允许交易者手动绘制任意自定义摆动形态(swing pattern),并在市场观察窗口的所有品种、多个时间周期上实时扫描相似的价格形态。与仅支持头肩形、三角形、旗形等固定形态的传统图表形态指标不同,这款 MT5 形态识别工具让您自行定义价格行为形态——任意数量的摆动点、任意形状——并通过包含 11 项加权指标的相似度引擎(含动态时间规整 DTW 与普氏分析 Procrustes)实时查找匹配设置。 主要功能: 交互式形态绘图板,基于 XY 网格,可像素级精确放置摆动点 多指标相似度引擎:几何形状、角度序列、斜率、回撤比例、扩展比例、摆动数量比、宽高比、趋势方向、结构顺序与波段振幅顺序 可选启用动态时间规整(DTW)与普氏分析,实现与尺寸、方向无关的形态匹配 当日最高价/最低价(HOD/LOD)点验证,精确过滤交易设置 异步市场扫描——可在 M5 至 D1 多个周期扫描数百个品种而不卡顿终端 可排序、分页的

How it works Single-signal reversal tools fail because reversals are multi-condition events. ReversalLab scores a confluence stack and only prints above threshold: – Liquidity sweep of a scored pool — the fuel event. This condition is mandatory. – Statistical momentum divergence — price extreme versus momentum vector, t-stat filtered. – Volume climax or absorption at the extreme, from the Effort-vs-Result module. – Displacement confirmation — a break of the most recent minor structure wi

Trend Horizon Pro 是一款专为黄金 (XAUUSD) 市场打造的专业级技术分析指标。它通过深度融合移动平均线趋势分析、RSI 动能监测以及布林带波动率刻画,将复杂的市场数据转化为直观、可执行的交易信号。(限量10份) 多维度过滤机制 :将趋势跟踪与动能分析相结合,大幅降低市场伪信号(杂讯),精准锁定高概率交易区间。 波动率感知力 :能够根据当前市场波动程度自动识别价格行为,帮助交易者在“真突破”与“假震荡”之间做出冷静判断。 直观的视觉反馈 :设计理念强调“决策效率”。无论你是短线剥头皮还是中长线趋势交易者,其视觉提示都能让你瞬间与市场行情同步。 专业级洞察 :化繁为简,Trend Horizon Pro 为你提供在高压黄金市场中保持清醒所需的关键技术支撑。 拓宽你的交易视野。Trend Horizon Pro,与你一同领航黄金市场。

How it works QuantScore is the suite's flagship: a multi-factor model compressing six independent measurements into one −100…+100 edge score. – Momentum factor — the regression t-stat from the VectorMomentum core. – Mean-reversion factor — z-score of price versus its volume-weighted mean, contributing against stretch when the regime is mean-reverting. – Regime factor — the RegimeLens state sets the weighting between momentum and reversion. This dynamic weighting is the secret sauce; static

How it works – Multi-anchor engine — Session, Weekly, Monthly and Quarterly VWAPs simultaneously, plus auto-anchored VWAPs from the most recent significant swing high and low, plus unlimited manual click-to-anchor points (news, earnings, breakouts). – True sigma bands — ±1/±2/±3 sigma computed from the volume-weighted variance of price around VWAP, not a lazy standard deviation of closes. Bands expand realistically with participation. – Interaction signals — first-touch pullback to session
How it works – Strict validation chain — a candidate becomes an order block only if all hold: it is the last opposing candle before a displacement move; the displacement breaks structure; the move leaves an imbalance (FVG) behind; and displacement volume exceeds its time-of-day baseline. This removes roughly 90% of what other indicators mislabel as order blocks. – Grading (A/B/C) — from displacement magnitude, liquidity swept by the block before departing, and higher-timeframe alignment. –

KT Equal Highs & Equal Lows 可自动识别价格在同一水平形成两个或多个摆动高点(Swing High)或摆动低点(Swing Low)的位置,并将这些区域标记为流动性池。Equal Highs 代表买方流动性(Buy-Side Liquidity),Equal Lows 代表卖方流动性(Sell-Side Liquidity),而这些位置正是价格在反转之前经常会触及的目标区域。 该指标仅在K线收盘后确认摆动点,因此不会发生重绘。它会将彼此接近的摆动点合并为一个流动性池,并为每个流动性池计算0到100的质量评分,让您快速判断哪些位置更值得关注。同时还会持续跟踪每个流动性池的状态,包括是否仍然有效、是否已经完成流动性扫单(Sweep),或是否已经被有效突破(Break)。适用于任何交易品种及任何时间周期。
功能特点
根据已确认的摆动点自动识别 Equal Highs(EQH)和 Equal Lows(EQL)。 仅使用收盘K线确认,不重绘。 基于 ATR 的容差算法,可根据不同交易品种和时间周期自动调整相等高低点的判定范围。 将相邻摆动点合并为同一个流动性池,并

How it works – Impulse-leg detection — identifies displacement legs (velocity + range expansion + structural break) worth continuing with. – Zone projection — for each impulse, projects the confluence-cluster pullback zone: the overlap of the 38–62% retracement band, the breakout origin (old resistance/new support), any fair value gap inside the leg, and the auto-anchored VWAP from the leg's origin. Where two or more overlap, a graded continuation zone prints. – Regime gate — zones only pr

How it works – Detection with quality filters — true three-candle imbalances filtered by minimum gap size (ATR-scaled), displacement quality of the middle candle and volume, killing the micro-gap spam that makes FVG tools unusable on low timeframes. – Fill-state tracking — each gap tracked live: Untouched, Partially filled (with fill %), Fully mitigated, Inverted. – The headline feature — Inversion (failed FVG): when price closes entirely through a gap, the imbalance inverts. Failed bullis

How it works – Pool detection — equal highs/lows (within an ATR-scaled tolerance), unswept swing highs/lows, session and daily/weekly extremes, and trendline liquidity (3+ touch diagonal clusters where stops accumulate). – Pool weighting — each pool scored by touch count, age, round-number proximity and origin timeframe, then drawn with thickness/opacity proportional to score. The chart literally shows where the fuel is. – Sweep engine — a sweep registers when price wicks through a pool an

How it works An inducement trap is a sequence, not a candle pattern. TrapRadar's state machine requires all four legs: – Bait — an obvious level forms (minor swing, equal highs/lows, range boundary) that retail will trade the breakout of. – Trigger — price breaks the level and actually attracts participation; relative volume rises on the breakout bar, confirming traders took the bait. – Trap spring — within K bars a displacement candle (range greater than 1.5× ATR, closing 70%+ through its

ATR tells you yesterday's range. VolCore models the volatility cycle itself: – Estimator stack — Parkinson, Garman-Klass and Yang-Zhang realized volatility (OHLC-based estimators are 5–8× more efficient than close-to-close). Select one or blend. – Percentile ranking — current volatility ranked within its own 250-bar distribution, giving a universal 0–100 Vol Rank comparable across all symbols. – Squeeze detection — Vol Rank below a threshold and still compressing (negative vol-of-vol slope

يقوم Support & Resistance PRO هو مدير رئيسي لمنصة MetaTrader 5 باكتشاف ورسم مستويات الدعم والمقاومة المهمة ليساعد في تحقيق النجاح في تحقيق النجاح.
المميزات:
اكتشاف صناعي لمستويات الدعم والمقاومة الشريرة.
تحديث جميع المستويات مع حركة السعر.
يعمل على جميع العملات، الذهب، الفضة، المؤشرات، العملات الرقمية.
مناسب لجميع الأطر الزمنية.
واجهة بسيطة وسهلة الاستخدام.
يساعد في مناطق محددة من الانعكاسات والاختراقات المحتملة.
للمبتدئين والمحترفين.
يدعم:
• الفوركس
• الذهب (XAUUSD)

How it works No RSI, no stochastic. VectorMomentum measures momentum three independent ways and demands agreement: – Regression-slope t-statistic — a linear regression on log price over N bars; the t-stat of the slope (slope divided by its standard error) gives statistically-significant momentum that self-normalizes across symbols and volatility levels. – Volume-pressure-weighted rate of change — ROC weighted by relative tick volume, so momentum on dead volume scores lower than the same move

精准进行机构供求区交易 告别滞后指标。 SmartZone Pro Sniper 是一款先进的价格行为( Price Action )算法,旨在自动检测结构性供给与需求区。该工具专为精准交易而生,帮助您识别市场最可能发生反应的区域,从而有效管理您的风险回报比(R:R)。 通用市场兼容性 该算法可动态适应不同的市场状况和时间框架。它适用于: 外汇与货币: 主要和次要货币对。 加密货币: BTC/USD、ETH/USD 等。 合成指数: 针对 Boom & Crash 和波动率指数进行了特别优化。 大宗商品与金属: XAU/USD(黄金)、WTI原油。 股票与指数: US30、NAS100。 客观与透明 与其他使图表杂乱的普通指标不同,SmartZone Pro Sniper 严格专注于经过验证的波段高低点( swing highs/lows )。 动态止损: 根据市场波动率(ATR)或固定缓冲区( buffer )自动计算建议的止损位,辅助您的风险管理。 二次进场系统: 跟踪价格每次触及活跃区域的次数(T1、T2、T3...)。在出现“二次进场”( re-entry )机会时,绘制清晰的

Smart Structure Zones ICT Smart Structure Zones ICT is a MetaTrader 5 chart indicator for structure-based price analysis. It displays market structure, BOS, CHoCH, order block zones, fair value gaps, equal highs and lows, premium/discount areas, and higher-timeframe highs and lows directly on the chart. The indicator is made for traders who use price action, structure analysis, liquidity zones, order blocks, fair value gaps, and multi-timeframe levels as part of their chart study. Main Features

Footprint Volume Profile Delta Indicator MT5 Suggested indicators used with Footprint Volume Profile Delta Indicator: Tma Bands scalping (Free) - https://www.mql5.com/en/market/product/184262?source=Site +Profile Smart Structure Zones ict (30$ per month) - https://www.mql5.com/en/market/product/184928?source=Site +Profile Short Description Footprint Volume Profile Delta Indicator MT5 is a clean order-flow style indicator for MetaTrader 5. It displays footprint volume, buy/sell pressure, candl

JFATL MTF Plus – 多周期趋势分析仪表盘 在数秒内掌握多个周期的趋势共振 告别在不同图表和周期之间的无休止切换。JFATL MTF Plus 将多达 8 个周期集成到一个智能仪表盘中,帮助您快速识别趋势方向、评估趋势质量,并以更高的信心捕捉潜在的交易机会。 JFATL MTF Plus 基于 Jurik 移动平均线 (JMA) 平滑算法与快速自适应趋势线 (FATL) 技术的结合,旨在提供灵敏的趋势分析,同时过滤掉大部分可能干扰决策的市场噪音。图表上的趋势线、清晰的信号以及直观的仪表盘相结合,共同监控多个周期之间的趋势共振。 解决的痛点 许多交易者经常面临以下困扰: 在多个图表和周期之间频繁切换 收到来自不同周期相互矛盾的信号 难以判断趋势是健康运行还是已经处于超买/超卖(过度延伸)状态 因指标反应过慢而错失良机 花了太多时间进行分析,而不是执行交易 JFATL MTF Plus 有助于解答以下重要问题: 高周期与低周期的趋势是否一致? 价格是靠近趋势线,还是已经过度延伸? 当前趋势的健康程度如何? 现在哪个周期最值得我关注? 核心功能 智能多周期分析 同时监控多达 8

VBC Indicator — Volatile Breakout Confirmation for Gold (XAU/USD) Version: 1.8 Stop guessing reversals. Let strong-candle exhaustion tell you where Gold is likely to turn. VBC Indicator is a price-action tool for MetaTrader 5 , built around Gold's sharp, fast, exhaustion-then-reversal price behavior. It automatically detects exhausted directional moves — runs of strong, same-color candles that have pushed far enough, fast enough — and marks the point where a reversal setup is forming. Alongside

Opening Channel Cycles Fimathe desenha, de forma automática, um canal de abertura no gráfico e projeta a partir dele uma grade de ciclos do mesmo tamanho, com o gatilho de entrada, as zonas de take e a referencia de stop. Tudo colorido, com legendas, e controlado por um painel direto no gráfico. COMO FUNCIONA (em palavras simples): - Você informa a data e a hora da vela que abre o canal. - O indicador mede o canal usando as primeiras velas (a máxima e a mínima delas) e mostra o tamanho e

مؤشر Smart SR Structure Pro MT5 هو مؤشر تداول شامل مصمم لمساعدة المتداولين على تحليل بنية السوق ومناطق الدعم والمقاومة والاختراقات وسلوك السعر مباشرة على الرسم البياني. يقوم المؤشر تلقائيًا باكتشاف قنوات الدعم والمقاومة الرئيسية، ويعرض تسميات هيكل السوق مثل HH وHL وLH وLL، ويسلط الضوء على مستويات BOS وCHoCH لمساعدة المتداولين على تحديد مناطق استمرار الاتجاه أو انعكاسه المحتملة. كما يتضمن مؤقتًا احترافيًا للشموع، ومتوسطات متحركة اختيارية، وألوانًا قابلة للتخصيص، وعرض خطوط قابل للتعديل، وتسميات و

Professional Support & Resistance Visualizer for MT5 Clear Market Structure, Smarter Trades Professional Support & Resistance Visualizer is a powerful MT5 indicator that automatically identifies and displays high-probability support and resistance levels directly on your chart. No more manual trendline drawing—let the algorithm do the heavy lifting while you focus on what matters: executing quality trades. Key Features Intelligent Level Detection Automatically identifies significant support and

FoxWave EdgeSnap Multi-Symbol — Scan Every Pair for Reversal Setups at Once FoxWave EdgeSnap Multi-Symbol by Fox Wave takes the same quality-filtered reversal detection from EdgeSnap and runs it across every symbol you trade at once — Market Watch or a custom list, one timeframe, one panel — so instead of flipping through 20+ charts looking for a setup, the setup finds you. Key features: Scans your entire Market Watch automatically, or a custom symbol list with broker-suffix support (up to 60 sy

Spend less time navigating. More time reviewing.
MTF Time Navigator removes the repeated work of finding the same point across multiple timeframe charts.
Mark it once. Move it once. Find it on every synchronized chart.
Stay focused on the chart review — not on moving each chart to the same point in time.
User Manual
For complete installation instructions, operation details, settings, and FAQs, see the MTF Time Navigator – User Manual .
Draw one vertical line. See the same moment on eve

VPro Risk Tool 是一款适用于 MetaTrader 5 的风险规划、仓位规模与交易手数计算工具。 设置风险、Entry(入场价)和 Stop Loss(止损价)后,工具会根据所选风险计算方式、账户数据、当前交易品种规格以及经纪商限制,计算风险金额和最终交易手数。 工具可用于规划 Market Entry(市价入场)和 Pending Order(挂单)交易方案。当 Trade Side 设置为 Auto 时,工具会根据 Entry 与 Stop Loss 的位置自动识别 BUY / SELL。可选的 Take Profit(止盈)线可以显示 R:R(风险回报比)。 VPro Risk Tool 不会开仓、发送订单、提供交易信号或预测交易结果。它是一款手动风险规划工具。每笔订单均由交易者自行决定并提交。 使用流程 1. 在 Risk Basis 中选择 Balance %、Equity % 或 Fixed Money,并设置 Risk Value。 2. 选择 Market Entry 或 Pending Order。移动 Stop Loss 线;在挂单模式下还需移动 E
Quant Multi Divergence Indicator A comprehensive multi-indicator divergence detection system that combines 7 indicators into a single consensus framework. The indicator identifies divergences across all selected components and calculates a Consensus Score ranging from -100 to +100, providing a clear and objective measure of signal strength. It also incorporates price swing analysis for enhanced accuracy. Main Features: Simultaneous divergence analysis across 9 components Consensus Score plotted

No one travels the seas without the Anchor of the ship! Anchor is the first thing needed in trading and is almost impossible to be calculated. Usually this anchor is draw on the main chart following the main graph, and it is drawn into the future... It represents the idea of the graph not yet came to life (it's future) which is calculated by approximation of the previous values...
Here we can see previous values of the graph as the future ones. Whole function is done mathematically independent

CleanBreak RSI Sniper is a precision reversal indicator built around a single idea that most divergence tools ignore: a divergence is only as strong as the candle that formed it. Ordinary RSI divergence indicators mark a signal the moment price and momentum disagree, regardless of how messy or indecisive the candles around that disagreement actually are. CleanBreak RSI Sniper adds a structural purity filter on top of classic divergence detection, so that every signal it produces has already surv

ZigZag AutoChannel 将经典的彩色 ZigZag 指标与全自动等距通道绘制功能相结合,无需任何手动操作。 该指标根据三个可调参数(Depth 深度、Deviation 偏差、Backstep 回溯步长)识别市场中已确认的高点和低点,并根据每段走势的方向进行着色:上涨段为蓝色,下跌段为红色。 每当一个新的转折点被确认后,指标会自动绘制等距通道——其构建方式与在 MetaTrader 中手动绘制完全相同:基准线穿过最近两个同类型的已确认转折点(连续两个低点或连续两个高点),中间的转折点则决定通道的宽度。通道只有在出现新的转折点时才会重新绘制,避免每个 tick 都闪烁刷新。 即使在历史数据存在缺口的品种上(如指数、周末、节假日),该指标也能正常工作,因为所有计算均基于K线索引,而非时间间隔。 主要功能: 根据走势方向着色的 ZigZag 自动绘制并更新的等距通道 可调整显示的最近通道数量 可自定义通道颜色、样式和线宽 可选择将通道线向右延伸 同时显示其他时间周期的通道(M1、M5、M15、M30、H1、H4、D1、W1、MN1),每个周期使用独立颜色 当价格触及或突破通道边

Smart Watchlist Signal Panel Smart Watchlist Signal Panel is a professional MetaTrader 5 indicator designed to help traders monitor multiple symbols from one clean and organized dashboard. The indicator displays Buy , Sell , or Neutral technical conditions using a structured rule-based approach. It helps traders review market direction, momentum, risk-reward levels, and historical signal movement without opening many charts one by one. This product is built for traders who want a faster, cleaner

I trade gold on M5 and M15. I built this tool because I was tired of two things: drawing the same levels every single morning, and indicators that cover the chart with fifty lines and then take credit for whatever price does.
Auto Structure Assistant draws the structure map the way a careful trader would. Pivot-based support and resistance. Horizontal walls where price has actually been rejected, not just where a formula says so. And the moment a level breaks, the next level ahead is already w

BALOGUN SMC ELITE — Professional Smart Money Concepts Indicator
KEY FEATURES: Strict BUY/SELL Alternation — Only 1 BUY followed by 1 SELL (no signal spam) Non-Repainting Signals — Signals confirmed on closed bars only Zone-Limited NO TRADE Markers — Clear visual zones showing when NOT to trade Multi-Factor Confluence Scoring — 0-100% quality score per setup Professional Dashboard — Real-time trend, confluence, and signal status Multi-Channel Alerts — Popup, Push, Email, and S

Delta Volume Profile Zones Pro is a $100 MetaCoderStore MT5 indicator for traders who want anchored volume-profile structure, clean DVP modes, projected min/max levels, consolidation detection, high-volatility detection, and EA-readable buffers. The indicator can build a live rolling profile or a profile anchored to a past candle. When the anchor is moved into history, all profile rows, extrema levels, and detected boxes are calculated only from the candles that existed at that anchor point. The

Adaptive Trend Support & Resistance Pro Turn Trends into Trading Opportunities Adaptive Trend Support & Resistance Pro is an advanced trend-following indicator that dynamically transforms into support and resistance zones based on market direction. When the market enters an uptrend, the indicator automatically switches to green and creates dynamic support levels. Price often retraces toward these levels before continuing higher, helping traders identify high-probability trend continuation opport

Scalp Quant SuperTrend Engine The Elite Algorithmic Indicator Designed to Decode Market Behavior After extensive research and development, this indicator successfully decodes complex price action structures using advanced algorithmic logic Scalp Quant SuperTrend Engine is a premium non-repainting analytical indicator powered by advanced algorithmic equations Take your scalping and swing trading to the next level with one of the smartest and fastest SuperTrend-based indicators available. Scalp Qu

Crypto Liquidation Zones is a technical visualization tool designed for MetaTrader 5 that attempts to estimate and display theoretical liquidation areas on the chart. Based on historical price extremes and user-defined leverage levels, the indicator models where leveraged market participants could potentially face stop-outs or liquidation thresholds, representing these zones via a dynamic on-chart heatmap overlay.
WHAT IT DOES
- Theoretical Zone Estimation: Derives estimated liquidation pri

MGH-MagicLine — 趋势与多时间框架背离一体化工具 MagicLine 将趋势识别与背离分析整合到单一指标中——是同时运行 MultiStoch 和 MultiMACD 的精炼替代方案,输出更清晰、延迟更低。 它是一款 确认与分析工具 ,不提供入场点、止盈或止损,而是为几乎任何趋势型策略增添一层强大而灵活的确认,帮助你更清晰地解读市场。 三种线型模式——同一指标 在设置中选择 Line Type ;当前模式会直接显示在指标窗口名称上,让你随时清楚正在查看的内容: Slow — 噪音最低,用于读取长期趋势方向。线条进入 ±0.2 区域时确认主导趋势。 Long — 趋势识别清晰且更具响应性,是日常使用的均衡之选。 Fast — 反应最快,适合剥头皮和日内动量交易。 一个指标,三种不同表现——根据你的时间框架和风格自由调整。 多时间框架线条——现已支持完整时间框架控制(MT5) 由于 MetaTrader 5 比 MT4 支持更广泛的时间框架范围,本版本新增了 逐线时间框架选择功能 ——让你完全掌控每条线所代表的时间框架。 设置 TimeFrame Type 来选择时间框架的

AutoFibAlert — Automatic Fibonacci Levels Alerts with Multi-Channel Alerts AutoFibAlert is an MT5 indicator that removes the manual work of drawing Fibonacci retracements. It automatically detects the most recent significant swing high and swing low on your chart, plots a full retracement grid from that swing, and notifies you the moment price reaches any level — on your desktop, with sound, and on your phone. Key Features Automatic Swing Detection Continuously scans a configurable lookback win

KS Multisymbol Daily Week Month Live Dashboard Pro 是一款专为 MetaTrader 5 设计的实时多品种仪表盘指标。
核心功能:
无需切换图表,即可一目了然地掌握多达 20 个交易品种(品种由您在参数中设定)在日线、周线和月线周期上的趋势倾向(Bias)及价格区间状态。
显示内容:
各品种实时价格
日线倾向:较今日开盘价的变动百分比 + 箭头标识(看涨/看跌)
周线倾向:较本周开盘价的变动百分比 + 箭头标识
月线倾向:较本月开盘价的变动百分比 + 箭头标识
区间状态(针对各周期):
HIGH(高位)→ 价格突破上一周期的最高点(看涨突破)
LOW(低位)→ 价格跌破上一周期的最低点(看跌突破)
NO BIAS(无明确倾向)→ 价格仍处于上一周期的区间范围内
整体倾向:基于多数原则(三个周期中有两个一致)→ 看涨 (BULL) 或 看跌 (BEAR)
主要特点:
全实时仪表盘 —— 实时更新(基于每个报价跳动/Tick 及计时器)。
可点击与排序 —— 点击列标题可按品种、倾向或区间状态排序;点击任意品种

Trader Cat's FVG Mitigation Pro — Fair Value Gap Indicator with Automatic Mitigation Tracking and Fixed Timeframe Locking Capability Fair Value Gaps (FVGs) are one of the most-used concepts in Smart Money and ICT-style trading. Most FVG indicators just draw every gap they find and leave your chart buried under stale rectangles. This one tracks the full life cycle of every gap — and cleans up after itself. On top of that it has the capability to lock a specific time frame's FVGs and view it on an

The KCI-Directional EA is a sophisticated automated trading solution designed for the MetaTrader 5 platform, specifically engineered to navigate the complexities of the foreign exchange market. By integrating the advanced KCI-Directional_X indicator, this Expert Advisor provides a systematic and disciplined approach to trend-following, ensuring that traders can capitalize on sustained market momentum while avoiding the pitfalls of sideways price action.
At the heart of this EA is a dual-layere
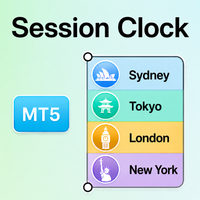
Session Clock MT5 Know Which Forex Session Is Active – Without Manual Time Calculations Session Clock MT5 is a clean trading-time dashboard for MetaTrader 5. It displays the four major Forex market sessions–Sydney, Tokyo, London, and New York – together with their opening times, closing times, live status, and the countdown to the next session. Forex market activity changes throughout the day. Some periods are quiet, while others bring faster price movement and higher volatility. Session Clock M

Most SMC tools throw everything at you, every order block, every gap, every swing point and leave you to figure out which ones actually matter right now. That's not an edge. That's more noise dressed up as analysis.
Smart Alpha SMC does something different. It doesn't just show you structure — it tells you what to DO with it, and just as importantly, when to do NOTHING.
IT KNOWS WHEN YOU'RE ALLOWED TO TRADE — AND WHEN YOU'RE NOT
Here's the trap every trader falls into: taking a "perfect look

INTENSYWNY SCALPER PRO — 单个指标中的完整超短线系统 1. Adaptive ATR-Based Targets — Works on Any Market & Timeframe 1. 基于 ATR 的自适应目标 — 适用于任何市场和时间周期 Take-profit spacing and stop-loss distance are calculated from real market volatility (ATR). Switch between M1, M15 or M30+, or jump from Gold to Bitcoin to indices — the indicator instantly recalculates all levels. No manual configuration, ever. 止盈间距和止损距离根据实际市场波动率 (ATR) 计算。无论是从 M1、M15 还是 M30+ 之间切换,或者从黄金、比特币跳转到股指 — 指标都会立即重新计算所有级别。无需任何手动配置。 2. Six-Level Profit Str

Deconstruct bars to extrapolate volume for each price zone. Plot heatmaps based on ZigZag swings. Each heatmap is weighted based on the hottest and the coldest map. For each heatmap, compact hot zones to build trading ranges. Project support, resistance and the POC for each identified range. Projected range levels will lose heat when the price hits, eventually fading out.

MarketPulse Pro Dashboard | Multi-Indicator Analysis Suite Unlock Total Market Clarity with MarketPulse Pro Dashboard. Are you tired of cluttered charts and fragmented analysis? MarketPulse Pro Dashboard is a comprehensive All-in-one Indicator suite designed to consolidate 23 of the most powerful technical tools into one sleek, interactive, and user-friendly MT5 Professional Tool . Whether you are a scalper, day trader, or long-term swing trader, this Trading Dashboard provides you with a real-t

为什么选择 Aegis Quantum Smart Indicator? 与市面上许多指标不同, Aegis Quantum Smart Indicator 是一款完全独立运行的专业交易指标。 无需每月订阅 一次购买即可使用,无需支付任何月费或订阅费用。 无需加入 Telegram 群组 无需加入任何 Telegram 群组或私人社区,即可使用所有功能。 无需主账户或信号跟单 本指标直接分析实时市场数据,独立生成交易信号,不依赖任何主账户,也无需复制他人的交易信号。 完全独立运行 安装到 MetaTrader 5 后即可立即使用,无需额外设置或连接任何第三方服务。 顺应市场走势 Aegis Quantum 根据当前市场走势进行分析,结合价格行为和多种技术因素,智能识别 BUY(买入) 、 SELL(卖出) 或 WAIT(观望) 信号,帮助交易者做出更有依据的交易决策,而不是依赖人工发送或固定规则的信号。 即时交易决策 智能 BUY 买入信号 智能 SELL 卖出信号 市场不明确时自动显示 WAIT 观望模式 自动计算入场价(Entry)、止损(Stop Loss)和止盈(Take Pr

TrendingPro – Professional Multi-Timeframe Trend Analysis Indicator TrendingPro is a professional trend analysis indicator for MetaTrader 5 designed to help traders monitor market direction across multiple timeframes from a single dashboard. It combines an ATR-based trend algorithm, multi-timeframe analysis, trend statistics, customizable filters, and intelligent alert notifications into one easy-to-use trading toolkit. Whether you trade trend-following strategies, pullbacks, or intraday setups,
MetaTrader市场是独有的自动交易和技术指标商店。
阅读MQL5.community用户备忘更多地了解我们提供给交易者的独特的服务:复制交易信号,自由职业者开发的自定义应用程序,通过支付系统完成的自动付款和MQL5云网络。
