 MetaTrader 5
 专家
专家
 指标
指标
 程序库
程序库
 实用工具
实用工具
 窗口小部件
窗口小部件
 规则
规则
适用于MetaTrader 5的技术指标 - 181
 技术指标的信号外汇和股票市场的开仓交易和平仓交易起着至关重要的作用。指标的本质就是一种交易品种的数学转换,旨在预测未来的价格变化。
测试技术指标可以更有利于预测市场行为并从中获利。
技术指标的信号外汇和股票市场的开仓交易和平仓交易起着至关重要的作用。指标的本质就是一种交易品种的数学转换,旨在预测未来的价格变化。
测试技术指标可以更有利于预测市场行为并从中获利。 
MACD intel Professional MACD Oscillator with Adaptive Noise Filtering and Divergence Detection The Problem MACD intel Solves Trader Question How MACD intel Answers "Is this crossover real or just market noise?" Adaptive Dead Zone filters out false signals. Grey histogram = noise zone. Only decisive moves generate arrows. "Should I follow the trend or fade the move?" 3-Mode Zero-Line Filter lets you switch between TREND (follow momentum) and REVERSION (fade extremes) with one click. "Why di

Phantom Quant Momentum
AI-Inspired 6-Agent Scoring Indicator with Buy/Sell Arrows for MetaTrader 5
Tired of simple moving-average crossovers that give too many false signals? Phantom Quant Momentum- is a next-generation indicator built on quantitative logic originally designed for institutional AI trading systems.
Instead of relying on a single indicator, this system runs 6 independent scoring agents- simultaneously — each analyzing a different dimension of the market. Only when the majority

Wyckoff Phase Matrix Pro MT5 Wyckoff Phase Analysis, Trade Levels and Performance Statistics in One Dashboard Wyckoff Phase Matrix Pro MT5 is a structured market-analysis indicator that brings Wyckoff phase reading, setup bias, Entry/TP/SL levels, win-rate data, statistics and an equity curve into one clean MetaTrader 5 dashboard. It is designed to help traders understand current market structure more clearly, reduce chart-reading confusion and plan trades with defined levels instead of relying

每周和每日 OHLC 水平线 — 再也不会错过关键价格区域
无需再猜测市场走势。此指标会自动在您的图表上绘制机构交易员、银行和精明投资者每天关注的最重要价格水平线,无需任何手动操作。
您将获得
每次打开图表,您都会立即看到:
4 个每周水平线 — 上周的开盘价、收盘价、最高价和最低价
4 个每日水平线 — 前一天的开盘价、收盘价、最高价和最低价
清晰的颜色编码 — 每周水平线为蓝色,每日水平线为白色,让您始终清楚自己正在查看的内容
清晰的价格标签 — 每个水平线都标有准确的价格,直接显示在图表上
这些水平线为何重要
上周和前一天的 OHLC 水平线是专业交易中最受关注的价格区域之一。银行和机构会在这些水平线附近下单。价格经常:
在前一周/前一天的高点和低点附近反转
在前一交易日的开盘价和收盘价附近盘整
突破并重新测试这些区域后继续上涨
无论您交易外汇、黄金、指数还是加密货币,这些价位都适用于所有市场。
专为专业交易者打造
适用于任何时间周期——H1、H4、M15 及以下
始终精准——仅从完全闭合的K线中提取,绝不重绘
每根新K线自动更新—

Buy Sell Trend Indicator Clean Signals. Smarter Trend Detection. Buy Sell Trend Indicator is a trend-following tool designed to help traders identify market direction, potential reversals, and high-probability Buy & Sell opportunities using clear visual signals and structured trend logic. Built with ATR-based trend analysis and optional ADX confirmation, the indicator focuses on filtering weak signals and improving accuracy in dynamic market conditions. It automatically plots trend lines, Buy/S

MT5 體積增量掃描儀
成交量變化掃描器是適用於 MetaTrader 5 的即時市場掃描指標,它能夠在一個面板中同時監控多個交易品種和時間週期。無需手動切換圖表,即可一目了然地查看整個自選清單中的買賣壓力概覽。
該指標基於成交量差值邏輯構建——它根據蠟燭圖結構和成交量計算買賣壓力之間的差異,從而為您提供您選擇監控的每個交易品種和時間框架的直接、未經過濾的市場主導地位視圖。
面板上顯示的內容
面板上會顯示一個簡潔的表格,表格中按行列出了您的股票代號。每行包含股票代碼名稱,後面跟著兩列訊號值和五列時間週期。
每個儲存格顯示以下三種狀態之一: 綠色三角形-買盤壓力占主導地位 紅色三角形 — 拋售壓力主導 — 中性 — 沒有明顯的支配地位,市場平衡。
M 欄位-市場偏見過濾器
M欄位採用的是我獨有的價格結構演算法,該演算法是我多年黃金及主要金融工具實盤交易經驗的結晶。該欄目的具體邏輯屬於我的專業商業機密,但它的作用清晰明確,且可量化。
M 指標即時解讀當前市場傾向-並非基於滯後指標或標準移動平均線,而是基於持續預示方向性走勢的特定價格行為模式。這一列指標會告訴你,

This indicator automatically identifies strong market zones and displays only high-probability BUY and SELL signals. The indicator filters weak signals, analyzes swing points and zone strength to provide the highest-quality entry opportunities. Suitable for the following instruments:
• XAUUSD
• EURUSD
• GBPUSD
• USDJPY
• BTCUSD
• NAS100
• US30 Indicator Advantages:
• Not an ordinary indicator — built with Smart Money logic
• Filters weak market noise
• Very few fake signals
• High potential fo

Dragon Trend System v3 — 10-Factor Trend Scoring with Built-In Entry Signals Stop relying on a single indicator to judge the trend. The Dragon Trend System scores 10 independent market dimensions and only generates entry signals when the combined score crosses your chosen threshold. Every signal includes DiNapoli Fibonacci TP targets and automatic SL placement. Version 3 is a complete rebuild — one self-contained indicator replaces the old two-indicator setup. No more running separate Trend and

This indicator is engineered to solve one of the most frustrating challenges in institutional trading: the "premature entry" trap. Often, a standard supply or demand zone appears valid on a higher timeframe, but in reality, it acts as early liquidity —a magnet for price to sweep through before finding a true reversal point. The Problem: Early Liquidity In traditional Smart Money Concepts (SMC), a "Regular Zone" is often too broad. Because the zone covers a wide price range, your stop loss must b

产品名称: ZoneTrader v1.0 — XAUUSD 大阴阳线与区间区域检测指标
[ 概述 — 一级标题 ]
ZoneTrader v1.0 专为在 M15 和 M30 时间框架上交易 XAUUSD(黄金)的交易者而构建。 它自动在图表上识别两类高概率区域——大阴阳线区域和区间高低点区域——并在价格回测并在 已收盘K线内确认时,精准触发买入或卖出箭头信号。
这不是趋势指标,也不是振荡器。它是一个纯价格行为区域工具,基于一个简单理念:当黄金 快速大幅单向运动时,该K线的实体就会成为磁铁——价格几乎总会回来测试这一区域。 ZoneTrader 标记该区域,并在回测发生时向您发出信号。
无重绘。信号始终基于已收盘K线。
[ 逻辑原理 — 一级标题 ]
[ 逻辑1 — 大阴阳线区域 — 二级标题 ]
当 XAUUSD 的K线实体超

Mtf Market Structure Color Candles Alert is a MetaTrader 5 indicator for traders who use multi-timeframe market structure in their chart reading. The indicator draws selected-timeframe structure references on the execution chart and colors the current-chart candles only when price confirms a structure condition. It is designed to help traders separate trend continuation, possible trend change, and neutral range conditions. Version 1.31 includes: Confirmation mode: execution-chart close or fully

GDS Renko Structure Free Renko Structure Indicator for MetaTrader 5 GDS Renko Structure is a free MetaTrader 5 indicator for traders who use Renko charts and want a clearer way to read market structure, movement phases and brick-based behavior. The indicator helps visualize how Renko structure is forming on the chart: movement legs, pauses, continuation areas, pullback behavior and structural shifts. It does not give buy or sell signals. It does not predict price movement. It is a visual context

Smart MW Pattern Dual ATR System Elevate your trading with a professional-grade Price Action system designed to identify high-probability M-shaped (Double Top) and W-shaped (Double Bottom) patterns. Unlike basic indicators, the Smart MW Pattern Dual ATR System provides a complete trading framework, integrating entry signals with a sophisticated two-stage risk management system. Core Logic: This indicator detects market turning points by identifying classic M and W price structures. T

适用于MT5平台的加密货币外汇指标“黄昏之星形态”,无重绘,无延迟。 ...............................................................................
- “黄昏之星形态”指标是价格行为交易的强大工具,尤其适用于下跌趋势市场。 - 该指标可检测图表上的看跌黄昏之星形态:图表上的红色箭头信号(见图)。 - 支持PC和移动设备提醒。 - 另有其兄弟指标——看涨的“晨星形态”指标(请点击下方链接)。 - “黄昏之星形态”指标非常适合与支撑/阻力位结合使用。 ................................................ 点击这里查看高质量的交易机器人和指标! 这是仅在 MQL5 网站上提供的原创产品。

Wait for clean candle-close break confirmations without staring at the chart. Bar Break Alerter monitors selected long-side or short-side break confirmations directly from the chart. Activate the alert at a planned setup area, step away from the screen, and get notified when the chosen break signal appears. No constant chart watching. No early FOMO entries before confirmation. Only clean break alerts when the selected condition is actually triggered.
Built for Traders Who Want To: Wait for can

GDS Renko Conscience - Renko Decision Awareness Indicator for MetaTrader 5 GDS Renko Conscience is a free Renko decision-awareness indicator for MetaTrader 5. It helps traders slow down and review the current Renko context before making manual trading decisions. This tool is not a signal indicator and does not tell you when to buy or sell. Its purpose is to support discipline, context review and risk awareness during Renko chart analysis. Golden Delta | Algo Trading Research
Updates, research a

GDS Renko Ghost Free Renko Market Memory Visualization Indicator for MetaTrader 5 GDS Renko Ghost is a free MetaTrader 5 indicator for traders who use Renko charts and want to study how similar Renko structures behaved in the past. The indicator visualizes historical Renko memory: similar past structures, continuation paths, consensus behavior and uncertainty zones. It does not give buy or sell signals. It does not predict price movement. It is a visual research and context tool for manual Renko
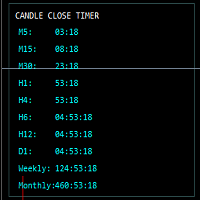
# MT5 多时间框架蜡烛图收盘计时器
使用**多时间框架蜡烛图收盘计时器**,掌握市场先机。这款简洁强大的 MetaTrader 5 指标专为依赖蜡烛图时机和精准入场的交易者而设计。
该指标可同时显示多个时间框架的实时倒计时,帮助您精准追踪每根蜡烛图的收盘时间,无需切换图表。
## 功能
* 实时蜡烛图收盘倒计时
* 支持多种时间周期:
* M5
* M15
* M30
* H1
* H4
* H6
* H12
* 日线
* 周线
* 月线
* 简洁轻便的图表显示
* 颜色编码的警告系统:
* 正常倒计时
* 警告模式
* 关键最后几秒 * 蜡烛图收盘前推送通知和弹出提醒
* 完全可自定义:
* 颜色
* 字体
* 面板位置
* 提醒时间
* 优化低 CPU 占用率
* 适用于任何交易品种和经纪商
## 完美适用于
* 超短线交易者
* 日内交易者
* 智能资金概念交易者
* 信息通信技术交易者
* 突破交易者
* 多时间周期分析师
* 新闻交易者
## 为什么使用它?
蜡烛图收盘时刻对于基于确认的交易策略至

MACD Multi-Dimensional (MACD intel MTF) Professional MACD Oscillator with Adaptive Noise Filtering, Divergence Detection & Multi-Timeframe Confirmation The Problem MACD intel MTF Solves Trader Question How MACD intel MTF Answers "Is this crossover real or just market noise?" Adaptive Dead Zone filters out false signals. Grey histogram = noise zone. Only decisive moves generate arrows. "Should I follow the trend or fade the move?" 3-Mode Zero-Line Filter lets you switch between TREND (follow mom

# MT5 挤压动量指标
使用功能强大的**挤压动量指标**,释放爆发式市场机遇。该指标专为 MetaTrader 5 平台专业开发。
这款先进的波动率和动量指标可帮助交易者在重大市场行情发生前识别低波动时期。该指标结合了布林带和肯特纳通道的优势,揭示市场何时处于“挤压”状态,并准备突破。
内置的动量柱状图使趋势方向和动量变化一目了然,帮助交易者自信而精准地入场交易。
## 功能特性
* 高级挤压检测系统
* 专业 MT5 平台实现
* 突破爆发前检测波动挤压
* 动态颜色变化的动量直方图
* 挤压状态点,方便解读市场状况
* 整合:
* 布林带
* 肯特纳通道
* 线性回归动量
* 早期趋势转变检测
* 简洁流畅的独立窗口显示
* 完全自定义设置
* 轻量级优化,运行流畅
## 动量直方图颜色
* 亮绿色 → 上涨动量增强
* 深绿色 → 上涨动量减弱
* 亮红色 → 下跌动量增强
* 深红色 → 下跌动量减弱
## 挤压点颜色
* 白色 → 挤压开启(低波动/突破设置)
* 金色 → 挤压释放(潜在突破行情)
* 红色 → 无挤

SEASONALITY ASSISTANT Understand Market Tendencies More Clearly Seasonality Assistant is a simple trading tool that helps identify the seasonal tendency of the market for each month based on historical price behavior. The indicator classifies market conditions into two categories: TREND → Price tends to move with directional momentum during the month.
This does not mean the market will always move up or always move down.
It simply means the market historically tends to develop a clearer directio

**Full Description (paste-ready)** Forex Warrior Trend Signal Guide is a signal indicator for forex traders who want structured trade guidance without automated execution.
The indicator analyzes each configured pair and displays a live dashboard with: - BUY, SELL, or NEUTRAL signal blocks - Breakout confirmation - Pattern detection and confidence - ADX, RSI, and ATR context - Multi-pair table for fast comparison
Core logic combines: - EMA trend structure - MACD directional confirmation - Brea

波动率指标 MT5 — 高级实时市场波动率仪表盘
将原始 ATR 数据转化为适用于 MetaTrader 5 的强大可视化波动率智能系统。
波动率指标 MT5 是一款专业级波动率分析指标,专为希望在入场交易前快速识别平静、活跃、高风险和爆发性市场状况的交易者而设计。
该工具采用先进的 ATR 比较逻辑、历史波动率分析和智能警报系统,使交易者能够直接在图表上实时查看市场强度。
主要功能
实时波动率仪表盘
简洁现代的图表面板显示:
当前 ATR 波动率
长期基准 ATR
波动率比率比较
历史最高 ATR
实时市场状况
所有数据均实时自动更新。
智能波动率检测
该指标将短期ATR与长期ATR均值进行比较,以检测:
低波动率
正常市场状况
活跃市场
高波动率
极端市场波动
完美适用于:
短线交易者
日内交易者
波段交易者
新闻交易者
波动率突破策略
历史市场分析
与基础ATR指标不同,波动率计会扫描历史市场数据,以确定:
历史ATR最高值
平均波动率水平
相对市场强度
罕见波动率峰值
这有助于交易者了解当前市场走势是正常还是历史

适用于 MT5 的 4 倍标准差通道
使用适用于 MetaTrader 5 的 4 倍标准差通道指标,将您的图表转化为专业的机构交易空间。
这款高级指标将动态回归通道、多级波动区域、可自定义移动平均线以及强大的高时间框架支撑/阻力位整合到一个简洁且高度可定制的工具中。
对于希望精准识别趋势方向、波动扩张、溢价/折价区域以及高概率反转区域的交易者而言,这款指标堪称完美之选。
主要功能
高级标准差通道
自动绘制智能线性回归趋势通道
价格上下最多 4 个偏差级别
检测波动扩张和过度扩张的市场状况
可选通道左右延伸,用于未来预测
实时趋势斜率分析
多级波动区域
+1 / -1 偏差
+2 / -2 偏差
+3 / -3 偏差
+4 / -4 偏差
快速识别:
趋势延续区域
均值回归机会
耗尽区域
机构价格极值
内置移动平均线套件
支持多种移动平均线类型:
SMA
EMA WMA
SMMA / RMA HMA DEMA TEMA
包含多达 6 条完全可自定义的移动平均线,可调节以下参数:
长度 类型 颜色 可见性
适用于:
趋势过滤

Institutional Liquidity & Footprint Indicator
This indicator is designed for traders who want to identify high-probability setups with institutional-level precision—without the complexity. What It Does:
This MT5 indicator combines liquidity zone detection with volume footprint analysis to reveal where institutional players are actively positioning. It automatically identifies key supply and demand areas, filters market noise, and highlights only the setups that matter. Key Features:
High-Pr

Thrust Map Real-Time Indicator Unlike standard Volume Profiles that aggregate tick counts by price level, this indicator tracks the number of candles that fall within each level's range. The profile accumulates data only from the moment of launch and categorizes it into Buy and Sell by analyzing the direction of every tick. It does not repaint. The indicator displays vertical and horizontal levels where the price travels the "greatest distance with the fewest actions" (on average per candle). In

适用于 MT5 的 Crypto_Forex 指标“RVI 速度”,无需重绘。 - 该指标基于物理方程计算。RVI 速度是 RVI 本身的一阶导数。 - Relative_Vigor_Index (RVI) 本身是一个技术动量指标,在趋势市场中非常有用。 - RVI 速度非常适合在价格调整后顺着主趋势方向进行动量入场。 - 可与合适的趋势指标结合使用,例如标准 EMA(如图所示)。 - RVI 速度指标显示 RVI 本身改变方向的速度——它非常敏感。 - 如果 RVI 速度指标的值小于 0:速度为负;如果 RVI 速度指标的值大于 0:速度为正。 - 指标内置移动端和 PC 端警报。 ................................................ 点击这里查看高质量的交易机器人和指标! 这是仅在 MQL5 网站上提供的原创产品。

Smart Flow Trade uses an advanced intelligent ABCD pattern to identify high-probability trade setups. The indicator provides clear entry signals with candlestick color-change confirmation to help traders enter the market with confidence. It also displays: Entry point Take Profit (TP) levels Stop Loss (SL) making risk management simple and effective. This indicator is designed for intraday traders, swing traders, and beginners , as it clearly shows the overall market direction and possible trade

AlgoEdge — Stop Chasing Every Move Most traders don’t lose because they lack indicators.
They lose because their charts constantly pull them into bad decisions. Fake breakouts.
Late entries.
Overtrading.
Conflicting signals.
Momentum traps. After a few losses, hesitation starts creeping in — and suddenly the real move happens without you. AlgoEdge was built to reduce that noise. Instead of flooding your chart with endless confirmations, AlgoEdge focuses on identifying shifts in market pressure a

Prop Session Risk Guard MT5 是一款专为手动交易者设计的基于时段的信号指标,适用于 MetaTrader 5 平台。该工具旨在活跃市场时段提供更清晰的入场和出场指导,并集成风险意识功能。这款专业工具结合确认的买卖箭头、止盈/止损预测、时段过滤器、点差监控以及清晰的图表内仪表板,支持纪律化的交易决策。 核心功能 该指标作为手动交易辅助工具,帮助交易者解读市场状况、过滤低质量设置,并以增强的结构规划交易。它不是自动交易机器人,而是可视化确认工具,仅在适当的时段和风险背景下显示信号,从而实现更具选择性和信息充分的交易决策。 主要功能 买卖信号箭头,用于手动交易确认 基于时段的市場过滤,优化入场时机(亚洲、伦敦、纽约时段) 图表上直接显示止盈和止损的可视化预测 风险感知仪表板,快速视觉评估交易条件 实时点差监控,避免不利执行环境 收盘蜡烛信号确认,减少不稳定或过早信号 兼容外汇货币对、黄金(XAUUSD)、指数及合成工具 专为自营交易员、资金账户用户及纪律严明的零售交易者设计 简洁的图表显示,配备直观易用的设置 完全兼容 MetaTrader 5 平台 目标用户 寻

Volume Profile by Trading Session — Visualize where price spent its time and where the smart money traded, automatically segmented by Sydney, Tokyo, London, or New York sessions. What is Market Volume Profile? Market Volume Profile (MVP) is a professional-grade Volume Profile indicator built for traders who think in sessions, not just candles . While most volume tools show you a single profile across an arbitrary range, MVP automatically segments your chart by the four major Forex session

Obsidain Queen - AI Trend Signal Indicator
Obsidain Queen is a premium AI-inspired trading indicator designed to support trend analysis, signal confirmation, and disciplined market entry decisions.
The indicator focuses on identifying market direction, potential entry zones, and trend strength. It is created to help traders make more structured decisions instead of relying on emotion or random entries.
Obsidain Queen can be used for Forex, Gold, indices, and other major CFD markets, dependin

Crypto_Forex 指标 HTF MFI 震荡指标,适用于 MT5。 - 资金流量指数 (MFI) 是一种技术震荡指标,它利用价格和成交量数据来识别超卖和超买区域。 - HTF 代表 - 更高的时间框架。当 MFI 高于 80 时,表示超买;当 MFI 低于 20 时,表示超卖。 - MFI 非常适合与价格行为信号结合使用。它提供有关看涨和看跌价格动量的信息。 - 该指标非常适合与其他指标结合使用,用于多时间框架交易系统。 - HTF MFI 指标允许您将更高时间框架的 MFI 附加到您当前的图表中。 - 指标内置移动端和 PC 端警报。 ................................................ 点击这里查看高质量的交易机器人和指标! 这是仅在 MQL5 网站上提供的原创产品。

"QuickLineAlert" – Smart and Fast Price Level Indicator (MT5) "QuickLineAlert" is a tool designed for the MetaTrader 5 platform, created to maximize the speed and simplify the marking of price levels. It is perfectly suited for active traders (especially scalpers and day traders) who need to react instantly to market changes without long and tedious setups. You just press a button, place a line, and let the indicator do its job. Main Advantages: Fully Automated (No Need to Choose Direction) U

GDS Renko Pulse - Renko Market Activity Indicator for MetaTrader 5 GDS Renko Pulse is a free Renko market activity indicator for MetaTrader 5. It helps traders observe the current rhythm, pressure, activity and cleanliness of Renko movement directly on the chart. This indicator does not predict the market and does not generate buy or sell signals. Its purpose is to help you understand whether the current Renko environment is active, slow, clean, unstable, compressed or losing rhythm. Renko EDGE

Stop relying on a single oscillator to trade reversals! Divergence Pro is a professional-grade analytical tool designed to find high-probability reversal points through... confluence of 11 powerful oscillators . Instead of entering false signals from an isolated RSI or MACD, Divergence Pro tracks the market and only displays opportunities when multiple indicators agree on the same divergence simultaneously. It filters out market noise and delivers only the best opportunities.

VGRSI — Visibility Graphs Relative Strength Index is a technical indicator for MetaTrader 5 based on the concept of visibility graphs applied to financial time series. Unlike classical oscillators that mainly use local price changes, VGRSI analyses the geometric structure of price movement. It detects selected past points that remain “visible” from the current price in the time–price plane and uses them to estimate the relative strength of upward and downward movements. The indicator is scaled t

StrataFlow Pro 是一款 Smart Money 仪表盘指标,适合在手动图表分析中使用市场结构、FVG、Order Blocks、HULL 趋势背景、交易时段和提醒功能的交易者。 它将多种图表分析工具整合到一个模块化指标中,帮助交易者在更清晰的图表上读取结构、价格区域、趋势背景和时间节奏。 该指标专为手动分析设计。它不会开仓、平仓,也不保证交易结果。 主要功能 带有 BOS 和 CHoCH 的 Smart Money 结构 HH、HL、LH 和 LL 等摆动结构标签 Fair Value Gap 显示 看涨和看跌 Order Block 区域 用于趋势背景判断的 HULL 趋势过滤器 交易时段背景区域 用于图表背景分析的参考水平 支持选定条件的提醒 图表上的模块化控制面板 Clean、Balanced 和 Full 显示模式 适合谁使用?
StrataFlow Pro 适合使用 Smart Money Concepts、ICT 风格价格行为、市场结构和区域分析的交易者。 它适合希望使用一个有组织的仪表盘,而不是在同一张图表上加载多个独立指标的交易者。 如何使用
将指

Multi_TF_SuperTrend_Map 详细描述
本产品是之前开发的 Supertrend Pure MT5 - 高精度趋势跟踪器的升级版。
之前的产品仅显示当前时间框架内的超级趋势线。而新升级的产品不仅显示当前时间框架内的超级趋势线,还显示更高时间框架内的超级趋势线和时间点。通过在同一页面上显示详细的方向和限制信息——例如K线和趋势的走向,以及当前支撑位或阻力位的强弱——它有助于实现更直观、更可靠的交易。
您的评价和评分是我们持续开发此程序的动力。谢谢!
Multi_TF_SuperTrend_Map
1. 指标的核心概念
该指标基于平均真实波幅 (ATR) 计算当前价格波动率。通过 ATR,它可以识别趋势方向(上涨/下跌)以及趋势反转的关键点(水平虚线)。尤其值得一提的是,通过在当前图表上显示更高时间框架的阈值,它能够帮助交易者“纵观全局,而非只见树木不见森林”。
2. 主要组件和功能
当前时间框架超趋势线及信号:这些是实时绘制在图表上的主要线条,以及趋势反转时生成的箭头信号。
多时间框架动态水平线:以水平虚线的形式显示更高时间框架(例如 M5

Fair Value Gap MTF is a professional multi-timeframe Fair Value Gap indicator for MetaTrader 5 designed for traders who use imbalance, liquidity, and smart money concepts in their analysis. The indicator automatically detects bullish and bearish Fair Value Gaps and displays them directly on the chart with a clean and optimized interface. Unlike basic FVG indicators, this version allows multiple timeframes to be displayed simultaneously on a single chart, making higher timeframe confluence analys

实时监控市场。趋势强度百分比显示。支持M1至D1多周期信号。 BFT是一款专为追求高效、清晰市场分析的交易者设计的多周期指标,无需杂乱图表与繁琐设置即可快速掌握行情。 该指标以直观的百分比形式,同步展示M1至D1多个周期的趋势强度与方向。助您瞬间洞察市场主导力量:多头还是空头。 BFT核心功能 市场整体趋势百分比量化 实时多空力量对比 覆盖M1, M5, M15, M30, H1, H4, D1全周期信号 精准标识趋势加速与衰减区域 敏锐捕捉市场情绪快速切换 核心优势 瞬时市场评估 大幅节省盘面分析时间 完美适配超短线/剥头皮、日内及波段交易 极简纯净的数据面板 高波动行情下依然稳定可靠 有效过滤假突破与无效入场点 适用人群 超短线/剥头皮交易者 日内交易者 Smart Money (SMC) / Price Action (PA) 交易者 外汇、黄金、股指及加密货币交易者 使用方法 BFT助您快速明确: 当前最佳交易方向; 哪些周期信号形成共振确认; 趋势何时进入加速阶段; 市场动能何时开始衰竭。 告别频繁切换图表的繁琐操作——所有关键数据已集成于单一面板中。 为什么选择BFT 市场

MGH-CrossAlert — Multi-Line, Multi-Timeframe Crossover Alert Indicator MGH-CrossAlert is a crossover detection indicator for MetaTrader 5 that monitors two user-selected lines and generates alerts when they cross or reach equality. Unlike standard moving average crossover tools, this indicator supports a wide range of line types and allows each line to be drawn from an independent timeframe. Supported Line Types Each of the two monitored lines can be configured independently as one of the follo

Стрелочный Индикатор OTKAT Оглавление Почему он работает? Фильтр "Уровня MACD" Фильтр "Времени" Фильтр "Круглых уровней" Оповещения (Alert, Push, Telegram) Результаты теста (EURUSD M5, Бинарки, 3 свечи) Что входит в покупку? Для кого это? Поддержка Привет. Представляю вам OTKAT — это стрелочник основанный на двух стратегиях, "Откат к Скользящей Средней" и "Откат в зону Перекупленности или Перепроданности WPR". Я протестировал его на парах EURUSD/GBPUSD на таймфреймах

Crypto_Forex 指标双 PINBAR 形态,适用于 MT5,无需重绘,无延迟。 ..............................................................................
- “双 PINBAR 形态”指标是一款非常强大的价格行为交易指标。 - 它比标准 Pinbar 形态更精准。 - 指标可检测图表上的双 PinBar: - 看涨双 PinBar - 图表上显示蓝色箭头信号(见图)。 - 看跌双 PinBar - 图表上显示红色箭头信号(见图)。 - 它内置 PC 和移动端警报。 - “双 PINBAR 形态”指标非常适合与支撑/阻力位结合使用。 ............................................... 点击这里查看高质量的交易机器人和指标! 本产品为独家产品,仅在本 MQL5 网站上提供。

Momentum Tidebreaker 是一款适用于 MetaTrader 5 的 不重绘 三类动能共振指标。它在每根收盘 K 线上,分别从三类独立信号进行评估:带 RSI 与动能共振过滤的 EMA 金叉/死叉检测、顺 EMA 趋势方向的 RSI 中轴(50)收复检测,以及在超买/超卖极值处的 RSI 背离检测。任意一类条件满足即可触发信号;当 Trend Cross 与 Divergence 在同一根收盘 K 线上同时满足时,信号会升级为强信号(Strong Signal),并在 BUY/SELL 三角形上方用琥珀色星标标记。每个信号都会在图表上自动绘制由 4 条线组成的风险架构(入场线、基于 ATR 的止损线、1R 的 TP1 以及可配置盈亏比的 TP2),同时一个 16 行仪表盘会跟踪实时浮动盈亏、分批止盈节点以及滚动更新的胜/负/胜率% 统计。 查看 MT4 版本: Momentum Tidebreaker MT4 更多产品请访问: 全部产品 想查看实盘示例和最新工具,请访问我的个人主页并添加好友,这样就不会错过任何更新! 工作原理 三类信号引擎 指标会计算一条快速 E

Reverse RSI Phantom 是一款适用于 MetaTrader 5 的 无重绘 反转与趋势延续指标,用来解决所有使用 RSI 的交易者都会遇到的一个问题:默认 RSI 运行在单独的指标窗口中,你无法在与K线同一视觉空间中同时看到超买与超卖区域。Reverse RSI Phantom 通过反向求解 RSI 公式,计算出使 RSI 等于 70、50 或 30 所需的精确价格,然后将这些数值绘制为主图上的实时价格带。价格带之上,叠加了一个五层共振引擎、应用在 RSI=50 中线上的状态机 Supertrend 趋势过滤器、基于枢轴点的背离检测模块,以及一个完整的风险管理系统,会在每个已确认信号上自动绘制止损 (SL) 和三个止盈 (TP) 目标(1R、2R、3R)。多区块仪表盘实时显示各组件状态,并配备覆盖所有事件类型的完整预警系统。 MT4 版本请查看: Reverse RSI Phantom MT4 更多产品请访问: 全部产品 想查看实盘示例和最新工具,请访问我的个人主页并发送好友请求,这样你就不会错过任何更新! 工作原理 价格水平反算引擎 标准 RSI 公式会把最近一

Big Trades v6.0 — Institutional Volume + Delta Analysis Descubre dónde realmente entra el dinero fuerte.
Big Trades v6.0 transforma el volumen del mercado en una herramienta visual avanzada capaz de detectar actividad institucional, agresión compradora/vendedora y desequilibrios de delta directamente sobre el gráfico. Diseñado para traders de Forex, índices, futuros, criptomonedas y CFDs que buscan leer el flujo real del mercado con una visualización limpia, potente y profesional. NUEVO EN V6

Big Trades v6.0 — Institutional Volume + Delta Analysis Descubre dónde realmente entra el dinero fuerte.
Big Trades v6.0 transforma el volumen del mercado en una herramienta visual avanzada capaz de detectar actividad institucional, agresión compradora/vendedora y desequilibrios de delta directamente sobre el gráfico. Diseñado para traders de Forex, índices, futuros, criptomonedas y CFDs que buscan leer el flujo real del mercado con una visualización limpia, potente y profesional. NUEVO EN V6

PivotMeridian is an advanced, visually optimized daily range and pivot mapping tool designed for professional manual traders. Instead of relying on static, intrusive chart overlays, it features a native, fully draggable dashboard that puts total control over historical analysis directly on your chart. Core Features Smart Daily Zones: Highlights the exact High-to-Low range of previous trading days using semi-transparent, color-faded blocks. Zones are intelligently inset to prevent them from visu

CV Support & Resistance is a professional support and resistance indicator for MetaTrader 5, designed to accurately identify key market and price zones. The indicator helps traders detect potential entry, exit, and reaction areas within the market at an early stage. Features: Automatic support and resistance zone detection Dynamic market structure analysis Professional visualization of key price areas Suitable for scalping, day trading, and swing trading Optimized for multiple symbols and timefr

Veltrion Session Breakout Heatmap is a premium MT5 custom indicator built for traders who want a clean visual view of session-based price action. It automatically marks the Asian Range, London Breakout, Fakeout or Trap Zones, and New York Continuation directly on the main chart. The indicator includes a professional draggable and resizable status panel, subtle session boxes, clear breakout markers, and non-trading visual analysis tools for XAUUSD, Forex pairs, and other supported symbols.

MACross_Final.mq5 — 完整指标说明
指标功能 这是一个适用于 MetaTrader 5 的移动平均线交叉信号指标。
当快速 MA 向上或向下穿越慢速 MA 时, 指标会自动显示 BUY 或 SELL 信号,并在图表上显示精准价格目标:
• SL(止损) • TP1 • TP2 • TP3
所有价格都会以文字标签形式直接显示在图表上。
特点: • 无重绘(Non-Repainting) • 不显示任何 MA 均线 • 图表干净简洁 • 专业交易界面
指标工作原理
BUY 买入信号
当快速 MA 在已收盘K线上向上突破慢速 MA 时, 会触发 BUY 信号。
图表显示:
• 蓝色 箭头出现在K线下方 • 精准 TP1 / TP2 / TP3 目标 • 精准 Stop Loss 止损位
显示示例:
TP3: 1.17xxx ← 蓝色文字(最远目标) TP2: 1.17xxx ← 蓝色文字 TP1: 1.17xxx ← 蓝色文字(最近目标)
BUY
SL: 1.17xxx ←

SuperTrend Sentinel Levels 是一款适用于 MetaTrader 4 的 无重绘 SuperTrend 指标 ,将经典的 SuperTrend 趋势跟随引擎与五重共振过滤器结合,用于筛选高质量交易信号。每一次趋势反转,指标都会在图表上绘制买入或卖出箭头,并自动生成完整的风险结构——入场价、止损(固定或移动)、TP1、TP2 和 TP3——同时,一个包含 18 行信息的综合仪表盘会跟踪评估当前交易结构所需的各种市场环境数据。包含 11 个信号类型的告警系统可以通过弹窗、声音、邮件和手机推送等多种方式发送提醒。 MT5 版本请查看: SuperTrend Sentinel Levels MT5 更多产品请访问: 全部产品 想查看实盘示例和最新工具,请访问我的个人主页并发送好友请求,以免错过任何更新! 工作原理 SuperTrend 引擎 指标使用可配置的 ATR(默认周期 10,系数 3.0)应用于 (High + Low) / 2 来构建 SuperTrend 线。趋势状态以“单向棘轮”的方式推进——在价格收盘跌破前一根 K 线的多头跟踪线之前,趋势

来自 NeuralTick 的 CleanTrend — 这是一款绝不重绘历史的趋势指标。厌倦了那些在历史上看起来完美,但在实盘交易中却重绘信号的指标吗?
厌倦了市场噪音与欺骗的交易者选择 CleanTrend 的三大理由:
100% 无重绘。 线条颜色一经确定便永久固定。没有任何一根K线会事后改变 — 您可在策略测试器中亲自验证。
双重噪音过滤。 仅当价格移动超过设定的阈值 (MinMove) 并且 在若干根K线内保持方向 (ConfirmBars) 时,信号才会出现。告别盘整行情中的「锯齿」假象。
让您随时掌握行情的警报系统。 弹出窗口、声音、日志记录以及发送到您智能手机的推送通知 (MetaTrader 5 应用)。即使终端已关闭,您也能即时获知趋势变化。
CleanTrend 不会用繁杂的面板让图表变得混乱 — 只有干净的彩色线条:蓝色 (买入) 或 红色 (卖出)。它计算入场价格,并严格过滤每一次价格波动。
点击「更多」,查看与普通指标的全方位对比、现成的趋势入场策略以及所有配置建议。
CleanTrend 与 98% 的「趋势」指标有何不

标题: Quantitative Divergence Pro:自动优化背离引擎 摘要: 停止依赖静态参数。利用基于推进式统计分析构建的自动优化、多震荡指标背离引擎,在市场中抢占先机。 描述: 市场是动态的;你的指标不应是静态的。 Quantitative Divergence Pro (v5.7) 通过直接在您的图表上运行持续的后台优化,摒弃了死板的默认设置。它能快速测试数千种震荡指标周期与超买/超卖(OB/OS)的参数组合,从而找到能为当前价格走势带来最高盈利因子(Profit Factor)的精确参数。因为归根结底,统计学才是唯一行之有效的方法。 核心功能: 自动优化引擎: 专有的预缓存句柄系统可即时扫描参数(适用于 RSI 或 MFI),以锁定最高的统计优势,且完全不会导致交易终端卡顿。 双轨独立运行: 标准背离(反转)和隐藏背离(延续)的优化和跟踪完全独立,有效防止历史数据过度拟合(curve-fitting)。 内置虚拟交易: 该指标使用基于 ATR 的动态止损和止盈区域,结合可配置的基于时间的出场机制,对历史交易信号进行评分。 实时数据面板: 即时查看当前优化设置的历史表

Candle Dominator Pro
为什么 Candle Dominator Pro 不只是另一个吞噬指标 市场上大多数吞噬指标都遵循同样的逻辑:找到两根蜡烛——画一个箭头。没有过滤器,没有趋势背景,没有市场意识。结果——每天出现数十个虚假信号。 Candle Dominator Pro 通过多层过滤系统解决了这个问题。每个信号在出现在图表上之前要经过多达7项独立检查。您获得的信号更少——但每一个都是高质量的。 与竞争对手的主要区别 不重绘 — 箭头只出现在已收盘的K线上,永远不会消失 RCI过滤器 — 日本斯皮尔曼等级相关指标,在市场上极为罕见,比标准RSI对反转更敏感 合成蜡烛 — 日本技术,将两根形态蜡烛合并为一根以评估影线质量。竞争产品中没有的独特过滤功能 关键价位过滤 — 仅在真实支撑位和阻力位附近发出信号 EA兼容性 — 通过iCustom()连接用于自动交易 通过iCustom()与智能交易系统兼容 该指标与自动交易系统完全兼容: cpp // 缓冲区 0 = 看涨信号,缓冲区 1 = 看跌信号 double bull = iCustom ( NULL , 0 ,

用终极机构级主系统提升您的交易 这款一体化指标实时显示市场算法。使用市场上最全面的聪明钱概念(SMC)和 ICT 工具步入机构交易的世界。我们没有用多个繁重的指标让您的图表变得杂乱无章,而是将核心机构交易方法整合到一个强大、超轻量且完全互动的主系统中。 无论您是日内交易者、剥头皮交易者还是波段交易者,该指标都能为您追踪机构算法足迹提供所需的极致清晰度。 使该指标脱颖而出的主要特点: 交互式图表仪表板(全新升级): 体验真正的图表自由。我们专有的交互式仪表板允许您直接在图表上通过单击来开启(ON)或关闭(OFF)特定功能(OB、FVG、DOL、MS、KZ 和 PDA)。保持工作区整洁,在任何给定时刻只关注您需要的数据,而无需打开指标设置。 带评分的高概率订单块(OB): 不再猜测哪些区域会撑住。我们先进的订单块引擎不仅仅是画框;它会根据累积的 Tick 交易量和位移(Displacement)大小计算动态概率得分(%),帮助您过滤掉弱势的设置。 [全新] 带评分的精准合理价值缺口(FVG): 瞬间识别市场失衡。现在升级了其内置的基于成交量和缺口的评分系统,该指标无瑕疵地映射和评估看涨和看

ArfimaPro – Real‑Time Market Regime Detection
Most strategies fail because they trend‑follow during mean‑reverting markets and mean‑revert during trending markets. ArfimaPro solves this by measuring the market's long‑memory structure in real time using the Geweke‑Porter‑Hudak (GPH) estimator of the fractional differencing parameter d – the key ARFIMA statistic. Key Features GPH d(t) estimation – Plots the fractional differencing parameter d (blue line). d > 0 indicates long memory (persistence)

Crypto_Forex 指标随机平移检测器 - 是一款高效的交易辅助工具!无需重绘。 我推荐您使用这款适用于 MT5 的出色指标来升级您的交易方法。 - 指标在图表上显示价格平移区域。它具有“平移敏感度”参数,用于平移检测。 - 随机平移检测器可用于价格行动入场确认、背离或超卖/超买信号。 - 您可以将其用于趋势跟踪系统,以检测平移区域并避免在该区域交易。 - 您可以将其用于反转剥头皮交易 - 从平边进行反转交易。 - 有很多机会可以使用随机平移检测器替代标准随机指标。 - 随机指标本身是市场上最好的震荡指标之一 - 对许多交易者来说都是完美的工具。 ................................................ 点击这里查看高质量的交易机器人和指标! 这是仅在 MQL5 网站上提供的原创产品。

MASCROSS 现已升级 ALERTS 功能,这是一款专为 MetaTrader 5 打造的强大智能交易指标,可快速检测 BUY 和 SELL 信号,并在电脑和手机上实时推送通知。 购买后联系我,可免费获得 3 个顶级指标。 此升级版 ALERTS 功能提供: • 即时 BUY & SELL 提醒
• 电脑和手机 Push 推送通知
• 实时信号检测
• 清晰易读的箭头信号
• 智能趋势确认
• 快速信号执行
• 针对 XAUUSD 和外汇货币对优化
• 新手友好设置 该指标帮助交易者快速发现市场机会,无需长时间盯盘。 功能特点: MetaTrader 桌面端 Push 提醒
Android 和 iPhone 手机通知
买入/卖出信号提醒
全天候市场监控
智能交易辅助
快速高效的交易信号 最适用于: • XAUUSD(黄金)
• 外汇货币对
• 剥头皮交易(Scalping)
• 日内交易
• 趋势交易 MASCROSS ALERTS 专为希望获得快速通知、智能入场点和专业交易体验的交易者打造。 手机/电脑上的提醒示例: BUY:
MASCROSS ALERT

Pulse Reversal Zones Pro 帮助 MT5 交易者通过简洁的实时仪表盘识别潜在的反转区域、市场疲软迹象、入场区域、止盈/止损预测以及趋势压力。购买前,请下载演示版并在策略测试器中进行测试。
Pulse Reversal Zones Pro 专为那些寻求更清晰方式来识别潜在市场反转、动能衰竭及价格反应区域的交易者而设计,且在显示信息的同时不会导致图表变得过于拥挤杂乱。
该指标采用了一种基于“脉冲”原理的反转识别引擎,其灵感源自先进的动量分析与延展性逻辑。它综合分析了市场走势、震荡指标距离、EMA 偏差、零轴位置、信号强度以及(可选的)更高时间周期偏差之间的相互关系。当各项条件达成一致时,它会直接在图表上标记出潜在的做多(LONG)或做空(SHORT)脉冲交易机会。
与那些仅显示简单箭头的初级指标不同,Pulse Reversal Zones Pro 提供了一套完整的可视化交易框架。它将入场区域、预估止盈(TP)水平、止损(SL)区域、信号评分、市场偏差、延展性状态、确认模式以及实时扫描状态,全部整合在一个简洁明了的界面之中。
为何交易者应当选用此指标? 本指

STOP MANAGER ATR 工作原理 StopManager ATR 基于 固定资本 风险管理,计算并直观显示您的止损应放置在何处。该指标使用预定义资本(例如 50,000 美元)的百分比风险概念来确定止损点数距离。 此外,该指标还绘制了一条 水平 ATR 线 (平均真实范围),具有三种交易模式:DayTrader(1倍ATR)、Swing(2倍ATR)和 LongTerm(3倍ATR),允许交易者比较不同的止损方法。 入场价格始终是 当前市场价格 (买入价为 Ask,卖出价为 Bid),计算每秒自动更新。 优势 基于固定资本的 专业风险管理 自动检测 您的账户余额和杠杆 图表上的 两条水平线 :计算出的止损(红色实线)和 ATR 参考线(蓝色虚线) 三种 ATR 模式 ,适用于不同交易风格 实时更新 ,每个 tick 都会更新 完整信息面板 ,包含所有相关数据 适用于任何资产 :外汇、指数、大宗商品、加密货币、股票 输入参数 参数 描述 Volume (lots) 手数大小 Direction (Buy/Sell) 交易方向:买入或卖出 Fixed Capital (USD

NAVIUS SYSTEM — professional institutional-style market intelligence indicator for MetaTrader 5. The indicator is designed for traders who want to understand WHY the market moves, not just receive random buy/sell arrows. NAVIUS SYSTEM combines:
• Liquidity sweep detection
• Smart market structure analysis
• Dynamic support & resistance zones
• Trend and volatility analysis
• Exhaustion detection
• Trap and fake breakout recognition
• Institutional-style dashboard
• Market state monitoring The sy

Order Block MTF is a professional multi-timeframe Order Block indicator for MetaTrader 5 designed for traders who use smart money concepts, market structure, liquidity, and institutional trading logic in their analysis. The indicator automatically detects bullish and bearish Order Blocks and displays them directly on the chart with a clean and optimized interface. This tool allows traders to analyze multiple higher and lower timeframe Order Blocks simultaneously without changing the current char

BOS / CHOCH MTF is a professional multi-timeframe market structure indicator for MetaTrader 5 designed for traders who use Smart Money Concepts, ICT methodology, liquidity analysis, and institutional price action. The indicator automatically detects and displays Break of Structure (BOS) and Change of Character (CHOCH) events directly on the chart across multiple timeframes. This tool helps traders identify market structure shifts, trend continuation, and potential reversals with a clean and opti

A1rum In1 Target V1 是一款智能混合型交易指标,旨在将市场方向、区域分析和信号质量整合到一个专业的仪表板中。 该指标适合希望保持图表简洁并加快交易决策速度的交易者。它将趋势偏向、区域映射、时机确认和动态评分整合为一个完整系统。 主要功能 Smart BUY / SELL signal detection
Dynamic signal strength meter
Professional dashboard interface
Trend bias & market quality analysis
Zone-based entry confirmation
Timing Pulse confirmation engine
Daily session zone levels
Clean body-only candle coloring
Optimized for backtesting and live trading
Supports all major forex pairs
Works on multiple timeframes Dashboard 包含 S

This indicator is designed for traders who follow the *London Breakout Strategy , one of the most reliable approaches in the Forex market due to the high volatility at the start of the London trading session.
Here is a detailed breakdown of its functions and settings
---
### Indicator Overview: London Breakout (MQL5)
Core Function:
The primary goal of this indicator is to capture the "accumulation" phase that occurs just before or during the London open (often during the Frankfurt/London

高级自定义加密货币外汇指标“自适应能量震荡指标”——MT5平台的高效辅助交易工具! - 该指标是新一代震荡指标。 - “自适应能量震荡指标”具有可调节的自适应超卖/超买区域。 - 这是一款技术动量指标,在趋势市场中非常实用。 - 该震荡指标是一款辅助工具,可帮助您从超卖/超买区域找到进入主趋势方向的精确入场点。 - 自适应超卖区域:绿线下方。 - 自适应超买区域:红线上方。 - 它比标准震荡指标更精准。 - 该指标可用于任何时间周期。 - 内置PC和移动设备警报功能。 ........................................................................... Click here to see high quality Trading Robots and Indicators! 本产品为MQL5独家原创产品。

SMART STRUCTURE HEATMAP MASTER VIRTUAL – MT5 INDICATOR Professional multi-timeframe & multi-pair trend strength heatmap for MetaTrader 5. This indicator combines:
Market Structure
EMA Trend Direction
ADX Strength Filter
RSI Momentum
Heikin Ashi Confirmation to generate a powerful visual heatmap showing bullish, bearish, or sideways market conditions instantly. FEATURES Multi-Pair Scanner
Monitor multiple symbols at the same time. Multi-Timeframe Analysis
Analyze M5, M1

WELCOME TO THE ULTIMATE TRADING REVOLUTION! Are you tired of lagging indicators, fakeouts, and leaving massive profits on the table? It’s time to stop guessing and start sniping! Introducing Dubai Sniper Ultra Strategy, the most powerful, highly-optimized trend-following and reversal indicator meticulously engineered for MetaTrader 5. This isn't just another indicator—this is your ultimate weapon to dominate the markets, especially built to crush indices like SPX500, Gold, and Major Forex pair
MetaTrader市场是您可以下载免费模拟自动交易,用历史数据进行测试和优化的唯一商店。
阅读应用程序的概述和其他客户的评论,直接下载程序到您的程序端并且在购买之前测试一个自动交易。只有在MetaTrader市场可以完全免费测试应用程序。
