ADX Pro Multi TimeFrame And MultiCurrency

ADX Pro Indicator

This Indicator Are Advanced Pro ADX Indicator 

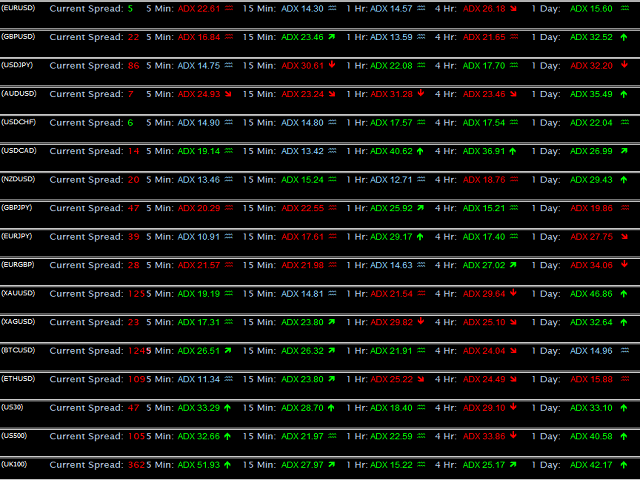
Multi Time Frame Are Same Window

Multi Currency Are Same Windows

All Time Frame And All Currency ADX Strenght Are Same Window Monitring 

You Will Add Manully All Currency Pairs , And Metel , And Also Crypto Currency

Pairs : EURUSD , GBPUSD, USDJPY .... Etc , Metel : XAUUSD , XAGUSD ... Etc , Crypto : BTCUSD, ETHUSD... Etc


推荐产品
FiboPlusWaveRunner
Sergey Malysh
3.29 (7)
Expert.   Automatic and manual trading. Ready-made trading system based on   Elliott waves   and Fibonacci retracement levels . It is simple and affordable. Display of the marking of Elliott waves (main or alternative option) on the chart. Construction of horizontal levels, support and resistance lines, a channel. Superposition of Fibonacci levels on waves 1, 3, 5, A Alert system (on-screen, E-Mail, Push notifications).    visual panel for opening orders in manual trading. visual panel for sett
Smart Reversal Signal
Evgeny Belyaev
3 (2)
Smart Reversal Signal  is a professional indicator for the MetaTrader 4 platform; it has been developed by a group of professional traders. This indicator is designed for Forex and binary options trading. By purchasing this indicator, you will receive: Excellent indicator signals. Free product support. Regular updates. Various notification options: alert, push, emails. You can use it on any financial instrument (Forex, CFD, options) and timeframe. Indicator Parameters Perod - indicator calculat
Discover the Power of Trend Strength Pro Unlock a new level of clarity in your trading with Trend Strength Pro , the ultimate tool for visualizing market momentum. Stop guessing and start seeing the true strength of a trend with a single glance. Our elegant and intuitive indicator helps you make smarter, more confident trading decisions. Key Advantages & Features Instantly See Trend Strength : Our color-coded histogram tells you whether the trend is getting stronger or weaker. Green means moment
FREE
Force Directional
Jan Carlos Pagano
力向指标 力向技术指标的基础是将一组元素组合在一起,这些元素可用于帮助交易员衡量价格运动的相对强度,并同时识别和跟踪趋势的方向性。 该指标由一个慢速振荡器(黑线)、一个快速振荡器(灰线)和一个具有降低值的指数中线组成,该中线充当信号线(蓝线),识别运动的逆转并充当方向指南。该指标的振荡器在100值的上方或下方移动,比较最后一个价格的收盘价与先前的收盘价,无论时间视野如何。 该指标在识别趋势逆转方面特别有效,可以成功地应用于任何时间框架。然而,建议在更长的时间框架上使用它,以更准确地评估运动或趋势的强度,以做出更明智的决策。 如何使用: 建议的策略是当慢速振荡器向上穿过信号线,值小于100时,做多,当其向下穿过信号线,值大于100时,做空。值的扩展越大,入场效果越好。只要慢速振荡器在信号线上方,就保持多头仓位,只要慢速振荡器在信号线下方,就保持空头仓位。 关键模式: 泡沫: 往往预示着趋势逆转或突显仓位卸载。当快速振荡器向上穿过慢速振荡器(预示上升趋势)或向下穿过慢速振荡器(预示下降趋势)时形成。泡沫是趋势强度和即将结束的宝贵指标。 分歧: 当力向指标与价格运动分歧时,可以
AI Scalper
AHMED ZABIR SAZOL
This EA works based on HFT (high-frequency trading) algorithm and mini bar height. it open trades when bar height meets some indicators mathematical confirmation and utilizes a strategy rooted in precise mathematical calculations, It is a fully automated pullback trading system, which is especially effective in trading on popular pullback currency pairs: AUDCAD, AUDNZD, NZDCAD. The system uses the main patterns of the Forex market in trading – the return of the price after a sharp movement in an
Market Structure Zig Zag
Lesedi Oliver Seilane
4.66 (29)
Free Market structure zig zag to assist in price action trading the screenshots describe how to use and how to spot patterns new version comes with alerts, email alert and  push notification alert can be used on all pairs  can be used on all timeframes  you can add additional confirmation indicators the indicator shows you your higher high and low highs as well as your lower lows and lower highs  the indication makes price action analysis easier to spot.
FREE
Binary Option Signal
Yaroslav Varankin
Indicator for binary options arrow is easy to use and does not require configuration works on all currency pairs, cryptocurrencies buy signal blue up arrow sell signal red down arrow tips do not trade during news and 15-30 minutes before their release, as the market is too volatile and there is a lot of noise it is worth entering trades one or two candles from the current period (recommended for 1 candle) timeframe up to m 15 recommended money management fixed lot or fixed percentage of the depo
GTAS FibTdi
Riviera Systems
GTAS FidTdi is a trend indicator using combination of volatility and potential retracement levels. This indicator was created by Bernard Prats Desclaux, proprietary trader and ex-hedge fund manager, founder of E-Winvest. Description The indicator is represented as a red or green envelope above or under prices. How to use Trend detecting When the envelope is green, the trend is bullish. When it is red, the trend is bearish. Trading Once a trade is opened, GTAS FibTdi shows retracement zones wh
FREE
BINARYEXPERT 指标 是一款为追求精准入场信号的二元期权交易者打造的强大技术工具。专为 MetaTrader 4 平台开发,结合了多个技术指标(包括 EMA、RSI、MACD、Stochastic 和 ATR),用于生成可靠的买入(CALL)和卖出(PUT)信号。配备友好的界面和实时统计面板,BINARYEXPERT 可帮助交易者做出更明智的交易决策。 核心功能 多指标分析: 利用 EMA、RSI、MACD、Stochastic 和 ATR 综合生成稳健信号。 信号评分系统: 通过打分机制生成信号,仅在多项条件同时满足时发出高概率信号。 实时统计面板: 显示胜率、趋势方向和交易时段状态,便于快速判断。 参数可自定义: 可根据个人风格调整 EMA、RSI、Stochastic、ATR 和信号评分阈值。 交易时段控制: 设置活跃交易时间段,配合你的策略进行交易。 图表可视化信号: 直观的 CALL(绿色箭头)和 PUT(红色箭头)信号绘制在图表上。 参数设置 短期 EMA 周期: 默认 50,用于分析短期趋势。 长期 EMA 周期: 默认 200,用于确认长期趋势。 RSI 周期
Insight Investor: Advanced Multi-Currency Forex Trading Bot Introduction In the fast-paced world of Forex trading, having the right tools can significantly enhance your trading experience. Insight Investor is an advanced multi-currency trading bot designed to automate and optimize your trading operations. This expert advisor employs modern algorithms to analyze market conditions and execute trades, aiming to deliver consistent results while maintaining controlled risk levels. Key Features of Ins
Pirate
Anatoliy Lukanin
3.9 (20)
Deposit :   from 100 deposit units Trading pairs: I recommend currency pairs: EURAUD, CHFJPY, EURCHF, EURGBP, AUDCHF, CADCHF, USDCHF. Trading period :  Any Account: You should use ECN-ECN.Pro accounts with five-digit quotes with a moderate size (spread). Parameters: USING - Choice, trading risk or fixed lot RISK/LOT - Lot Risk Value RESTORING_THE_BALANCE - Restoring balance* HOW_THE_RESET_WINDOW - Reset the Global Variable TAKE_PROFIT - Set profit STOP_LOSS - Set loss COUNT_BUY - The number of s
Investmen Guru 4
Vitalii Zakharuk
Forex Bot Investment Guru Description: Highly Efficient Trading Tool Introduction Among the many tools for trading on the foreign exchange market, the   Investment Guru   forex bot stands out with its advanced internal architecture and unique operating mechanics. Its main goal is to provide traders with the ability to maximize market volatility without promising profits but with a clear structure that encourages purchasing. Operating Principle Investment Guru   employs trend trading methods, all
Stufic
Tomas Hruby
5 (1)
Stufic is a result of the long way of development. It was created for use in the management of capital of trading groups. The main idea is to preserve capital through unexpected fluctuations of the markets. It is one of the system that can perform on 90% of currency pairs. It's a participant on World Cup Trading Championship 2016 with real 10K USD. Stufic was also between top five traders in real money contest organized by Fidelis Capital (November 2015, Gain +48%). Why should you have to choos
Binary Smart Eye
Ramzi Abuwarda
“Binary Smart Eye”MT4指标旨在为二元期权和外汇市场提供交易信号,可在M1至W1的广泛时间范围内运行。它采用一种专有策略,结合了趋势水平、智能移动平均线和优化的交易周期,以识别潜在的入场点。 以下是其主要功能的详细介绍: 多时间框架分析: 该指标的多功能性允许交易者在各种时间框架上使用它,满足不同的交易风格,从M1上的剥头皮交易到W1上的长期趋势跟踪。 专有策略: “Binary Smart Eye”的核心在于其独特的策略,该策略利用: 趋势水平: 这些水平有助于识别当前的市场趋势和潜在的反转点。 智能移动平均线: 一种定制的移动平均线,可适应市场波动并提供准确的趋势方向。 智能交易周期: 该指标根据特定的时间周期优化其信号生成,旨在捕捉最佳市场条件。 信号和警报系统: 当指标的参数一致时,它会生成清晰的视觉信号和声音警报,提示交易者发起交易。 二元期权和外汇兼容性: 该指标的设计使其适用于二元期权交易(精确的入场时机至关重要)和外汇交易(强调趋势跟踪和利润目标)。 马丁格尔策略考虑: 描述中提到了在不利市场条件下使用马丁格尔策略的选项。重要的是要知道马丁格尔策略风险
BinaryUniversal
Andrey Spiridonov
BinaryUniversal is a signal indicator for binary options and Forex. In its work, the indicator uses a complex algorithm for generating signals. Before forming a signal, the indicator analyzes volatility, candlestick patterns, important support and resistance levels. The indicator has the ability to adjust the accuracy of the signals, which makes it possible to apply this indicator for both aggressive and conservative trading. The indicator is set in the usual way, it works on any time period and
HFT Dominator MT4
Cedric Landry Shema
HFT Dominator – 超快速市场执行系统 这款 专家顾问 (EA) 专为 高速、低延迟 的市场操作而设计。 它能够在 极小的点差内执行精确入场 ,非常适合 快速市场 ,如贵金属、指数和外汇对,并具备优化的滑点控制。 促销: 以 30美元租用EA 30天 — 限时优惠。 该系统支持 多种资金管理模式 、自适应交易时机和保护性追踪止损逻辑,以确保对快速交易的 最大控制 。 输入参数概览 通用设置 (General Settings) Magic Number – EA交易的唯一标识符。 Slippage – 订单执行期间允许的最大价格偏差(以点为单位)。 时间设置 (Time Settings) Start Hour / End Hour – 定义经纪商服务器时间内的交易窗口。 secs – 交易操作之间的最短时间延迟(减少过度交易)。 资金管理 (Money Management) Lot Type – 计算仓位大小的方法: Fixed_Lots – 固定手数 Pct_of_Balance – 基于账户余额的风险百分比 Pct_of_Equity – 基于当前净值的风险百分比
BinaryScalping
Andrey Spiridonov
BinaryScalping is a professional indicator for trading binary options and scalping. The algorithm of the indicator is based on the calculation of pivot points for each time period separately, the location of the price of the trading instrument relative to the pivot points is analyzed and the probability of a trading operation is calculated. The indicator has a built-in filter of trading signals based on the global trend. The indicator is installed in the usual way and works with any trading inst
Gold Crazy EA MT4
Nguyen Nghiem Duy
Gold Crazy EA   is an Expert Advisor designed specifically for trading Gold H1/ EU M15. It use some indicators to find the good Entry. And you can set SL or you can DCA if you want. It can be an Scalping or an Grid/ Martingale depend yours setting. This EA can Auto lot by Balance, set risk per trade. You also can set TP/ SL for earch trade or for basket of trade. - RSI_PERIOD - if = -1, then the default strategy works, if >0, then the RSI strategy works - MAX_ORDERS - to trade with only 1 order,
One Click Trader Utility
AL MOOSAWI ABDULLAH JAFFER BAQER
One-Click Trader Utility for MT4 Professional Trading at Your Fingertips One-Click Trader Utility is a premium MT4 tool designed for active traders who need lightning-fast execution and real-time performance metrics. For just $30, transform your trading experience with institutional-grade technology previously available only to professional traders. Key Features Ultra-Fast Execution - Open and close positions with a single click, critical for scalpers and news traders Real-Time Market Metrics -
Smart FVG 指标 MT4 – MetaTrader 4 高级公平价值缺口检测 Smart FVG 指标为 MetaTrader 4 提供专业的公平价值缺口(Fair Value Gap,FVG)检测、监控和告警功能,所有信息都直接显示在图表上。它将基于 ATR 的过滤与结构感知逻辑相结合,帮助你去除噪音、适应流动性,并只保留最关键的不平衡区域,从而做出更加精确的交易决策。 主要优势 精准的 FVG 检测:识别真正的市场低效,而不仅仅是简单的 K 线价格跳空。 基于 ATR 的自适应精度:根据不同市场与周期自动过滤低质量信号。 实时有效性跟踪:当价格填补或突破缺口时,相关区域会被自动延伸、调整或删除。 高度可视化与自定义:可根据任何模板自定义颜色、线型和填充样式。 实用告警功能:对新出现、被填补或被突破的 FVG 提供实时通知。 性能优化:轻量化设计,适合多品种、多周期同时扫描。 工作原理 将指标加载到任意 MT4 品种与时间周期图表上。 算法会扫描历史与实时 K 线,标出当前有效的 FVG 区域。 ATR 逻辑会根据当前波动率和流动性动态调整检测条件。 当价格完全回补缺口
FREE
“信號直方圖剝頭皮”指標是一種以直方圖和信號形式呈現的通用指標,無需重繪或滯後。 “信號直方圖剝頭皮”指標在圖表上顯示趨勢上的最佳入場點。 最好將其與其他趨勢指標結合使用作為過濾器。 該指標在 M5 時間範圍內顯示出良好的結果。該信號在蠟燭收盤後生成,並以綠色和紅色圓圈的形式出現。 “信號直方圖剝頭皮”指標旨在以純粹的形式進行剝頭皮交易,並使用過濾器進行日內交易。 屏幕截圖顯示了持倉進入點和退出點的示例。 當使用“信號直方圖剝頭皮”指標進行交易時,您將始終獲利,因為該指標算法包含獨特的剝頭皮策略    “信號直方圖剝頭皮”指標是一種以直方圖和信號形式呈現的通用指標,無需重繪或滯後。 “信號直方圖剝頭皮”指標在圖表上顯示趨勢上的最佳入場點。 最好將其與其他趨勢指標結合使用作為過濾器。 該指標在 M5 時間範圍內顯示出良好的結果。該信號在蠟燭收盤後生成,並以綠色和紅色圓圈的形式出現。 “信號直方圖剝頭皮”指標旨在以純粹的形式進行剝頭皮交易,並使用過濾器進行日內交易。 屏幕截圖顯示了持倉進入點和退出點的示例。 當使用“信號直方圖剝頭皮”指標進行交易時,您將始終獲利,因為該指標算法包含獨特的剝
IA Trendx3 PRO
Marco Aurelio Santos Costa
What if God Created a Trade System? No miracles... Just see how mathematics can be effective in the market. We managed to combine technical analysis / price action into indicators, creating the best setup for trading, be it in Forex, Indices, or stocks. It took us 2 years to create something that really works, and now it's time for you to discover it. TrendX3 is a revolution in trend analysis. Based on advanced algorithms and real-time data, it provides valuable insights so that you can make inf
The indicator of a Professional Trader is an arrow indicator for predicting the direction of price movement. I have been working on this indicator since 2014. You can use this indicator as your main indicator, use its entry signals, and use it as your only indicator to find entry points. About the product: Recommended TF [H4-D1-W1]   . The indicator predicts the direction of the next candle. Fits a variety of tools; Flexibility in settings for different instruments and intervals through the MO
FREE
Crypto_Forex MT4 版“分形通道”指标。 - 该指标基于分形的高点/低点显示实际的局部趋势线。 - 非常适合使用图形分析的交易者。 - 阻力局部趋势线 - 红色。 - 支撑局部趋势线 - 蓝色。 - 该指标包含几个参数,分别用于控制分形数量、趋势线颜色和宽度。 - 该指标非常适合用于检测当前市场状况: - 看涨市场 - 两条趋势线均上涨。 - 看跌市场 - 两条趋势线均下跌。 - 横盘整理 - 两条趋势线方向相反。 ................................................................................................................. // 优秀的交易机器人和指标可在此处获取: https://www.mql5.com/en/users/def1380/seller 这是仅在 MQL5 网站上提供的原创产品。
TMA AI Bands
Monique Ellen Miranda Dos Santos
Be notified of every color change of Heiken Ashi (HA) candles. The indicator will trigger past and new signals every time that HA candles change their colors. Note : this tool is based on the code of Heiken Ashi indicator developed by MetaQuotes Software Corp. Features The signals are triggered at closing of last bar/opening of a new bar; Any kind of alerts can be enabled: Dialog Box, Email message, SMS notifications for smartphones and tablets, and Sound alerts; By default, up arrows are plott
MTF Moving Averages
Guillermo Pineda
5 (1)
MTF Moving Averages is an useful indicator that brings you data from fully customizable higher timeframe Moving Averages on your charts, you can add multiple Moving Averages to use even more data of current market conditions. Check the indicator in action [Images below] What MTF Moving Averages does apart from showing higher timeframe MA's? Time saver , having all your higher timeframe MA's in just one chart, time is key, avoid switching between timeframes. Enter Trends precisely, easy to follo
M1Arrows MT4 Indicator
Marcos Camargo
3.5 (2)
M1Arrows is a MT4 trend arrows Indicator * Smart Scalper Setup (M1) :: Signal 5 Main 20 + Signal 20 Main 80 + Fibonacci ZigArcs 20 (Screenshot1) Add the indicator with first setting, then add it again to the same graph with other settings. You can add as many as you want, but 2 M1Arrows in just one graph is enought Never open orders againt the slow setting trend Do not open more than 3 orders per slow setting trend It will work better in Europe/USA markets, * M15 Day Trade Setup: Signal 20 ma
FREE
DracoAI
Hua Manh Hung
DracoAI is a revolutionary automated forex trading robot based on neural network.  Loss coverage is our premium exclusive feature. DracoAI IS: THE BEST MONEY MAKING SERVICE & STABLE PASSIVE INCOME PROFIT, EVEN IF YOU DO NOT PARTICIPATE IN BIDDING FINANCIAL INDEPENDENCE AND STABILITY DracoAI IS SAFE, BECAUSE: WE GUARANTEE THE SAFETY OF YOUR FUNDS NEGATIVE RESULTS OF TRADING ARE COVERED BY OUR RESERVE FUND 100% CONFIDENTIALITY Monitoring  - most popular signal at MQL5 :  https://www.mql5.com/en/s
Market Maestro: Your Ideal Partner for Automated Forex Trading If you're looking for a reliable assistant for trading in the currency market, Market Maestro is exactly what you need. This modern Forex bot is built using the latest technologies and algorithms, allowing it to effectively analyze market data and make informed trading decisions in real-time. Key Features of Market Maestro 1. Multicurrency Capability for Broad Opportunities Market Maestro can work with a wide range of currency pairs,
该产品的买家也购买
Rtc ML Ai Predictor MT4
Muhammad Faisal Sagala
Product Description Rtc ML Ai Predictor — Futuristic Intelligence for Real-Time Market Decisions Bring robotic precision to your trading.   Rtc ML Ai Predictor   fuses   Machine Learning   with   SMA-shift dynamics   to forecast short-term momentum and trend inflection points with clarity. The model evaluates multi-factor market structure, assigns a   confidence score   to each signal, and lets you act only when conditions align with your rules. Why traders choose Rtc ML Ai Predictor AI-guided e
Hit Rate Top Bottom Signal
Martin Alejandro Bamonte
命中率顶部底部信号 命中率顶部底部信号 命中率顶部底部信号 提供了一种完全创新的方法。 它非常适合那些希望预先评估信号在特定 TP-SL 下的表现以及在哪些货币对/时间框架(TF)中效果最佳的人。 命中率顶部底部信号 策略是 任何交易员和任何交易类型 的重要工具,因为它不仅发出 精确且不重绘的信号 ,明确指示何时交易以及交易方向,而且还 详细记录每个货币对和时间框架的命中率 ,并预设止盈(TP)和止损(SL)。 这使得能够提前知道信号的有效性比率 ,对于良好的风险管理和精确的交易至关重要。 该策略的独特之处在于它专注于在波动的反转点进行检测,而不是在整个行情中,这使得信号的发出频率比传统的顶部底部信号更高,专注于 市场每一个重要波动的关键时刻。 这种以百分比显示 信号历史效果与SL/TP比率结合的能力 使得这项策略成为安全交易的最佳选择,让交易员能够基于数据做出决策。 依靠一个不仅清晰直接而且历史记录良好的信号,我们正在使用市场上最好的策略之一。 如何使用该系统进行交易? 打开多个货币对并在每个货币对上加载指标。现在,分析每个货币对,以确定哪些货币对和时间框架(TF)信号效果
该指标是一款多功能技术分析工具,基于自适应指数移动平均线(EMA)与通过真实波动幅度均值(ATR)计算的波动率过滤器相结合而构建。其设计目的是精确识别当前价格方向,突出潜在趋势转折的关键区域,并直观显示可能的反转区域。 算法的核心是通过两层波动率构建动态趋势带:外层和内层。外层边界起到强突破信号的作用,而内层水平则在指数均线斜率发生变化时捕捉价格结构的温和反转。这种组合确保了指标在保持对市场噪音抗干扰性的同时,也具有较高的灵敏度。 图形表现中加入了对比鲜明的箭头标记,用于提示趋势的变化。该指标不会重绘信号,这使其在交易策略和风险管理系统中成为可靠的过滤工具。 优势 多层波动率分析 —— 通过使用内外ATR通道,既能捕捉剧烈突破,也能识别趋势的逐渐转向。 自适应平滑 —— 内置可调系数的EMA平滑算法,能够适应不同的市场环境。 无重绘 —— 信号在出现时固定不变,确保历史分析的可靠性。 清晰可视化 —— 明确的趋势线与箭头标记,可即时评估市场状态。 灵活配置 —— 广泛的参数设置,可适配各种时间周期和金融工具。 通用应用 —— 既可用于趋势跟随策略,也可作为逆势过滤器。 指标参数 算法
Dual Momentum
Adolfina Denysenko
Dual Momentum is a modern arrow indicator for MetaTrader 4, created specifically for the accurate detection of market reversals and strong impulse movements. The indicator is based on a combination of two powerful oscillators – Williams %R and RSI, which allows you to filter noise and generate more reliable signals. Thanks to this, Dual Momentum indicates only key entry points when the probability of a successful trade is highest. Key advantages: No redrawing – signals remain on the cha
FFx Engulfing Setup Alerter gives trade suggestions with Entry, Target 1, Target 2 and StopLoss. Below are the different options available: Entry suggestion - pips to be added over the break for the entry 3 different options to calculate the SL - by pips, by ATR multiplier or at the pattern High/Low 3 different options to calculate the 2 TPs - by pips, by ATR multiplier or at Risk/Reward Offset the dashboard - any place on the chart Remove the suggestion once the price reached the SL line Lines
FFx InsideBar Setup Alerter gives trade suggestions with Entry, Target 1, Target 2 and StopLoss. Below are the different options available: Entry suggestion - pips to be added over the break for the entry Minimum candle size - to avoid too close buy/sell entry suggestions 3 different options to calculate the SL - by pips, by ATR multiplier or at the pattern High/Low 3 different options to calculate the 2 TPs - by pips, by ATR multiplier or at Risk/Reward Offset the dashboard - any place on the c
FFx OutsideBar Setup Alerter gives trade suggestions with Entry, Target 1, Target 2 and StopLoss. Below are the different options available: Entry suggestion - pips to be added over the break for the entry. 3 different options to calculate the SL - by pips, by ATR multiplier or at the pattern High/Low. 3 different options to calculate the 2 TPs - by pips, by ATR multiplier or at Risk/Reward. Offset the dashboard - any place on the chart. Remove the suggestion once the price reached the SL line.
FFx PinBar Setup Alerter gives trade suggestions with Entry, Target 1, Target 2 and StopLoss. Below are the different options available: Entry suggestion - pips to be added over the break for the entry Minimum candle size - to avoid too small candles 3 different options to calculate the SL - by pips, by ATR multiplier or at the pattern High/Low 3 different options to calculate the 2 TPs - by pips, by ATR multiplier or at Risk/Reward Offset the dashboard - any place on the chart Remove the sugges
Lineverse Trendlines
Arkady Segal
5 (1)
Automatic, live & interactive picture of all trendlines. Assign push, email and sound alerts to the lines of your choice and be informed about price rollback, breakout, rollback after breakout, number of rollbacks, line expiration by double breakout. Correct, drag or delete the lines and interactively tune the line system. https://youtu.be/EJUo9pYiHFA . Chart examples https: //www.mql5.com/en/users/efficientforex Price Interaction Events All events are effective immediately and only after one
FFx MACD Divergences
Eric Venturi-Bloxs
The purpose of this new version of the MT4 standard indicator provided in your platform is to display in a sub-window multiple timeframes of the same indicator with its divergences. See the example shown in the picture below. But the display isn't like a simple MTF indicator. This is the real display of the indicator on its timeframe. Here's the options available in the FFx divergences indicator: Select the timeframes to be displayed (M1 to Monthly) Define the width (number of bars) for each tim
FFx RSI Divergences
Eric Venturi-Bloxs
The purpose of this new version of the MT4 standard indicator provided in your platform is to display in a sub-window multiple timeframes of the same indicator with its divergences. See the example shown in the picture below. But the display isn't like a simple MTF indicator. This is the real display of the indicator on its timeframe. Here's the options available in the FFx divergences indicator: Select the timeframes to be displayed (M1 to Monthly) Define the width (number of bars) for each tim
FFx CCI Divergences
Eric Venturi-Bloxs
The purpose of this new version of the MT4 standard indicator provided in your platform is to display in a sub-window multiple timeframes of the same indicator with its divergences. See the example shown in the picture below. But the display isn't like a simple MTF indicator. This is the real display of the indicator on its timeframe. Here's the options available in the FFx divergences indicator: Select the timeframes to be displayed (M1 to Monthly). Define the width (number of bars) for each ti
The FFx Dashboard MTF alerter will show you on a single chart all the timeframes (M1 to Monthly) with their own status for the indicator. 2 Alert Options: Single timeframe: each selected timeframe alert separately when a signal occurs Multi timeframes: all selected timeframes must agree for an alert to be triggered Both options have an input to select the timeframes to be used for the alert(s). How to Understand the Status: Green/Red square: histogram above/below 0 line Green square + Red bord
The FFx Dashboard MTF alerter will show you on a single chart all the timeframes (M1 to Monthly) with their own status for the indicator. 2 Alert Options: Single timeframe: each selected timeframe alert separately when a signal occurs Multi timeframes: all selected timeframes must agree for an alert to be triggered Both options have an input to select the timeframes to be used for the alert(s). How to understand the status: Green/Red square: RSI above/below 50 line Green square + Red border: R
The FFx Dashboard MTF alerter will show you on a single chart all the timeframes (M1 to Monthly) with their own status for the indicator. 2 Alert Options: Single timeframe: each selected timeframe alert separately when a signal occurs Multi timeframes: all selected timeframes must agree for an alert to be triggered Both options have an input to select the timeframes to be used for the alert(s). How to understand the status: Green/Red square: Stoch above/below 50 line Green square + Red border:
The FFx Dashboard MTF alerter will show you on a single chart all the timeframes (M1 to Monthly) with their own status for the indicator. 2 Alert Options: Single timeframe: each selected timeframe alert separately when a signal occurs Multi timeframes: all selected timeframes must agree for an alert to be triggered Both options have an input to select the timeframes to be used for the alert(s). How to understand the status: Green/Red square: Price above/below Cloud (Kumo) Green square + Red bo
The FFx Dashboard MTF alerter will show you on a single chart all the timeframes (M1 to Monthly) with their own status for the indicator. 2 Alert Options: Single timeframe: each selected timeframe alert separately when a signal occurs Multi timeframes: all selected timeframes must agree for an alert to be triggered Both options have an input to select the timeframes to be used for the alert(s). How to understand the status: Green/Red square: MA pointing Up/Down Green square + Red border: MA po
The FFx Dashboard MTF alerter will show you on a single chart all the timeframes (M1 to Monthly) with their own status for the indicator. 2 Alert Options: Single timeframe: each selected timeframe alert separately when a signal occurs. Multi timeframes: all selected timeframes must agree for an alert to be triggered. Both options have an input to select the timeframes to be used for the alert(s). How to understand the status: Green square: Price above PSAR Red square: Price below PSAR Options
The FFx Dashboard MTF alerter will show you on a single chart all the timeframes (M1 to Monthly) with their own status for the indicator. 2 Alert Options: Single timeframe: each selected timeframe alert separately when a signal occurs Multi timeframes: all selected timeframes must agree for an alert to be triggered Both options have an input to select the timeframes to be used for the alert(s). How to understand the status: Green/Red square: CCI above/below levels (ie. 100/-100) Grey square: C
The FFx Dashboard MTF alerter will show you on a single chart all the timeframes (M1 to Monthly) with their own status for the indicator. 2 Alert Options: Single timeframe: each selected timeframe alert separately when a signal occurs Multi timeframes: all selected timeframes must agree for an alert to be triggered Both options have an input to select the timeframes to be used for the alert(s). How to understand the status: Green/Red square: ADX above level Grey square: ADX below level Red bor
The FFx Dashboard MTF alerter will show you on a single chart all the timeframes (M1 to Monthly) with their own status. 2 Alert Options: Single timeframe: each selected timeframe alert separately when a signal occurs Multi timeframes: all selected timeframes must agree for an alert to be triggered Both options have an input to select the timeframes to be used for the alert(s). How to understand the status: Green/Red square: bullish/bearish candle Options available in the FFx Dashboard Alerter
THE GRAFF III
Antonin Skaryd
The [GRAFF] III manual trading system is based on multiple MetaTrader (MT4) indicators. Together, the entire PACK of GRAFF III indicators makes an advanced trading tool. The system consists of over 20 different custom-built indicators which have been carefully selected and tested in the long term to produce strong and efficient trading signals. The particular indicators are based on different mathematical formulas, so the entire system is calibrated to remove false signals from its own indicator
FFx Universal Strength Meter PRO is more than a basic strength meter. Instead of limiting the calculation to price, it can be based on any of the 19 integrated strength modes + 9 timeframes. With the FFx USM, you are able to define any period for any combination of timeframes. For example, you can set the dashboard for the last 10 candles for M15-H1-H4… Full flexibility! Very easy to interpret... It gives a great idea about which currency is weak and which is strong, so you can find the best pai
A simplistic indicator informing a user on RSI divergence by sending messages to mobile device and email. The indicator draws 2 vertical lines, marking two RSI extrema that formed the divergence. You get the alert, open the charts and make a decision. The indicator does not show past divergences, thus when you attach it to a chart for the first time you see nothing. Graphics and alerts will appear as soon as divergences do. Drop it in Tester to see how it works. Parameters: RSIPeriod - number of
Pan PrizMA CD Phase is an analogue of the МetaТrader 5 indicator , and is an option based on the Pan PrizMA indicator. Details . Averaging by a quadric-quartic polynomial increases the smoothness of lines, adds momentum and rhythm. Extrapolation by the sinusoid function near a constant allows adjusting the delay or lead of signals. The value of the phase - wave status parameter (which is close in meaning to the trigonometric phase or the angle of the radius-vector rotation in the trigonometric p
Green Wall Arrows
Daniel Luchinger
1 (1)
The Name Green Wall : Arrows hits a lot of TP, by changing the idea of non using SL as something bad, but instead use Small TP and a lot of free Margin and Patience. Use micro TP and a lot of Free Margin with this indicator on Forex. It also can be used with Binary Options. This strategy is intended to be traded Manually. This Indicator runs on Open Bar, arrows will delete when price are against it. The only Indicator Parameter is Alerts true/false, all the rest is included inside the code. Arro
Golden Monowave
Ahmed Mohamed Ali
Golden Monowave is monowave indicator, the monowave theory is one of Elliott wave approach and one of most complicate and accurate method. Golden Monowave can shortcut many major steps to identify and describe the monowave. It works on any timeframe and with any trading instrument, including currencies, indices, futures, etc. Input Parameters initial_Bars - set the initial number of bars to calculate. wave_color - select the color of the wave. label_color - select the color of labels. temp_labe
作者的更多信息
Forex MasterMind Algo AI Multiple Trading Are 3 Type Of Trading Strategy   Velocity Trading Breakout Trading Reversal Trading   Velocity Trading Strategy:-                Velocity Trading Strategy Are Longer Then Candle Buy Or Sell Its Same Side More Than Trade. For Example, in Market Are Buy Side Long Candle, The EA Is Buy, Only Fixed Lot Is Working On Strategy  Breakout Trading Strategy:-                   Breakout Trading Strategy Instantly Place Order BuyStop And SellStop, Once Breakout
KingMaker Ultimate Scalper Expert Advisor TimeFrame - 5 Mins Minimum Balance - 200$ Pairs - Major Currency Pairs , Like - EURUSD, GBPUSD, USDJPY .... etc Run Low Spread Forex Broker Or ECN Broker Money Management Adjust Risk Management SafeMode - True/False Setting : You Have Deposit 200$ , Run EA On 2 or 3 Currency Pairs Only  Automatic Increase And Decrease Lot Size 
Master Trend Signal
Pappathi Murugesan
Master Trend Signal Indicator TimeFrame - 15 Mins & More Pairs  - All Forex Currency Pairs , Gold , Silver , Crypto, Stock Once Trend Is UP Cross The Yellow Line, It's Show Colour For Green Once Trend Is Down Cross The Yellow Line, It's Show Colour For Red Easy TO Identify Trend Strength ON Trading For Scalping, Intraday Trading 5 Purchases left & The Price Increases
Golden Scalping & Day Trading Signal Indicator  You Can Enable Or Disable Scalping Signal Option Once Enable For Scalping More Order Signals Option Or Disable For Scalping Option Intraday Signal Option Pairs :   XAUUSD, XAGUSD  - EURUSD, GBPUSD,USDJPY, AUDUSD, USDCAD, BTCUSD , USDCHF, GBPJPY Time Frame : 15 Mins, 30 Mins , 1 Hour  5 Purchases left & The Price Increases
Gold Scalping Pro Signal Indicator Pairs : XAUUSD, XAGUSD, Crude OIL , BTCUSD, ETHUSD, EURUSD, GBPUSD, USDJPY, AUDUSD, USDCHF, GBPJPY Setting : Once Market Are Up And Down Side , The Indicator Are Provide Buy And Sell Order Push Notification Time Frame - 5 Mins, 15 Mins, 1 Hour, 4 Hour Additional : You Have Also Trade Manual , Once Trend Power Is Up , Enter Buy  Or Trend Power is Down, Enter Sell 
Gold Trend Pro Buy & Sell Signal Indicator Pairs : XAUUSD - XAGUSD  - Crude OiL, EURUSD,GBPUSD,USDJPY,AUDUSD,GBPJPY,BTCUSD TimeFrame - 1 Min , 5Min, 15Min  Once All Are Green Bar , And Also Englufing The Candle You Can Enter To Buy Once All Are Red Bar, And Also Engulfing The Candle You Can Entry To Sell And Next Once Change The Bar Colour , You Can Exit The Buy & Sell Order
Super Signal Buy And Sell Indicator Pairs - XAUUSD - XAGUSD - Oil - BTCUSD - EURUSD - GBPUSD - USDJPY - AUDUSD - GBPJPY .... etc TimeFrame - 15Mins - 30Mins - 1Hour - 4Hour - 1Day - 1Week - 1Month   Setting : -  Once Show On Green Arrow And Next Engulfing For Candle You Can Place The Buy Order Once Show For Red Arrow And Next Engulfing For Candle You Can Place The Sell Order Otherwise Please Wait For Conformation Push Notification Alert
筛选:
无评论
回复评论