Length Movement

5

Measures the length of the selected movement in points, shows the duration of the movement, as well as the speed of movement. Outputs the average value of each dimension.
It is designed to calculate the expected target based on typical market movements.
The intended goal will provide information about the ratio of the stop size to the possible profit and will allow you not to open positions with a small expected profit.
It will also help you determine the point at which it is more logical to close a position. 

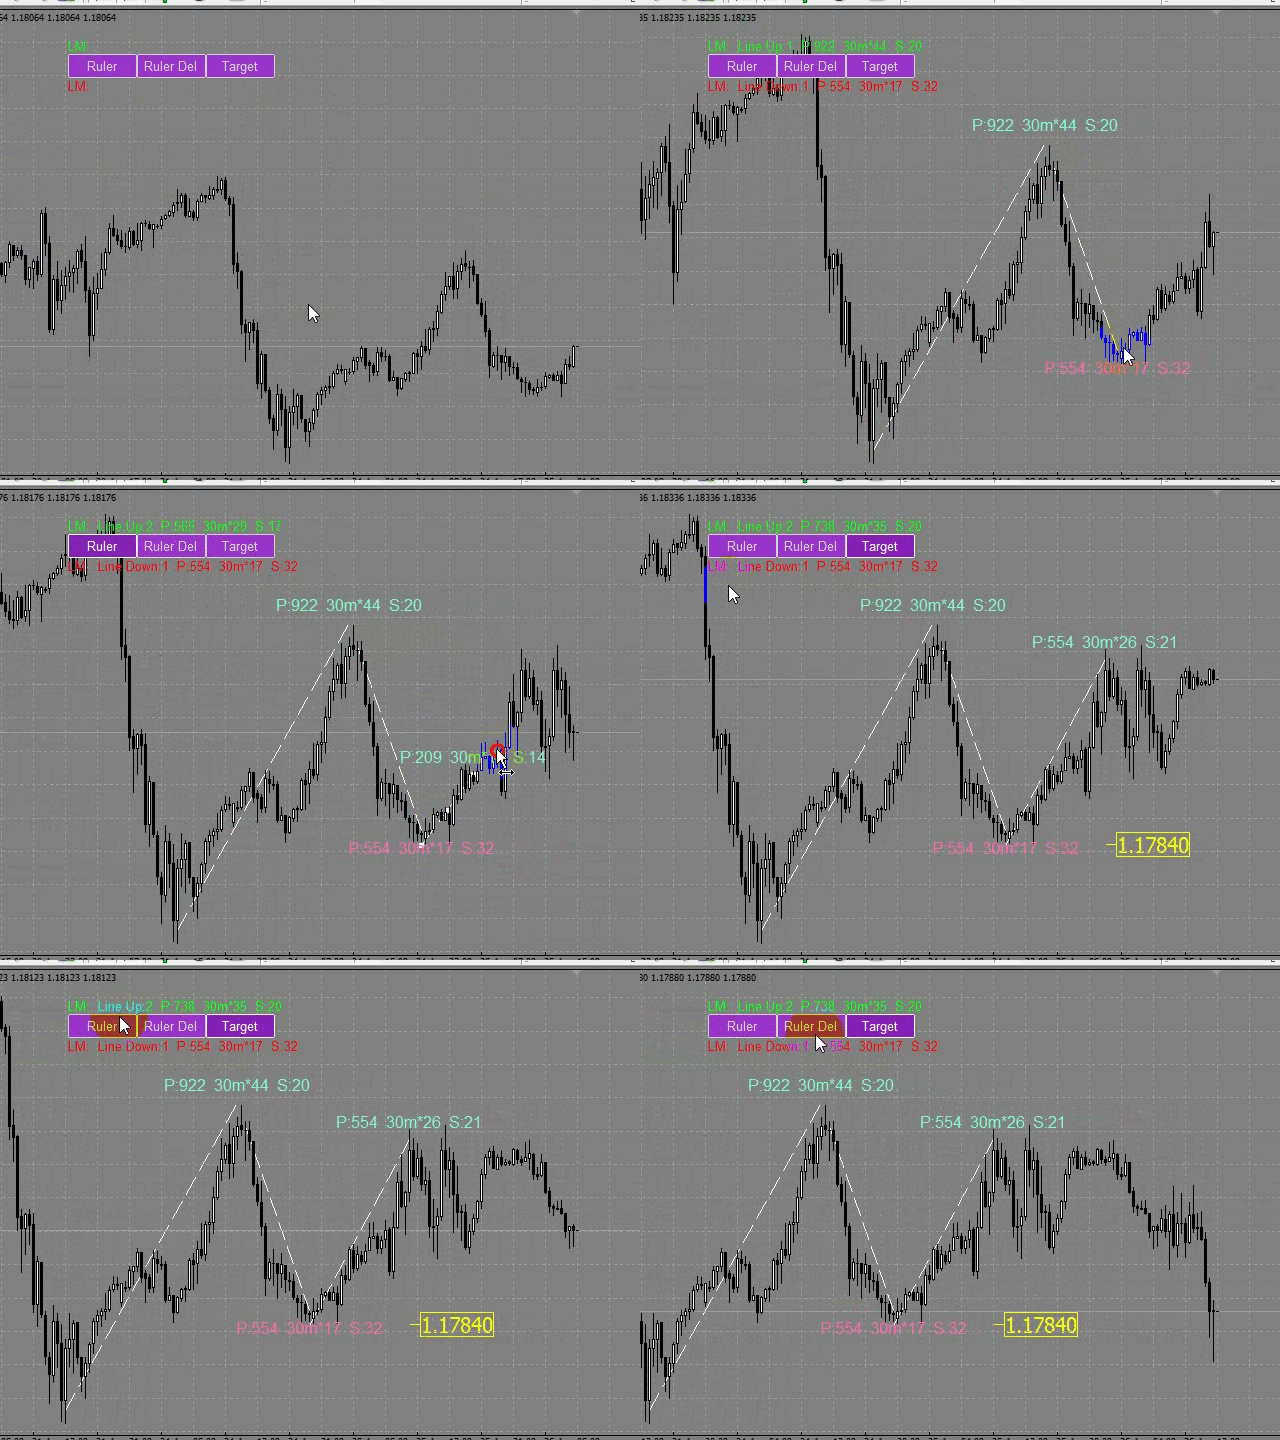
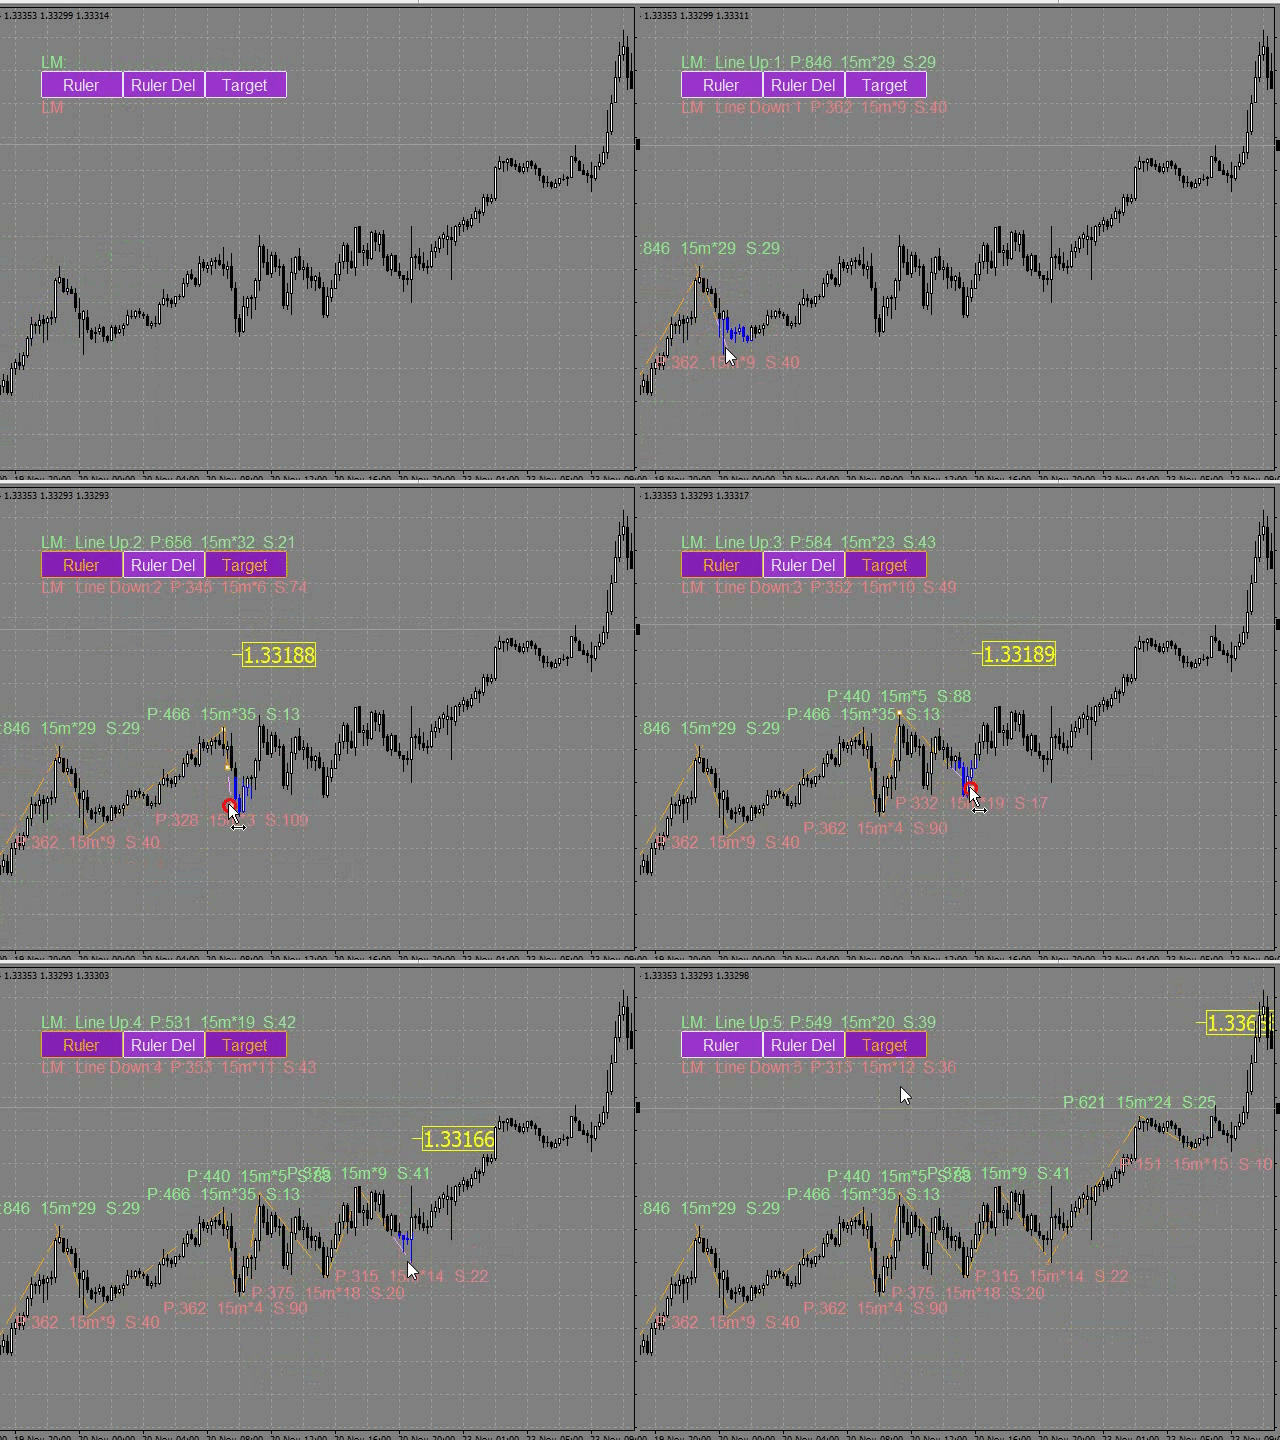
Building a line: click the "Ruler" button and draw a line (clicking the mouse - the first point of the line, where the mouse is released - the second point of the line).
(Lines, text placemarks, and the goal are only visible on the time graph where they were drawn.)

Line changes: select a line and drag it with the mouse.
When you rebuild a line, the value of the text label and the goal (if the goal is enabled) will change immediately.

Delete all measurement lines: click "Ruler_Del". During the number of seconds selected in the "Ruler_Del_Cancel" setting, the "Ruler_Del" button can be clicked to cancel, and the "Ruler_Del" command will be canceled.

Delete the selected measurement lines: select the measurement line and press "delete" on the keyboard. The text label from the measurement line will also be removed, and the goal will change.

Building a goal: the "Target" button sets/deletes a goal. To calculate the goal, you need at least two lines in different directions.

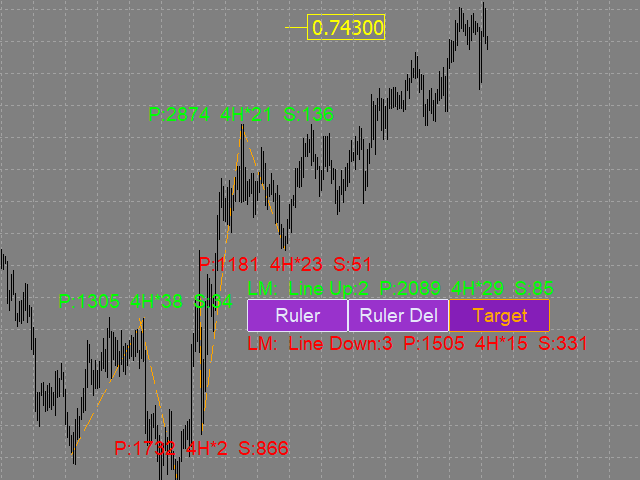
Line_Metrics - Text label of the line.
For example, we have an ascending line with the parameters: P:817 4H*10 S: 81. the line Length is 817 points, the line is drawn on a 4-hour chart, based on 10 candles, (that is, the time of the movement(line) is 40 hours).
The speed of the motion in paragraphs 81. This means that on average, each candle participating in the line construction passed 81 points.

Average_Lines_Metrics - Text label for "average values". LM: Line Up:3 P:1586 4H*40 S: 39 means that the text label of the average value is calculated based on 3 ascending measuring lines Line Up: 3 (measuring lines of 0 points, lines of other time periods and tools are not taken into account in the calculations).
The average line length in points is 1586 points P:1586.
The graph where the lines are counted is 4-hour 4H*40. On average, the line consists of 40 4h*40 candles.
On average, the price passes 39 points S:39 per candle.


The size of buttons and text labels for "average values" depends on the font in the Button_Font setting and its size in the Button_FontSize setting.
On-screen buttons can be dragged with the mouse.
You can assign keyboard shortcuts to on-screen buttons (a-Z, 0-9).


Settings

  • Ruler_key - hotkey for drawing a measuring line (you can assign (a-Z, 0-9)) .
  • Ruler_Del_key - hotkey for deleting all measuring lines (you can assign (a-Z, 0-9)) 
    (measurement lines are deleted after the pause selected in the Ruler_Del_Cancel setting).
  • Target_or_Target_Del_key - hotkey for setting / deleting a goal (a-Z, 0-9)
  • (you need at least two lines in different directions to set a goal).
  • Ruler_Del_Cancel - time to cancel the Ruler_Del_key command (in seconds).
  • Button_Background_Color - buttons background color (if Button_Background_Color=clrNONE, the buttons background is the same as the graph background color).
  • Button_Pressed_Color - color of the text and border of the Ruler button when pressed.
  • Line_Metrics_Indent - indent of the text label from the measuring line (in points).
  • Line_Metrics_Orientation - displays the labels of measuring lines vertically / horizontally / diagonally.
  • Target_Orientation - left-hand / right-hand placemark of the goal.
  • Here are the most important settings. You can also change the following characteristics for measuring lines, buttons, and text labels: color, thickness, font, and font size.
Değerlendirmeler 3
Trader mql5
1325
Trader mql5 2019.04.24 10:15 
 

A very quick and easy way of measuring in points. It is unique and have not found anything like it! Excellent support from Pavel.

Önerilen ürünler
Robot scalper for M5 timeframe. Trades on the GBPUSD currency pair. This robot has been specially developed by a company of professional traders for trading in the pound sterling. The robot approximately opens 5 to 15 trades every day. It is best to trade with brokers that have a low spread on GBPUSD up to 10 pips. The recommended minimum deposit to start is $500 or more. Advantages: does not use martingale. not a net. every trade has a stop loss. professional bot specifically for the GBPUSD p

Currency Trailing Gold , Currency Trailing ’in ücretsiz ve sınırlı bir sürümüdür , işlemlerinizi pips veya puanlara göre değil, gerçek parasal değer üzerinden takip eden akıllı bir kâr kilitleme EA’sıdır. Bu ücretsiz sürüm yalnızca XAUUSD (Gold) üzerinde çalışır ve dünyanın en popüler işlem enstrümanlarından birinde tam trailing deneyimini ücretsiz olarak sunar. Currency Trailing’i tüm sembollerde kullanmak ister misiniz? Tam sürüm , hesabınızdaki tüm Forex paritelerini, metalleri, endeksleri
FREE
v. 1.0 This indicator can show with maximum accuracy up to 1 bar the presence of a Maximum/minimum on the chart, regardless of the timeframe. It has a flexible configuration. You can use either one value on all TF, or you can use your own value on each TF individually. This indicator is already being improved and those who purchase it receive all updates for free. Next, it is planned to display an indication of the strength of the pivot point at each extremum (in % or in color drawing). It wi
RiverScope Lite automatically determines the nearest most important price levels and support and resistance zones in history, it also identifies a large number of price action patterns (the lite version is limited to 10, while the full version has 30+). The support and resistance levels are determined based on an algorithm that calculates and filters the historical values of the price, its movement character, volumes, etc. It displays the current situation, therefore the nearest levels change in
Aurix Neural Edge AI
MARC ALBRECHT SCHMID
4.57 (14)
AURIX Neural Edge – XAUUSD için Uyarlanabilir Nöral Grid Motoru Gerçek zamanlı sonuçlar: https://www.mql5.com/en/signals/2375266 Altın likiditesi üzerinde kalibre edilmiş, mütevazı bakiyelerden itibaren doğru risk ölçeklendirmesi için cent hesaplarda çalışmak üzere tasarlanmıştır. Ne Yapar AURIX iki sinyali aynı anda okur — üst zaman dilimi trend eğilimi (aylık ufuk, dahili olarak kalibre) ve kısa zaman dilimi momentum darbesi (M5 aralık tabanlı impuls). Bir işlem yalnızca her iki giriş uyuşt
FREE
Pass Prop Firm is a high-frequency trading Expert Advisor specifically designed to help traders pass the prop firm evaluation phase (such as the HFT Challenge). With powerful scalping and smart order management logic, this EA aims to hit profit targets quickly and efficiently—ideal for traders seeking to meet demo account goals in record time. MT5 version myfxbook.com/portfolio/pass-prop-firm-mt5/11625306 myfxbook.com/portfolio/pass-prop-firm-mt4/11622480 Currency Pair : Optimized for DE40 (DAX
"Impulses and Corrections 4" is created to help traders navigate the market situation. The indicator shows multi-time frame upward and downward "Impulses" of price movements. These impulses are the basis for determining the "Base" , which is composed of zones of corrections of price movements, as well as "Potential" zones for possible scenarios of price movement. Up and down impulses are determined based on a modified formula of Bill Williams' "Fractals" indicator. The last impulse is always "U
Here   our more valuable tools SMC Trend Trading   ,  Easy SMC Trading  ,  Institutional SMC Architect Volume Analysis Tools  ,  Volume flow Profile  ,  Market volume profile  , FVG with Volume  , Liquidity Heatmap Profile  ,  Volume Spread Analysis       MT5 VERSION   TRADE COPIER Select Role: On the account sending trades, choose Sender (Master Account) . On the account receiving trades, choose Copier (Receiver Account) . Lot Size Mode: Same Lot Size as Master: Ignores multipliers, copies ex
Exp Swing
Vladislav Andruschenko
4.43 (63)
Swinger (Pendulum, Cheburashka) adı verilen ünlü bir stratejinin modelini kullanır - bekleyen emirlerin artan lotla alternatif olarak yerleştirilmesi. Strateji iki zıt bekleyen emrin verilmesinde yatmaktadır. Fiyat belirli bir yönde hareket ettiğinde bekleyen bir emir tetiklenirken diğer emrin lot büyüklüğü artar. EA, üç tür bekleyen açılış emri sağlar (TypeofTrade) Yerleştirme sonrası otomatik açılma (Anlık açılış AutoTrade) Manuel açma sonrası açma ve yönetim (Manuel açma ManualTrade) Yüksek/
FREE
Chinetti pip collector XL is a complete turnkey trading system. If a trader does not yet have his own trading system, he can apply Chinetti pip collector XL to trading. Trading with this indicator is very easy. Even a beginner in Forex can handle it. Trading rules: wait for the indicator to start drawing a blue line. This means that the price trend is starting now. Now we are waiting for the indicator to analyze the market and draw an up arrow on the chart. At this point, we open a buy order.
Kullanım talimatları: https://www.mql5.com/zh/blogs/post/754946 MT4 sürümü: https://www.mql5.com/zh/market/product/88205 MT5 sürümü: https://www.mql5.com/zh/market/product/88204 -------------------------------------------------- 1. 12 ana hesaptan 100 bağımlı hesaba siparişleri kopyalayın. Köle hesapların sayısı 12'den 100'e kadar özelleştirilebilir. 2. MT4'ten MT4'e, MT4'ten MT5'e, MT5'ten MT4'e, MT5'ten MT5'e destek. 3. EURUSD, EURUSDm, EURUSDk gibi farklı platformlardaki alım satım çeşitleri
ICT Phantom Trader
Mazhar Ul Hassan Noorul Hassan Noor Ul Hassan
ICT Phantom Trader is a professional-grade trading algorithm that leverages Inner Circle Trader (ICT) Engulfing Patterns and institutional trading strategies. It is designed for traders who follow Smart Money Concepts (SMC), focusing on liquidity, order blocks, and price action confirmation. Previously priced at $100 per month , all my bots are now available for a limited-time promotion at just $ 36 per month. Features & Functionalities: ICT Engulfing Pattern Detection – Identifies high-probab
VR Grid
Vladimir Pastushak
5 (3)
VR Izgara göstergesi, kullanıcı tanımlı ayarlarla grafiksel bir ızgara oluşturmak için tasarlanmıştır . Standart ızgaradan farklı olarak, VR Izgarası dairesel seviyeler oluşturmak için kullanılır. Kullanıcının seçimine bağlı olarak tur seviyeleri arasındaki adım isteğe bağlı olabilir. Ek olarak, diğer göstergeler ve yardımcı programlardan farklı olarak VR Grid, zaman dilimi değiştiğinde veya terminal yeniden başlatıldığında bile ızgaranın konumunu korur . Ayarlar, set dosyaları, demo versiyonlar
FREE
Here   our more valuable tools SMC Trend Trading   ,  Easy SMC Trading  ,  Institutional SMC Architect Volume Analysis Tools  ,  Volume flow Profile  ,  Market volume profile  , FVG with Volume  , Liquidity Heatmap Profile  ,  Volume Spread Analysis Trend Identification: Look for the color change. When candles turn Green , look for Buy opportunities. When they turn Red , look for Sell opportunities. Entry: Enter on the break of the trend line or on the pullback to the line. Stop Loss: Use the
Trade with Gann on your side!! MASTER CIRCLE 360 CIRCLE CHART, originally created by Gann admitted that this is “The Mother of all charts”. It is one of the last studies that this great trader left for us. The numeric tab le is apparently quite simple like all the tables and is based on square numbers, the SQUARE OF 12 and is by evolution, one of the most important square numbers. Here we can find CYCLE, PRICE AND TIME thanks to angles and grades, to show past and future support and resistance.
Day Pattern
Oleksandr Martsynyshen
Description: - D ay Pattern - an indicator that helps to identify patterns of price changes for the development of trading algorithms and strategies. For whom this tool? - For developers of trading strategies and algorithms. - Medium- and long-term traders. Time frames H1-W1. Features of the indicator: - There is a function of exporting indicator values to a file of the csv format. - Using the information panel, you can conduct an express analysis of trading tool. - The indicator is sui
Volume Confirm Trend Zone is the indicator for filtering sideways and confirm trend to help your system trading. Indicator can use every currency pairs, every time frame, and every broker. You can see trend zone when color to change in volume indicator. Features When the color changes to the blue: Buy Zone is a strong trend. When the color changes to the red: Sell Zone is a strong trend.
Introduction It is common practice for professional trades to hide their stop loss / take profit from their brokers. Either from keeping their strategy to the themselves or from the fear that their broker works against them. Using this indicator, the stop loss / take profit points will be drawn on the product chart using the bid price. So, you can see exactly when the price is hit and close it manually.  Usage Once attached to the chart, the indicator scans the open orders to attach lines for t
Day By Day
Maksim Neimerik
Day By Day Требования к использованию советника: Для работы даного советника никакие требования не предусмотрены! Советник представляет собой систему, которая работает по сигналам индикатора RSI. Работает советник по времени терминала с 10:00 по 10:20, это значит что в это время он пытается войти в рынок, если по истечении этого времени войти не удается - ждет следующего дня. Рекомендуемая валюта: EURUSD, USDJPY; Таймфрейм : H1; Мониторинг:   https://www.mql5.com/ru/signals/557506 Оптимальные на
Description: Please tick "Show object descriptions" in chart properties to enable hrays views That utility converts a trendline into a horizontal ray known as tool for drawing supply and demand zones. Simply create a trendline on a chart and once selected, it will get converted. Ray remains horizontal while dragging.  Quick ray plot: press "R" key to create horizontal ray. It will be snapped to the nearest OHLC value Further versions will be improved. For feature request please post new comm
Money Flow Profile MT5 HERE   Here   our more valuable tools SMC Trend Trading   ,  Easy SMC Trading  ,  Institutional SMC Architect Volume Analysis Tools  ,  Volume flow Profile  ,  Market volume profile  , FVG with Volume  , Liquidity Heatmap Profile  ,  Volume Spread Analysis This Master Edition is engineered for clarity and speed, featuring a unique Auto-Theme Sync system that instantly beautifies your chart layout upon loading. Key Features: True Money Flow Calculation: Goes beyond stand
Displays the local time with the time difference you set. (It does not correspond to the time difference in 30-minute increments.) It also displays a price line with a good price, such as 100.000 .100 or .200. The standard gridlines are displayed with the time and price by MT4, but they are very confusing as they become the broker's time and are displayed at the halfway point along with the price. It hides them and displays gridlines at user-defined time differences and prices in easy-to-unders
Phase Analytics Pro: Advanced Cyclic Market Analyzer Phase Analytics Pro is a sophisticated technical tool designed for traders who prioritize mathematical precision over lag-heavy traditional indicators. Based on the principles of digital signal processing, this indicator decomposes price action into phase and quadrature components to identify the dominant market cycle. How it works: The algorithm calculates the instantaneous phase of the market, allowing it to distinguish between trending and
GoldenTrend
Aliaksandr Sych
GoldenTrend — a next-generation high-frequency scalping Expert Advisor designed to extract profit from the smallest market movements. Utilizing advanced algorithms for price action and volume analysis, it opens dozens of highly accurate trades daily with minimal risk. Why GoldenTrend? Монитор Ultra-Fast Trades : Captures profit from 5–15 pip movements. Ideal for ECN accounts with low spreads. Adaptive Strategy : Automatically adjusts to current market volatility and dynamically shifts tradi
Professional Opening Range Breakout (ORB) indicator designed for precision session trading with automatic time handling, breakout alerts, and advanced target levels. This indicator automatically identifies the Opening Range for any configurable session, plots the High, Low, and Midpoint levels, and extends them across the trading day. Built-in breakout detection and alerts, range measurements, and extension targets provide traders with clear structure and actionable levels. Ideal for traders usi
Simple Customizable Trade Panel — Fast and Easy One-Click Trading This lightweight and powerful panel is built for traders who value speed , simplicity , and full customization . With just one click, you can: Buy or Sell instantly Close all open positions Place pending orders with custom distance Delete all pending orders Adjustable parameters: • Lot size • Stop Loss (in points) • Take Profit (in points) • Distance to price for pending orders The panel is fully responsive and adaptab
Pairs synthetique mt4
Vincent Albert Feugier
Pairs Synthetic Pro (Synthetic Pairs & Spread) Master Correlation Trading Correlation trading and statistical arbitrage are now within your reach thanks to the Pairs Synthetic Pro indicator. This tool goes beyond simple ratio analysis, acting as a specialized radar for detecting price imbalances between two assets to anticipate market corrections. For example, when Brent rises while WTI lags, the price spread widens. Our indicator, integrated with adaptive Bollinger Bands, identifies when this d
Rua TrailingStop BreakEven Little
PHAM KIM QUY RuaCoder
4.5 (2)
Rua TrailingStop BreakEven Little The EA not for Real Account. You can EA for Real Account with link:   https://www.mql5.com/en/market/product/47635 Uses of EA - Trailingstop: Move stoploss continuously. - Breakeven: Move the stoploss once. Custom parameters: All OrderOpenTime:     + true: acts on all order     + false: only affect the order opened since EA run All OrderType:     + true: acts on all order.     + false: only the order is running (Buy, Sell) TraillingStop: true (Use), false (do n
FREE
Blahtech Market Profile
Blahtech Limited
4.53 (15)
Was: $249  Now: $99   Market Profile defines a number of day types that can help the trader to determine market behaviour. A key feature is the Value Area, representing the range of price action where 70% of trading took place. Understanding the Value Area can give traders valuable insight into market direction and establish the higher odds trade. It is an excellent addition to any system you may be using. Blahtech Limited presents their Market Profile indicator for the MetaTrader community. Ins
Quantum Currency Strength Indicator
QUANTUM TRADING SOFTWARE LIMITED
Your success as a forex trader depends on being able to identify when a currency or currency pair is oversold or overbought. If it is strong or weak. It is this concept which lies at the heart of forex trading. Without the Quantum Currency Strength indicator, it is almost impossible. There are simply too many currencies and too many pairs to do this quickly and easily yourself. You need help! The Quantum Currency Strength indicator has been designed with one simple objective in mind. To give you
Bu ürünün alıcıları ayrıca şunları da satın alıyor
Trade Manager EA’ye hoş geldiniz! Ticaretin daha sezgisel, hassas ve verimli hale gelmesi için tasarlanmış nihai risk yönetim aracı ile tanışın. Bu sadece bir emir verme aracı değil; ticaret planlaması, pozisyon yönetimi ve risk kontrolü için kapsamlı bir çözüm. İster yeni başlayan bir yatırımcı olun, ister deneyimli bir trader ya da hızlı emir gerektiren bir scalper, Trade Manager EA ihtiyaçlarınıza uyum sağlar ve forex, endeksler, emtialar ve kripto paralar dahil tüm piyasalarda esneklik sunar
Effortlessly calculate lot sizes and manage trades to save time and avoid costly errors The Trade Pad Pro EA is a tool for the Metatrader Platform that aims to help traders manage their trades more efficiently and effectively. It has a user-friendly visual interface that allows users to easily place and manage an unlimited number of trades, helping to avoid human errors and enhance their trading activity. [ Installation Guide | Update Guide | Troubleshooting | FAQ | All Products ] One of the k
Manuel işlem için profesyonel bir panel: işlemin tüm döngüsü, hassas girişten hesabınızı korumaya kadar, grafik üzerindeki tek bir pencerede toplanır. Her pozisyonun lotunu tam olarak belirlediğiniz riske göre hesaplayın; RR Tool ile işlemi doğrudan grafik üzerinde çizgilerle kurun; piyasa emirleri, bekleyen emirler, gridler ve OCO emirleri açın. Pozisyon yönetimini panel üstlenir: beş seviyeye kadar kısmi kapatma, altı tür trailing stop, maliyetine çekme ve Virtual SL/TP. Günlük, haftalık ve ay
The product will copy all telegram signal to MT4   ( which you are member  ) , also it can work as remote copier.  Easy to set up, copy order instant, can work with almost signal formats, image signal, s upport to translate other language to English Work with all type of channel or group, even channel have "Restrict Saving Content", work with  multi channel, multi MT5 Work as remote copier: with signal have ticket number, it will copy exactly via ticket number. Support to backtest signal. How to
Strategy Builder offers an incredible amount of functionality. It combines a trade panel with configurable automation (covert indicators into an EA), real-time statistics (profit & draw down) plus automatic optimization of SL, TP/exit, trading hours, indicator inputs. Multiple indicators can be combined into an single alert/trade signal and can include custom indicators, even if just have ex4 file or purchased from Market. The system is easily configured via a CONFIG button and associated pop-up
TradeMirror, MT4/MT5 platformları için geliştirilmiş, gerçek zamanlı işlem senkronizasyonu destekleyen yerel bir emir kopyalama aracıdır. Eğitim Daha fazla eğitim görmek için lütfen Trademirror Eğitimi bağlantısına tıklayın. Ürün Avantajları Finansal yazılımlar için güvenlik, istikrar ve gizlilik standartlarına uygun olarak üç temel alanda iyileştirme yapılmıştır: Kullanıcı dostu arayüz ile kolay kullanım Finansal senaryolarda hassas veri izolasyonu için gelişmiş gizlilik koruması Milisanlık emi
Custom Alerts AIO: Tüm Piyasaları Takip Et — Hiçbir Kurulum Gerekmez Genel Bakış Custom Alerts AIO , hiçbir ek yapılandırma gerektirmeyen, kullanıma hazır bir piyasa izleme çözümüdür. Gerekli tüm göstergeler — FX Power, FX Volume, FX Dynamic, FX Levels, IX Power — iç yapısına gömülüdür. Grafik görüntülemesi olmadan çalışır, bu da onu sessiz ve verimli bir şekilde gerçek zamanlı alarm üretimi için mükemmel hale getirir. Brokerınızın sunduğu tüm varlık sınıflarını destekler: Forex, Metaller, End
EASY Insight AIO – Akıllı ve zahmetsiz yatırım için hepsi bir arada çözüm Genel Bakış Tüm piyasayı — Forex, Altın, Kripto, Endeksler ve hatta Hisseler — saniyeler içinde, manuel grafik incelemesi, gösterge kurulumu ya da karmaşık ayarlar olmadan analiz edebildiğinizi hayal edin. EASY Insight AIO , yapay zekâ destekli yatırım için nihai, kullanıma hazır dışa aktarma aracınızdır. Tüm piyasanın kapsamlı bir anlık görüntüsünü tek bir temiz CSV dosyasında sunar; bu dosya ChatGPT, Claude, Gemini, Pe
Unlimited Trade Copier Pro is a tool to copy trade remotely to multiple MT4, MT5 and cTrader accounts at different computers/locations over internet. This is an ideal solution for you if you are a signal provider and want to copy your trades to other receivers globally on your own rules. One provider can copy trades to multiple receivers and one receiver can get trade from multiple providers as well. The provider can even set the subscription expiry for each receiver, so that receiver will not b
THIS EA IS A SEMI-AUTO EA, IT NEEDS USER INPUT. Manual & Test Version Please TEST this product before   BUYING  and watch my video about it. Contact me for user support or bug reports, or if you want the MT5 version! MT5 Version I do not guarantee any profits or financial success using this EA. With this Expert Advisor, you can: Implement your own   Zone Recovery   strategy to capitalize on trending markets. Create   Grid   trading strategies, to profit from ranging markets. Place orders easil
Smart Channel M4
Vahidreza Heidar Gholami
The trend in the market can be predicted using trend lines but the problem is you don’t know where exactly the price is going to touch the trend line where you can put your pending orders on. Smart Channel Expert Advisor makes it possible to put an advanced channel around the price data, which can be configured to handle placing orders, opening and closing positions, managing risk per trade, spread, slippage, and trailing stop-loss and take-profit automatically. Features Money Management (Calcul
Local Trade Copier EA , bir MAM veya PAMM hesabına ihtiyaç duymadan, harici kaynaklardan ticaret sinyalleri yürütmesi veya aynı anda birkaç hesabı yönetmesi gereken bireysel tüccarlar veya hesap yöneticileri için bir çözümdür. 8 ana hesaptan sınırsız bağımlı hesaba kopyalar [ Kurulum Kılavuzu | Güncelleme Kılavuzu | Sorun Giderme | SSS | Tüm Ürünler ] %100 kendi kendine barındırılan Kurulumu ve kullanımı kolay Hiçbir yükleyici, yapılandırma dosyası, sunucu, bellek kanalı veya DLL kullanılmadı E
This EA Utility allows you to manage (with advanced filtering) unlimited open orders (manual or EA) with 16 trailing stop methods: fixed, percent, ATR Exit, Chandelier Exit, Moving Average, Candle High Low Exit, Bollinger Bands, Parabolic, Envelope, Fractal, Ichimoku Kijun-Sen, Alligator, Exit After X Minutes or Bars, RSI and Stochastic. The trailing stop can be either real or virtual, and you can exit fully or with a partial close percent on touch or bar close.  Moreover, you can add (overrid
Riskless Pyramid
Snapdragon Systems Ltd
5 (1)
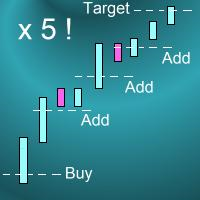
Introduction This powerful MT4 trade mangement EA offers a way potentially to aggressively multiply trade profits in a riskfree manner. Once a trade has been entered with a defined stoploss and take profit target then the EA will add three pyramid add-on trades in order to increase the overall level of profit. The user sets the total combined profit target to be gained if everything works out. This can be specified either as a multiple of the original trade profit or as a total dollar amount. Fo
MultiOrder Assistent V3.0   - Your professional trading assistant for MetaTrader 4 The  MultiOrder Manager  is a powerful trading tool designed to optimize your trading while managing risk efficiently. With intuitive features and a user-friendly interface, this Tool is ideal for traders who want to manage multiple orders simultaneously without losing track.   Symbols: FX pairs, gold and cryptocurrencies Here you get a detailed description of the parameters and functions Manual     Features and
The Expert Advisor will help you forward all pop-up alert with screenshot from  MetaTrader 4 to Telegram channel/ group, also forward all notifications to Telegram. Parameters  -  Telegram Bot Token - create bot on Telegram and get token.  -  Telegram Chat ID  - input your Telegram user ID,  group / channel ID  -  Forward Alert - default true, to forward alert.  -  Send message as caption of Screenshot - default false, set true to send message below Screenshot  How to setup and guide  - Telegram
Crystal Trade Manager PRO – MT4 İçin Gelişmiş Risk Yönetimi ve İşlem Kontrol Sistemi Ücretsiz Sürüm: https://www.mql5.com/en/market/product/150632 Genel Bakış Crystal Trade Manager PRO (CTM), MetaTrader 4 için geliştirilmiş profesyonel bir işlem yürütme ve risk yönetimi aracıdır. Disiplinli işlem yürütme, güçlü sermaye koruması ve MT4 içinde akıllı otomasyon isteyen trader’lar için tasarlanmıştır. Sistem; riski yönetir, equity’yi korur, günlük sınırları uygular, SL/TP’yi otomatik ayarlar ve prof
Time saving and fast execution Whether you’re traveling or sleeping, always know that Telegram To Mt4 performs the trades for you. In other words, Our   Telegram MT4 Signal Trader  will analyze the trading signals you receive on your selected Telegram channels and execute them to your Telegram to MT4 account. Reduce The Risk Telegram To Mt4   defines the whole experience of copying signals from   Telegram signal copier to mt4 platforms. Users not only can follow all instructions from the signa
If you need an advisor on any arrow indicator signals - this utility will definitely help you.  You will be able, with the help of this utility to form an unlimited number of EAs on YOUR signals , with your set of settings, with your copyright and complete source code . You will be able to use the resulting EAs unlimitedly , including adding them to the Market and other resources. Free simple version of the generation script to help you understand how it works - here What does the utility do? 
The product will copy all  Discord  signal   to MT4   ( which you are member  ) , also it can work as remote copier.  Easy to set up. Work with almost signal formats, support to translate other language to English Work with multi channel, multi MT4. Work with Image signal. Copy order instant, auto detect symbol. Work as remote copier: with signal have ticket number, it will copy exactly via ticket number. How to setup and guide: Let read all details about setup and download Discord To MetaTrader
EchoTrade Telegram to MT5 Copier Seamless, Instant, and Reliable Signal Copying - Direct from Telegram to MetaTrader 4! The product does not run in the strategy tester but you can get free trial version   here  for testing before purchase. Tired of manually executing trades from Telegram signals? EchoTrade automates the process, instantly copying trades from any Telegram channel or group directly into your MT5 account—accurately, efficiently, and without delay. Key Features: Universal Compatib
Dashboard.mq4 - Basit Ticaret Yöneticisi Manuel ticaretten hoşlanan ve işlemleri yönetmeyi basitleştirecek bir araca ihtiyaç duyanlar için tasarlanmış bu güçlü MQL4 aracı, işlemlerinizi yönetmek için gerçek zamanlı bir gösterge paneli sağlayarak ticaret verimliliğini artırır. MetaTrader'a sorunsuz bir şekilde entegre olur, lot boyutlarını hesaplar ve risk metriklerini zahmetsizce takip eder. Ana Özellikler: Risk ve Marj Görüntüleme : Lot boyutları, marj gereksinimleri ve başarı oranlarını doğru
Auto Trade Driver is an automatic powerful tool (run as Expert Advisor) that helps you to manage risk and control orders and maximize your profit in multi-protect/trailing-stop rules. This tool is very useful for both scalpers and trend followers. It not only calculates the trade risk exactly, but also protects and maximizes your profits in real-time. With this tool, the only thing you have to do is to enter trade by your own strategy, then it will auto-drive your position with exit strategy you
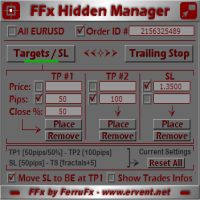
The FFx Hidden Manager panel will help you to manage easily your orders directly on the chart. Below all features described: TP, SL and TrailingStop are hidden Each order has its own lines on chart Drag & Drop any line to change the TP/SL as per your need Option to move automatically the SL line at breakeven when TP #1 is reached Option to choose the TP/SL type (by pips or price) Option to choose the TrailingStop type (by pips, MA, Fractals, PSAR or ATR) Define which order(s) you want to manage
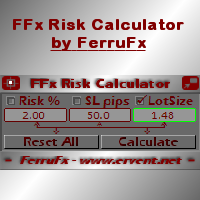
FFx Risk Calculator panel will help you to calculate very easily your trades size, SL or the risk directly on the chart. All features are described below: Option to select which parameter to calculate: Risk, Stop Loss or Lot Size The panel will show if the lot size is allowed according to the current account free margin Button to maximize/minimize the panel Drag and Drop the panel anywhere on the chart How to use it? Select the parameter you want to be calculated. It will be based on the 2 other
Trade Copier Pro is a tool to copy trade remotely to MT4, MT5 and cTrader accounts at different computers/locations over internet. This is an ideal solution for you if you are a signal provider and want to copy your trades to other receivers globally on your own rules. One provider can copy trades to multiple receivers and one receiver can get trade from multiple providers as well. The provider can even set the subscription expiry for each receiver, so that receiver will not be able to receive t
News Trader Pro is a unique robot that allows you to trade the news by your predefined strategy. It loads every piece of news from several popular Forex websites. You can choose any news and preset the strategy to trade it, and then News Trader Pro will trade that news by selected strategy automatically when the news comes. News release gives opportunity to have pips since the price usually has big move at that time. Now, with this tool, trading news becomes easier, more flexible and more exciti
The FFx Watcher PRO is a dashboard displaying on a single chart the current direction of up to 15 standard indicators and up to 9 timeframes. It has 2 different modes: 1. Watcher mode: Multi Indicators User is able to select up to 15 indicators to be displayed User is able to select up to 9 timeframes to be displayed 2. Watcher mode: Multi Pairs User is able to select any number of pairs/symbols User is able to select up to 9 timeframes to be displayed This mode uses one of the standard indicat
THE [VIZUALIZER] is a MetaTrader (MT4) Script designed to visualize an account history. It will read the account statement and then will visualize the positions on chart in form of rectangles, showing the OpenTime, OpenPrice, CloseTime and ClosePrice. Generally, it has been developed to analyze the trading history, to observe how risky the particular positions were, allowing you to analyze the trading strategy from the account statement. It is working with standard MS Excel CSV files It is visua
This is a must have tool for a serious trader. It saves your precious time spent for opening/closing trades, creating pending trades and modifying your TP/SL in bulk according to either pips or price. If you need to quickly open several pending orders (Buy Stop, Sell Stop) at a certain distance from each other, this script will do all the routine for you! The first time you use this handy tool, you will realize it has already paid for itself. Instructions: Drag and drop this script onto a chart.
Yazarın diğer ürünleri
The trading system is designed to work with gold on time periods: 30M, 1H. The indicator allows you to adjust to the market situation. Parameters for 1H :   PERIOD=9F ,   FILTER=300 .   Parameters for  30M :   PERIOD=22B ,   FILTER=450 .     A small adjustment to a specific broker is allowed .   If you change the amount of history displayed, you may also need to adjust the parameters. The indicator is not redrawn.     "Gold n XAU" uses different rules for entering a trade and different rules
The indicator draws support and resistance lines on an important part of the chart for making decisions. After the trend line appears, you can trade for a breakout or rebound from it, as well as place orders near it. Outdated trend lines are deleted automatically. Thus, we always deal with the most up-to-date lines. The indicator is not redrawn . Settings: Size_History  - the size of the calculated history. Num_Candles_extremum  - the number of candles on each side of the extremum. Type_Arrow
Ichimoku Map (instant look at the markets) - built on the basis of the legendary Ichimoku Kinko Hyo indicator. The task of the Ichimoku Map is to provide information about the market strength on the selected time periods and instruments, from the point of view of the Ichimoku indicator. The indicator displays 7 degrees of buy signal strength and 7 degrees of sell signal strength. The stronger the trend, the brighter the signal rectangle in the table. The table can be dragged with the mouse. The
Turn
Pavel Verveyko
The indicator shows the market turning points (entry points). Reversals allow you to track rebound/breakout/testing from the reverse side of the lines of graphical analysis or indicators. Reversals can be an independent signal. The indicator allows you to determine reversals taking into account the trend and without it. You can choose a different period for the movement preceding the reversal, as well as the volatility coefficient. When plotting reversals, the indicator takes into account volati
The indicator allows you to quickly switch from one instrument to another, from one time period to another using the keyboard or buttons on the monitor. Each command can be assigned a hot key from 0-9, a-Z (case-insensitive) and VK_OEM_COMMA ("<" on the keyboard) and VK_OEM_PERIOD (">" on the keyboard). This can help you to operate the maximum number of instruments that are available at your broker, analyze more instruments/periods in less time. This product cannot be tested in the tester , beca
This indicator allows you to measure the profitability of each specific transaction (the ratio of Stop and Profit). The indicator allows you to adjust the ratio by step size and number of steps. You can build an unlimited number of ratios to compare the risks from different movements. Note: in MT4, the number of horizontal lines in a single ratio cannot exceed 32. Building a line : click the " Ratio " button and draw a line (mouse click - the first point of the line, where the mouse is release
The script displays info about the share's corporate reports and dividends. The data is downloaded from   investing.com : Report date Profit per share (EPS) Revenue Market capitalization Amount of dividends Date of payment of dividends Dividend income The product cannot be tested in the tester (since it is not possible to receive data from the Internet). Before launching:  Add 2   URL   https://ru.investing.com/earnings-calendar/Service/getCalendarFilteredData  and   https://ru.investing.com/di
The Envelopes indicator determines the presence of a trend or flat. It has 3 types of signals, shows the probable retracement levels and levels of the possible targets. The Fibonacci coefficients are used in the indicator's calculations. Signals (generated when touching the lines or rebounding from lines): Trend - the middle line of the Envelopes has a distinct inclination; the lines below the channel's middle line are used for buy trades, the lines above the middle line and the middle line itse
Mr Big
Pavel Verveyko
The indicator shows and highlights the chart candles, which are formed as a result of large players entering the market in large volumes. Such candles can also be formed after achieving a certainty on the market, when most of the participants hold positions in the same direction. The movement is likely to continue in that direction after such candles. The indicator highlights the significant candles from the existing ones on the chart; The indicator allows identifying the trends based on candles
Splash
Pavel Verveyko
The indicator identifies the most suitable moment for entering the market in terms of market volatility, when the market has the strength to move (the signal is indicated by an arrow under the candle). For each of the signals, the presence of trends on the current and higher timeframes is determined, so that the signal is in the direction of the majority of positions opened on the market (denoted near the signal by abbreviations of timeframes with a trend present). The signal appears after the c
The indicator displays the key support and resistance levels on the chart. The significance of these levels lies in that the price may reverse or strengthen the movement when passing such levels, since they are formed as a consequence of the natural reaction of market participants to the price movement, depending on which positions they occupied or did not have time to occupy. The psychology of the level occurrence: there always those who bought, sold, hesitated to enter or exited early. If the
This indicator is a multitimeframe trading strategy. It has the levels for stop loss, take profit and entry point. The order level can also be set manually. The indicator uses the regularity of the market, which manifests itself on all instruments, and does not require adjustment of the parameters. The strategy uses a proprietary approach to determining: trend, volatility, hierarchy of timeframe significance, the size of the history period (the number of candles), which is important for making a
Trend Sync
Pavel Verveyko
5 (1)
The indicator shows the trend of 3 timeframes: higher timeframe; medium timeframe; smaller (current) timeframe, where the indicator is running. The indicator should be launched on a chart with a timeframe smaller than the higher and medium ones. The idea is to use the trend strength when opening positions. Combination of 3 timeframes (smaller, medium, higher) allows the trend to be followed at all levels of the instrument. The higher timeframes are used for calculations. Therefore, sudden change
The indicator detects important peaks and troughs (extremes) on the chart. These points can be used to plot support/resistance levels and trend lines, as well as any other graphical analysis. These points can serve as reference points for setting trading orders. The indicator does not redraw . Settings: Size_History  - the size of the calculated history. Num_Candles_Right  - number of candles to the right of the peak or trough. Num_Candles_Left  - number of candles to the left of the peak or
Running along Lines
Pavel Verveyko
3 (2)
The indicator draws support and resistance lines on an important part of the chart for making decisions. After the trend line appears, you can trade for a breakout or rebound from it, as well as place orders near it. Outdated trend lines are deleted automatically. Thus, we always deal with the most up-to-date lines. The indicator is not redrawn . Settings: Size_History  - the size of the calculated history. Num_Candles_extremum  - the number of candles on each side of the extremum. Type_Arrow
Key Volumes
Pavel Verveyko
1 (1)
The indicator shows key volumes confirmed by the price movement. The indicator allows you to analyze volumes in the direction, frequency of occurrence, and their value. There are 2 modes of operation: taking into account the trend and not taking into account the trend (if the parameter Period_Trend = 0, then the trend is not taken into account; if the parameter Period_Trend is greater than zero, then the trend is taken into account in volumes). The indicator does not redraw . Settings History_S
This trading system is based on market impulses of varying complexity.   To generate a signal, the indicator uses the moments when the direction of the pulse and the necessary section of the trend coincide. The indicator also takes into account the current market volatility. Stop_loss tags can be set with the parameter "0" or "1", then Stop_Loss will take into account market volatility.   Take_Profit tags can be set with the parameter "0", then Take_Profit will take into account market volatil
The stocks that make up the index are one of the drivers of the movement. Analyzing the financial performance of all elements of the index, we can assume further development of the situation. The program (script) displays corporate reports of shares that are part of the index selected in the settings.   "Indexes" cannot be tested in the tester (since there is no way to get information from the Internet). Information is downloaded from the site investing.com: Report Date Earnings per share (E
Fibo World
Pavel Verveyko
The indicator builds a graphical analysis based on the Fibonacci theory. Fibo Fan is used for the analysis of the impulses and corrections of the movement. Reversal lines (2 lines at the base of the Fibonacci fan) are used to analyze the direction of movements. The indicator displays the of 4 the target line in each direction. The indicator takes into account market volatility. If the price is above the reversal lines, it makes sense to consider buying, if lower, then selling. You can open posi
The indicator determines the state of the market: trend or flat. The state of the market is determined by taking into account volatility. The flat (trading corridor)is displayed in yellow. The green color shows the upward trend. The red color shows the downward trend. The height of the label corresponds to the volatility in the market. The indicator does not redraw . Settings History_Size   - the amount of history for calculation. Period_Candles  - the number of candles to calculate the indicat
The indicator plots flexible support and resistance levels (dots). A special phase of movement is used for construction. Levels are formed dynamically, that is, each new candle can continue the level or complete it. The level can provide resistance or support to the price even where it is no longer there. Also, support and resistance levels can change roles. The importance of levels is affected by: the amount of time the level is formed and the number of touches. The significance of these lev
The indicator is a trading system for short-term trading. Scalper Assistant helps to determine the direction of the transaction, and also shows the entry and exit points. The indicator draws two lines (possible points for opening positions). At the moment of the breakdown of the upper line up (and when all trading conditions are met), an up arrow appears (a buy signal), as well as 2 goals. At the moment of the breakdown of the lower line down (and when all trading conditions are met), a down ar
Gold n XAU
Pavel Verveyko
The trading system is designed to work with gold on time periods: 30M, 1H. The indicator allows you to adjust to the market situation. Parameters for 1H :   PERIOD=9F ,   FILTER=300 .   Parameters for  30M :   PERIOD=22B ,   FILTER=450 .   A small adjustment to a specific broker is allowed .   If you change the amount of history displayed, you may also need to adjust the parameters. The indicator is not redrawn.     "Gold n XAU" uses different rules for entering a trade and different rules fo
The indicator builds "psychological levels": levels of round numbers and intermediate levels of round numbers. Round numbers play an important role in forming support and resistance levels. There is a pattern in which the decline or growth of the price can stop at round numbers. The level whose price ends at 0 is the level of a round number of the first order. Intermediate level, this is the level between two round levels, for example, between 10 and 20 this is level 15. In the " Num_Zeros "
Ichimoku Map (instant look at the markets) - built on the basis of the legendary Ichimoku Kinko Hyo indicator. The task of the Ichimoku Map is to provide information about the market strength on the selected time periods and instruments, from the point of view of the Ichimoku indicator. The indicator displays 7 degrees of buy signal strength and 7 degrees of sell signal strength. The stronger the trend, the brighter the signal rectangle in the table. The table can be dragged with the mouse. The
The indicator displays a stock chart of a non-standard type, in which the price and time have the same value. The usual chart of Japanese candlesticks does not take into account all the information that the time analysis can give. Renko charts do not use all the information that price can give in relation to time. The "Chart Price and Time" indicator takes into account price and time equally and shows the predominance of price or time. Taking into account price and time equally gives an idea
The indicator tracks sharp volatility (moments when the market has shown increased activity and movement may occur), on the selected instruments and time periods. The information is displayed as colored rectangles. Thus, it is possible to assess at a glance which tool should be given priority attention. The indicator will be useful for scalpers when they need a quick reaction or for traders working with a large number of instruments. The indicator does not redraw. The indicator displays 8 degree
The Alert Creator indicator is designed to create alerts for selected conditions. You can select one or several indicators for the notification. If several conditions are selected, the alert is triggered when all the selected conditions are met. The signals can be configured separately for buying and separately for selling. Example, a buy alert: the closing price is above the moving average, the RSI is below 20. (In this example, 2 indicators are used to generate an alert: MA and RSI) At the
The indicator determines the strength of the trend and its possible reversal points, based on the author's arithmetic approach . Each new peak or trough is a trend development. Such peaks and troughs are numbered so that the strength of the trend development can be seen. Attempts to change the trend are also numbered. This gives an understanding of a possible change in the direction of the trend. Indicator signals are generated when trying to change the trend . In the settings, it is possible
The indicator draws potential levels that may become significant support and resistance levels in the future. The longer the line, the higher the probability of a price reversal or an increase in price movement after the breakdown of this level. With a decrease in the probability of the formation of a level, the length of the line is reduced. The indicator does not require adjustment. In the settings, you can change the design of the indicator. The "L ine_Length " button is placed on the ch
Filtrele:
mambobody
462
mambobody 2022.06.28 04:25 
 

Kullanıcı değerlendirmeye herhangi bir yorum bırakmadı

krisnara123
2210
krisnara123 2020.12.15 20:57 
 

Kullanıcı değerlendirmeye herhangi bir yorum bırakmadı

Trader mql5
1325
Trader mql5 2019.04.24 10:15 
 

A very quick and easy way of measuring in points. It is unique and have not found anything like it! Excellent support from Pavel.

Değerlendirmeye yanıt