AutoFibExtensionABC

ABC Fib Extension — 自动 A-B-C 斐波那契扩展

产品概述

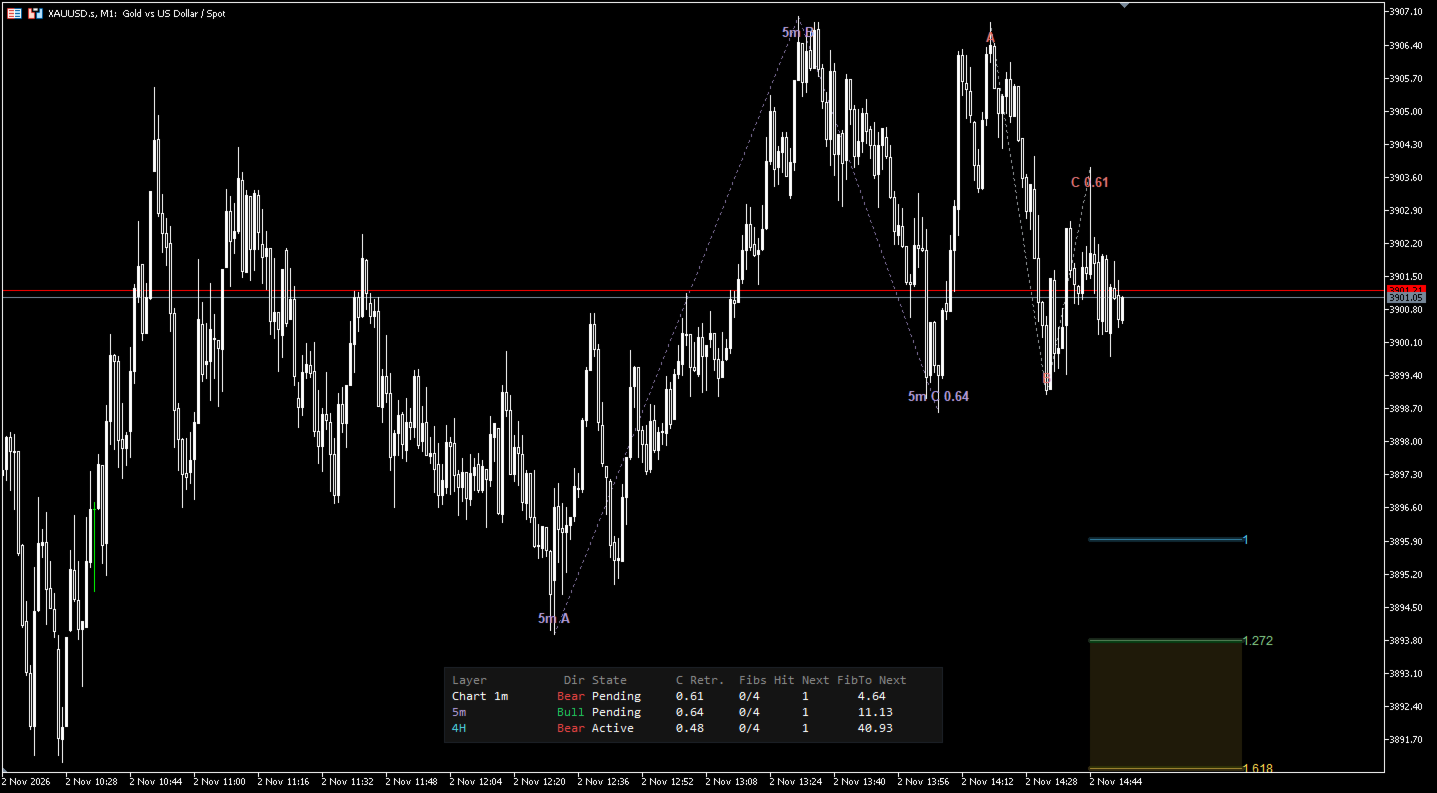
ABC Fib Extension 是 MetaTrader 5 图表指标。它自动监测价格摆动结构,标注通过内置过滤条件的结构的 A、B、C 三个点,并从 C 点出发绘制斐波那契扩展位。所有比例、颜色、线型与标签均可自定义。
同时可显示两个更高周期图层:当图表层的扩展位与更高周期的扩展位彼此靠近时,指标会把这段共同的价格区间标注为共振区。
本指标只做图表分析,不下单、不改单、不平仓,不是交易机器人。

指标画什么

  • A、B、C 三个结构点,带可选标签;C 点标签显示回撤幅度,鼠标悬停可看到简短说明。
  • 最多七条扩展位,从 C 点起算,每条都有独立的开关、比例与颜色。
  • 高亮价格带:在选定的两个比例之间填充半透明色块,用于标记关注区间。
  • A-B 与 B-C 两条腿线(点线),让结构来源保持可读。
  • 历史结构:最多保留五个此前的结构,以弱化颜色显示。
  • 共振区:图表层与更高周期图层扩展位重合的区间,最多同时显示六个。
  • 右边缘价格标签(可选):在图表右侧标出每条可见扩展位的价格。

结构状态

每个结构会在以下几个状态之间流转,绘图与状态面板都会同步体现:
状态
含义
Pending 待确认
结构已画出,价格尚未越过 B 点
Active 生效
价格已收盘越过 B 点,开始跟踪扩展位
Invalidated 失效
价格收盘越过 C 点,停止跟踪
Replaced 被替换
出现更新的结构,旧结构以弱化颜色保留
结构基于已收盘 K 线确认;确认之后不会再重绘。

多周期图层

两个独立的高周期图层可同时显示。每个图层独立识别结构,用各自的颜色与线型绘制扩展位。
  • 每个图层的时间周期可手动指定;设为 Current 时,自动使用上一级别周期。
  • 高周期的 A、B、C 点会对齐到图表上真实存在的 K 线,标签不会落在空白位置。
  • 当高周期 K 线在两个图表 K 线之间收盘时,图层会增量更新,不会漏掉。
  • 若两个图层被设成同一周期,第二个会自动再上一档。

状态面板

可在图表五个方位之一显示一张紧凑表格,每行对应一个图层(图表层、高周期 1、高周期 2):
列
内容
Layer 图层
图层名称,如 Chart M15、H1、H4
Dir 方向
当前结构方向,Bull 多头或 Bear 空头
State 状态
Waiting / Pending / Active / Invalidated / Replaced / Off / No higher TF
C Retr. C 回撤
C 点相对 A-B 段的回撤幅度
Fibs Hit 已触及
已触及的可见扩展位数量 / 可见总数
Next Fib 下一目标
尚未触及的最低比例位
To Next 距离
最新收盘价到该位置的距离
面板会自动适配浅色与深色图表主题。

提醒

提醒可以终端弹窗方式发出,同时一定写入 Experts 日志。可选事件:
  • 出现新结构;
  • 价格收盘越过 B 点;
  • 价格触及某条可见扩展位;
  • 价格接近某条扩展位(距离以 ATR 倍数计);
  • 结构失效。
提醒可选择是否包含高周期图层。每条消息都包含图层名、方向、A/B/C 价格;新结构消息还包含回撤幅度。

指标缓冲区

七个缓冲区输出当前生效结构各可见扩展位的价格,绘图方式为 DRAW_NONE(不干扰图表),可在数据窗口查看,也可由 EA 通过 iCustom 读取。

参数设置

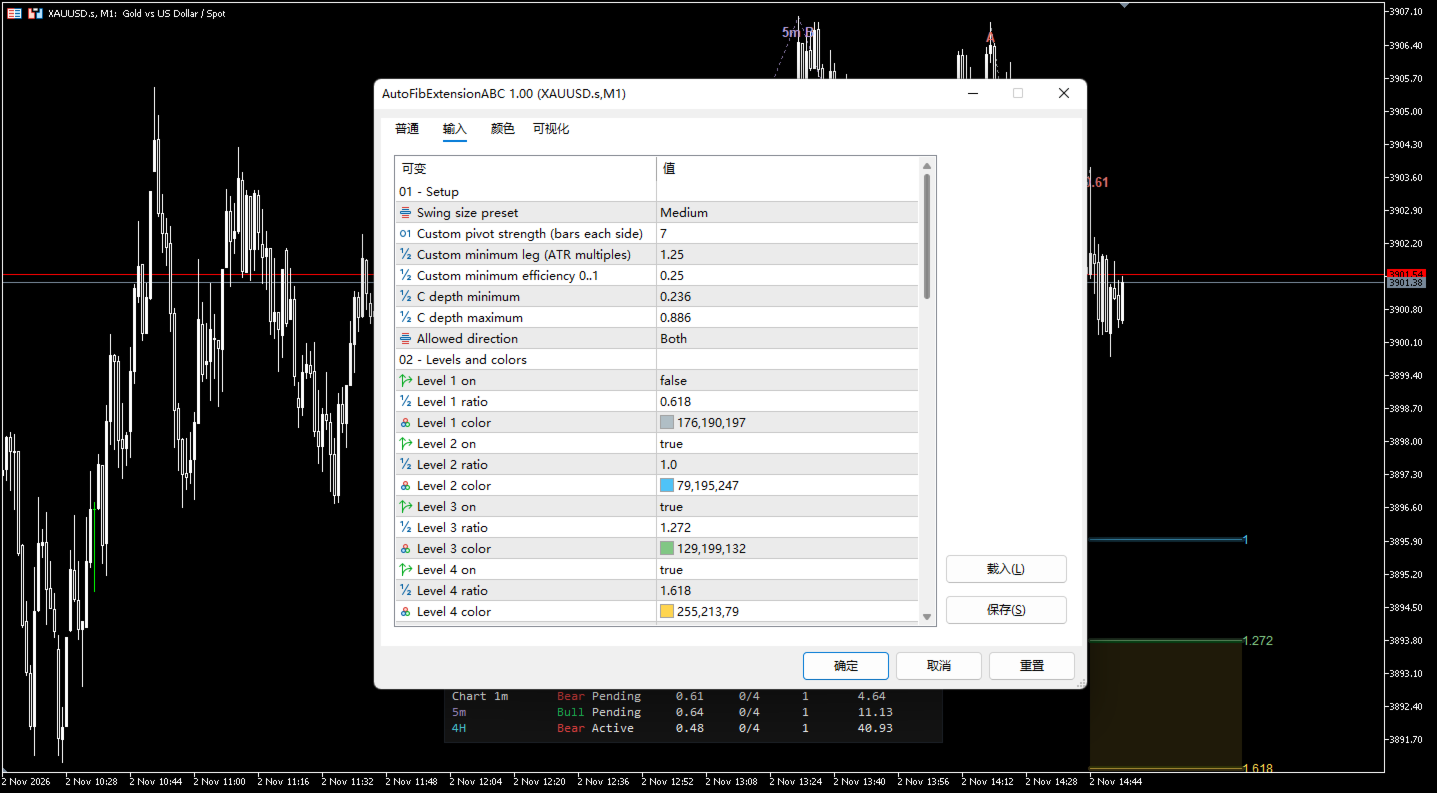
01 - Setup 结构识别

参数(英文原名)
默认
说明
Swing size preset
Medium
规模预设:Small 小 / Medium 中 / Large 大 / Custom 自定义
Custom pivot strength (bars each side)
7
枢轴点左右两侧所需 K 线数,仅在 Custom 下生效
Custom minimum leg (ATR multiples)
1.25
A-B 段最小长度(ATR 倍数),仅在 Custom 下生效
Custom minimum efficiency 0..1
0.25
A-B 段最低方向效率(0~1),仅在 Custom 下生效
C depth minimum
0.236
C 点回撤下限(占 A-B 段的比例)
C depth maximum
0.886
C 点回撤上限(占 A-B 段的比例)
Allowed direction
Both
方向过滤:Both 双向 / Bullish only 仅多头 / Bearish only 仅空头
Small / Medium / Large 三档预设使用各自内置的枢轴强度、最小腿长与最低效率;上面三个数值参数仅在预设选为 Custom 时生效。

02 - Levels and colors 扩展位与颜色

参数(英文原名)
默认
说明
Level 1 on / ratio / color
关 / 0.618
第一条扩展位
Level 2 on / ratio / color
开 / 1.000
第二条扩展位
Level 3 on / ratio / color
开 / 1.272
第三条扩展位
Level 4 on / ratio / color
开 / 1.618
第四条扩展位
Level 5 on / ratio / color
关 / 2.000
第五条扩展位
Level 6 on / ratio / color
开 / 2.618
第六条扩展位
Level 7 on / ratio / color
关 / 3.618
第七条扩展位
Highlight band on
开
在两个比例之间绘制填充价格带
Band from ratio / Band to ratio
1.272 / 1.618
高亮价格带的上下比例边界
Band color
黄
高亮带颜色
Band opacity percent
12
高亮带不透明度(百分比)
Label text
Ratio
标签内容:比例 / 比例+价格 / 仅价格
Hide levels beyond (ATR, 0 = off)
10.0
隐藏距离最新收盘价超过该 ATR 倍数的扩展位,0 表示不隐藏

03 - Higher timeframes 更高周期

参数(英文原名)
默认
说明
HTF 1 on / timeframe / color
开 / Current / 紫
第一高周期图层,Current 表示自动取上一级别
HTF 2 on / timeframe / color
开 / H4 / 青
第二高周期图层
HTF line style
Dashed
高周期扩展位线型:实线 / 虚线 / 点线
HTF overlap zones on
开
高亮图表层与高周期扩展位的重合区间
Overlap color
粉
共振区颜色
Overlap tolerance (ATR)
0.25
判定两条扩展位重合的最大距离

04 - Display 显示

参数(英文原名)
默认
说明
Chart line style
Solid
图表层扩展位线型
Line width 1..4
1
线宽
Glow halo
开
在扩展位下方绘制柔光
Glow strength
Medium
柔光强度:Soft / Medium / Strong
Extend right (bars)
30
扩展位向右延伸的 K 线数
Label size
Small
标签字号:Tiny / Small / Normal
Label position
Right
标签位置:右端或左端
Show A-B-C legs and tags
开
是否绘制腿线与 A/B/C 标签
Direction tinted tags
开
标签按方向着色(多头绿、空头红)
Past projections kept (0..5)
0
保留的历史结构数量
Right edge price tags
关
图表右边缘显示各扩展位价格

05 - Status panel 状态面板

参数(英文原名)
默认
说明
Status panel on
开
是否显示面板
Panel position
Bottom center
面板位置:底部居中 / 左下 / 右上 / 左上 / 右侧中部
Panel text size
Small
面板字号

06 - Alerts 提醒

参数(英文原名)
默认
说明
Alert on a new A-B-C
开
新结构确认时提醒
Alert when B is cleared
开
价格收盘越过 B 点时提醒
Alert when a level is reached
开
触及可见扩展位时提醒
Alert when the projection is invalidated
开
结构失效时提醒
Alert when price approaches a level
关
价格接近扩展位时提醒
Near distance (ATR)
0.5
接近提醒的判定距离
Include HTF layers in alerts
开
提醒是否包含高周期图层
Show a popup alert
开
除日志外是否弹出终端提醒窗口

使用步骤

  1. 把指标加载到任意品种与周期的图表上,图表至少需要 40 根历史 K 线。
  2. 选择摆动规模预设:Small 对小结构敏感,Large 只保留较大结构;需要精细控制时选 Custom,自行设置枢轴强度、最小腿长与最低效率。
  3. 打开需要观察的扩展位比例并调整颜色;把高亮价格带设为你想持续关注的区间。
  4. 启用一到两个高周期图层,需要共振区时设置重合容差。
  5. 选择需要的提醒类型与状态面板位置。
  6. 若图表过于拥挤,可用"隐藏过远扩展位"参数只保留当前价格附近的目标位。

注意事项

  • 指标适用于基于时间的图表;高周期图层要求当前图表周期为时间周期,非时间图表(如 tick 图)上会自动关闭。
  • 高周期图层需要终端中已存在对应周期的历史数据。
  • 所有图形都是标准图表对象,按实例前缀命名,指标移除时会被一并清理。
  • 指标只处理单一品种,结构基于已收盘 K 线确认。

免责声明

本指标是图表分析工具,本身不构成交易信号,不会开立或管理订单,也不对任何交易结果作出保证。斐波那契扩展位是计算得到的价格位置,不是行情预测。交易决策由使用者自行作出,金融市场交易存在风险。
Yazarın diğer ürünleri
Automatic Support and Resistance Levels with Breakout Tracking Product name note: the file name and the indicator short name in the source are AutomaitcSR . The correct spelling AutomaticSR is recommended before submission. Use one identical name for the file, the short name and the Market product title. Short description (for the Market product card) Automatic support and resistance levels built from confirmed swing pivots, with ATR-based filtering, optional level zones, breakout marking and a
FREE
JKTopHedge
Shi Yuan Wang
JK-Top Hedge — Two-Sided Hedged Grid EA for MetaTrader 5 Overview JK-Top Hedge is an Expert Advisor for MetaTrader 5. It places a Buy Stop above the current price and a Sell Stop below it at the same time, building two grid lines on either side of the market. When one pending order is filled, the EA places the next one further away, and the cycle repeats. Because long and short positions exist at the same time, a floating loss on one side can partly be offset by the other. The EA closes or reduc
BBOscillator — Candle Coloring with Andean Oscillator States and ATR Stop Levels Overview BBOscillator is a technical indicator for MetaTrader 5 that is drawn in the main chart window. It combines the Andean Oscillator state logic, candle coloring, dynamic ATR stop levels and state-change marks in a single visual layer, so that four questions can be answered by looking at one chart: whether the direction is defined, which side it leans to, where the direction state started, and where a stop refe
FREE
SweepReversalMap — Likidite süpürmesi sonrası dönüş bölgesi haritalama göstergesi Genel Bakış SweepReversalMap, piyasada «Liquidity Sweep» (likidite süpürmesi) olaylarını tanımlamak ve fiyat reclaim yaptıktan sonra potansiyel dönüş bölgelerini haritalamak için kullanılan, Price Action tabanlı özel bir göstergedir. Her enstrüman ve zaman dilimi için uygundur. Temel Mantık Swing noktası tespiti: Kullanıcının belirlediği Swing Length’e göre en son geçerli swing yüksek / düşük seviyeleri tanımlanır
FREE
High Time Candlestick Chart Visualize the current higher-timeframe candle directly on your lower-timeframe chart. This indicator projects the OHLC data of a selected higher timeframe ​ (M15, H1, H4, D1, or W1) onto your current chart as a graphical candlestick, offset to the right of the live price area. It helps you keep the bigger-picture candle structure in view without switching timeframes. Features Graphical HTF candle : Body, upper wick, and lower wick drawn as chart objects, colored by bu
FREE
Trend Reversal Probability Overview Trend Reversal Probability is an analytical indicator for MetaTrader 5. It does not open, close or manage trades. Its purpose is to describe one specific property of the market in numbers: how long the current directional state of a smoothed momentum oscillator has already lasted, and how unusual that duration is compared with the same measurement on previous occasions. The indicator runs in a separate window. On every bar it updates the duration of the curren
FREE
FibonacciSuite
Shi Yuan Wang
5 (1)
Fibonacci Confluence Suite Short description Fibonacci Confluence Suite is a chart-window indicator for MetaTrader 5. It builds a Fibonacci grid from confirmed swing highs and lows, marks the levels where projections from earlier swings overlap, and adds a Golden Pocket zone, Fibonacci time zones, touch statistics and a compact status panel. All levels are calculated from closed bars only. Overview Drawing retracement levels by hand usually means three separate steps: finding the swing, pulling
FREE
Overview QuantifiedTrends is a MetaTrader 5 indicator that runs in a separate chart sub-window. It describes momentum conditions through three calculation layers: Primary QQE layer: an RSI-based structure that uses smoothing and the smoothed RSI's own variation to build adaptive upper and lower bands and a primary QQE trend line. Statistical envelope layer: Bollinger Bands applied to the deviation of the primary QQE trend line from the 50 midline, used to determine whether primary momentum readi
FREE
RSI Support Resistance Signals Platform: MetaTrader 5 RSI Support Resistance Signals adds zone coloring and signal labels to the standard RSI. The indicator does not execute trades. Signals: Sell: RSI is in the overbought zone and turns down, or RSI is in the resistance zone and a bearish candle with an upper wick is detected. Buy: RSI is in the oversold zone and turns up, or RSI is in the support zone and a bullish candle with a lower wick is detected. Each signal can show a user-defined Engli
FREE
TrendReferenceLine — Adaptive Trend Line with ATR Channel and Auto Trade Levels Short description: ​ An adaptive trend line indicator that switches color with trend direction, marks confirmed reversals with arrows, and automatically plots entry, stop loss and three R-multiple targets on the chart. Type: ​ Trend-following technical analysis indicator (not an automated trading robot). What it does In trend trading, three questions matter most: has the direction changed, where does the stop go, and
FREE
RSICloud
Shi Yuan Wang
RSI Cloud — RSI Dual Moving Average Cloud Indicator This indicator calculates RSI in a separate window, applies fast and slow moving averages to the RSI values, and displays the relative position of the two averages as a filling cloud. It also provides an optional raw RSI line, fixed 70/50/30 reference levels, and arrow markers when the fast and slow RSI averages cross. The indicator is for analysis and signal filtering only; it does not place trades. How it works Wilder RSI is calculated from
FREE
HubDynamicTrendLine This indicator identifies strict pivot highs and lows based on N bars to the left and right (default 15), connecting consecutive pivots of the same type to build a dynamic channel with upper and lower boundaries. Key Features Pivot Connections : Consecutive pivot highs and pivot lows are connected with solid trend lines, forming a visible channel structure. Slope Projection : When the price difference between two consecutive pivots of the same type is at least one 200-period
FREE
Dual Period Filter — Adaptive Coppock Curve for MT5 Overview The Coppock Curve is built from the sum of a long and a short rate of change, smoothed afterwards, and is used to observe the direction and strength of medium-term momentum. This indicator extends the classic calculation in two ways. First, the price source passes through an optional adaptive filter before the momentum is calculated. Nine filter types are available: None, SMA, EMA, RMA, Double WMA, Triple VWMA, HMA, LLAMA and Kalman.
FREE
Trend Pressure Oscillator Trend Pressure Oscillator is a separate-window analytical indicator for MetaTrader 5. It evaluates buying and selling pressure across multiple timeframes to help identify potential exhaustion points and market regime shifts. This tool does not generate trading signals automatically and does not execute trades. It is designed to be used as part of a broader technical analysis approach. Functionality Multi-range pressure analysis using Williams %R over three periods (Pul
FREE
Intraday Spark Chart Overview Intraday Spark Chart is an MT5 indicator for intraday analysis. It converts the current price change of a symbol into a percentage of the daily opening price and plots the result in a separate subwindow. Every trading day starts again from the zero line, so each day is drawn as a separate segment and the intraday move of the current day can be observed directly. The indicator is a data visualization tool. It does not generate trading signals and does not provide inv
FREE
SR Power Channel — Support & Resistance Power Channel Indicator Overview SR Power Channel is a main-chart visual indicator built on price extremes and ATR. It locates the highest high (resistance) and the lowest low (support) within a configurable lookback window, extends those two levels to the right, and wraps them into ATR-based channel bands. The indicator also counts bullish and bearish bars inside the window and marks the moments when price breaks above or below the channel bands with dia
FREE
Inverse Probability Distribution — Pivot Density and K-Means Clustering Indicator Platform: MetaTrader 5 Overview This indicator is a technical analysis visualization tool for MetaTrader 5. It identifies confirmed pivot highs and lows on historical bars, groups pivot prices with K-Means clustering, and draws an inverse distribution profile on the right side of the chart. The profile shows the density of historical pivot prices at different price levels. The indicator does not generate trading s
FREE
Trendfollowingline (ATR Based Trend Following Indicator) Overview Trendfollowingline is a trend following indicator drawn in the main chart window. It uses the Average True Range (ATR) as a measure of market volatility and plots a band around the price: while the direction is up, the band is placed below the price and moves upwards; when the direction turns down, the band switches above the price and moves downwards. An arrow marker is drawn on the band each time the direction changes. The indic
FREE
Deviation Trend Profile Overview Deviation Trend Profile is a MetaTrader 5 chart indicator that combines three visual layers in a single chart window: a moving average with momentum-based coloring, deviation bands calculated from volatility, and a horizontal distribution profile drawn to the right of the current price. The indicator is an analytical tool. It does not open, modify or close trades, and it is not a complete trading system. It is designed to help the user observe trend direction, mo
FREE
MA Valuation Fluctuations measures how far the current price stands from its moving average. The deviation is expressed in units of dispersion and then compressed by a hyperbolic tangent into a fixed range from -1.0 to +1.0. The indicator is drawn in a separate window and can be used as a context filter next to a trend following or a mean reversion approach. What the indicator shows For every bar the indicator compares the selected price with a moving average in logarithmic terms. Because the r
FREE
MACandleApprox — Moving-Average Approximate Candle Indicator MACandleApprox is a custom indicator that, on the main price chart, applies a selected type of moving average to the open, high, low, and close price series respectively, and replots them as "approximate candles". It does not modify the original candlesticks; instead, it overlays a smoothed candle view based on moving averages, helping traders observe the smoothed price movement and directional changes more intuitively. The indicator s
FREE
EF Percentage Channel A trend-state indicator that combines volatility-adaptive averaging, an Ehlers nonlinear filter, and statistical percentile bands into a single, self-adjusting channel. Overview The indicator builds an adaptive trend baseline on the chart and wraps it with statistical percentile bands. When price moves above the upper band, the market is flagged as bullish; below the lower band, bearish; inside the channel, the previous state is retained. The trend line, channel bands, cand
FREE
Adaptive MACD - R² Based Adaptive MACD Indicator Overview Adaptive MACD is an innovative MetaTrader 5 indicator that improves upon the traditional MACD. By introducing the Pearson correlation coefficient to calculate the R² value of price trends, this indicator can adapt to market conditions and dynamically adjust its sensitivity. It helps traders capture trends more effectively while filtering out market noise. How It Works Traditional MACD uses a fixed difference between fast and slow EMAs. Ad
FREE
ZigZag Trader EA - Intelligent ZigZag Trading Assistant Introduction ZigZag Trader EA is a fully automated trading assistant based on the ZigZag indicator. It intelligently identifies previous highs and lows of the ZigZag indicator, combined with an advanced risk management system, to provide you with precise trading signals and automated trade execution. Whether you are a novice or experienced trader, ZigZag Trader EA can help you simplify trading decisions and achieve stable trading performa
FREE
# MASignalPanel — Multi-MA Signal Panel with Trend Filter ## Overview MASignalPanel is an all-in-one moving-average signal indicator designed for MetaTrader 5. It combines up to three moving averages (SMA, EMA, SMMA, LWMA) with four trade signal modes — Cross, Breakout, Pullback and Channel — and adds a higher-timeframe trend filter line (default EMA240) to keep you on the right side of the market. A fully interactive control panel lets you change MA type, MA count, periods, s MA indicator, movi
FREE
MACandleApproxPro — Advanced MA Candle Reconstruction & Multi-Dimensional Market Structure Indicator Overview MACandleApproxPro ​ is a comprehensive technical analysis tool designed for professional traders. It breaks through the limitations of traditional moving averages by reconstructing MA data into "MA Candles" ​ through complex algorithms. This unique visualization filters out market noise, allowing you to examine price trends, momentum shifts, and critical market structures from a more
JKTaurus
Shi Yuan Wang
JK-Taurus Expert Advisor A grid-based scaling EA driven by trend and signal confirmation. Overview JK-Taurus is a fully automated trading system designed specifically for the MT5 platform. It integrates multi-timeframe trend analysis, signal confirmation, and a dynamic grid-based position-building strategy, aiming to capture sustained profit opportunities during trending market conditions. The EA features an intuitive visual dashboard, allowing users to monitor account status in real-time and in
Adaptive filtering trend Overview Adaptive filtering trend is a multi-layer signal filtering indicator for the MetaTrader 5 platform, built on the Coppock curve. The indicator computes a long-period and a short-period Rate of Change (ROC) of the price, sums them, and smooths the sum with a Weighted Moving Average (WMA) to obtain the Coppock curve. A set of independently switchable filters is then applied to screen the signals, and bullish or bearish crossings are marked on the main chart throug
JKEFAdvancedModel — Volatility-Adaptive Trend Breakout Trading System Overview JKEFAdvancedModel is a fully automated Expert Advisor for MetaTrader 5. On the selected timeframe it adapts to market volatility to follow the trend and trade breakouts. The system evaluates the state of closed bars only, so signals are not revised by an unfinished bar. Once a direction is confirmed, the robot can enter with a market order or place a stop order at a defined distance from the current price and wait for
JKEFtrendMartingale — Volatility-Adaptive Trend-Following Martingale Trading System Overview JKEFtrendMartingale is a fully automated Expert Advisor for MetaTrader 5. On the selected timeframe it adapts to market volatility to follow the trend and trade breakouts. After a losing trade it increases the lot size of the next trade according to the configured rule, and returns to the initial lot size once profits have absorbed the accumulated loss. The system evaluates the state of closed bars only,
Filtrele:
Değerlendirme yok
Değerlendirmeye yanıt