Iron Drone MTF MT4

Iron Drone: The Autonomous Vanguard of Financial Multi-Dimensionality

Step beyond the conventional frontiers of price tracking and immerse yourself in an elite ecosystem where mathematical divergence converges with tactical execution. Iron Drone is not just an indicator; it is a multi-layered, autonomous intelligence engine engineered to track market imbalances across every higher dimension simultaneously .

Rooted in a profound legacy of precision programming and dedicated to the enduring memory of those who illuminate the path, Iron Drone brings absolute clarity to chaos. It operates with a powerful spiritual frequency of abundance, high-vibrational discipline, and good-luck karma—transforming your trading workspace into an absolute domain of focus and mastery.

The Autonomous Edge

  • Multi-Timeframe Synchronization (The Vanguard Array): Cast the signals of every higher time horizon (from M5 up to Monthly) directly onto your primary chart workspace, granting you total structural awareness .

  • Binary-Style Precision Execution: Treat every line touch as an absolute tactical event, engineered for precision timing from entry to candle expiry .

  • The Intelligence Dashboard & Leak-Detection Engine: Uncover hidden vulnerabilities, filter out low-probability market noise, and track real-time performance statistics across sessions, trends, and volatility states .

  • Triple SMA Harmonic Integration: Powered by an advanced multi-layered moving average structure that anchors directly to critical divergence zones, ensuring dynamic reaction paths wherever price wanders .

Dedicated to Excellence

Every calculation within this framework echoes a standard of absolute programming brilliance. Command the momentum. Master the flow. Enter the realm of Iron Drone.

Önerilen ürünler
**Binary Smart System: En İyi İşlem Yardımcınız** Binary Smart System sadece bir gösterge değil, piyasaların çeşitli alanlarında hassaslıkla işaretler üreten sofistike bir işlem aracıdır. Keskin algoritmaların ve geniş bir teknik gösterge koleksiyonunun birleşiminden oluşan bu sistem, işlem başarınızı en üst düzeye çıkarmak için tasarlanmıştır. **Gösterge Bileşenleri:** 1. **Hareketli Ortalama Yüzdesi (HAY):** Bu bileşen, birden fazla hareketli ortalamanın ağırlıklı ortalamasını hesaplar ve
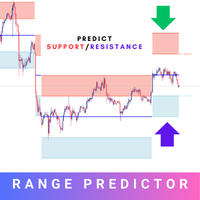
Introducing the Range Predictor : Your Ultimate Guide to Future Trading Ranges! Imagine having the power to see into the future of market moves— Range Predictor brings this dream to life. Designed to deliver real-time, predictive support and resistance levels , this tool goes beyond standard indicators, offering trend direction insights and precise range forecasts . Whether you're a day trader or a swing trader, the Range Predictor is your all-in-one toolkit for mastering the markets. MT5 Ver
ToolBox 360 is the swiss knife of all indicators. It is full packed with useful tools to help you with your trading. It can be used to find best entry and exit points and help you to decide if you should open a trade or not. It shows market trends, candlestick formations outside / inside bars and you can sett time based allerts. Main features: Time based Fibonacci lines Choose a start and end time and the indicator shows you Fibonacci lines within the selected time range including range high a
Indicator for binary options arrow is easy to use and does not require configuration works on all currency pairs, cryptocurrencies buy signal blue up arrow sell signal red down arrow tips do not trade during news and 15-30 minutes before their release, as the market is too volatile and there is a lot of noise it is worth entering trades one or two candles from the current period (recommended for 1 candle) timeframe up to m 15 recommended money management fixed lot or fixed percentage of the depo
This is  a dashboard indicator that displays the Average Level of each selected currency pairs that filters and gives us a signal for overbought (>=90%) or if price at extreme peak above 90, and/or oversold (<=10%) or if price at extreme peak below 10. The calculation is using Relative Strength Index default periods (2 & 9) applied to three different higher time frames H4,D1,&W1. This won't change or altered even if you change symbol or switch to lower time frames or even in monthly and year
The Market Structures Pro indicator finds and displays 5 (five) patterns of the Smart Money Concepts (SMC) system on the chart, namely: Break Of Structures (BoS)       Change of character (CHoCH) Equal Highs & Lows Premium, Equilibrium and Discount zones with Fibo grid High-high, Low-low, High-low and Low-high extremes Patterns are displayed for two modes - Swing and Internal and are easily distinguished by color on the chart. Internal mode features higher contrast colors, finer lines, and smal
Bir dokuz veya on üç tek bir grafikte nadirdir, ve bir izleme listesinin grafik grafik atlamaya üstün gelmesinin nedeni tam olarak budur. Exhaustion Count Scanner, iptal ve yeniden başlatma kuralları dahil tam setup ve countdown yöntemini, sembol listenizin tamamında aynı anda sekiz zaman dilimine kadar çalıştırır, her çalışan sayımı yöneldiği sayıyla birlikte yazdırır, ve zaman dilimlerinin uyuştuğu satırları işaretler. Kutudan çıktığı gibi on beş pariteyi tarar; bir ayar bu sayıyı yirmi sekize
The   Onion   Trend Indicator is a revolutionary trend trading and market data filtering solution that combines all the important features of a trend tool in one tool! It is great for any trader, be it Forex or binary options. No settings are required, everything is optimized by time and experience, it works effectively both in flat conditions and in trend conditions. The Onion Trend Indicator is a technical analysis tool for financial markets that reflects current deviations in the price of s
This is  a dashboard indicator that displays the auto-calculated risk lot, with the given risk percentage & risk points (Stop Loss) and others. The main function of this indicator is to help you calculate your exact scalping risk lots and swing risk lots. Also it displays the active trades of each pair you've executed with the following: type of trade, lot size, symbol, & equity(+/-). Also displays the bar counter set in every 5-minute bar timer. (whichever time frame you're active, the bar time
Urgently
Tatiana Savkevych
The Urgently indicator is designed to quickly determine the situation in the market, reflect the state of the market and signal profitable levels for opening trades. Market conditions change quickly enough, requiring constant calibration of trading strategies. Recommended for use in conjunction with any of the oscillators. The Urgently forex market trend indicator shows the trend direction and entry points. It smooths out price fluctuations when generating a signal by averaging the data and the
Binary Options Assistant (BOA) ICE Signals Indicator provides signals based on gkNextLevel Binary Options Strategy.  Indicators: 2 Bollinger Bands & Stochastic Stop missing trades, stop jumping from chart to chart looking for trade set-ups and get all the signals on 1 chart! U se any of the BOA Signals Indicator with the  Binary Options Assistant (BOA) Multi Currency Dashboard .   All BOA Signal Indicator settings are adjustable to give you more strategy combinations. The signals can be seen
FREE
Promotional pricing: $100 until 31 August 2026. The price returns to $300 after that date. APEX MARKET STRUCTURE ----> MT4   See What the Market Is Really Doing. Watch the 3 Market Phases unfold live (Contraction, Expansion, Trend) and catch better entries   at the early stage of the Trend Phase.   Stop guessing. Start reading the market the way institutions and smart money do.      Apex Market Structure for MT4 is a precision smart-money analysis tool that strips away the noise and reveals t
Zig Zag Robot: A Comprehensive Reversal Trading System The Zig Zag Robot is a powerful tool designed to accurately identify key market reversals and filter out market "noise." It goes beyond a simple Zig Zag indicator by combining multiple tools and built-in logic to provide you with ready-to-use trading signals and help you make more informed decisions. How It Works The indicator uses a multi-level approach to market analysis, which allows it to find high-probability entry points: Signal Filter
Smart Session Monitor
Mauricio Tiago Ezequiel Speroni Barboza
Smart Session Monitor Smart Session Monitor is an MT4 indicator designed to display the main trading sessions directly on the chart. The indicator highlights Tokyo, London and New York sessions using transparent background zones, allowing the trader to keep the chart clean and readable. The indicator also includes a compact information panel with ATR, spread and candle timer data. The session schedule is based on GMT time and is automatically adjusted to the broker server time. Main Features Dis
PipFinite Impulse PRO
Karlo Wilson Vendiola
4.94 (62)
Are You Tired Of Getting Hunted By Spikes And Whipsaws? Don't become a victim of the market's erratic moves.. Do Something About It! Instantly make smarter decisions with Impulse Pro's precise balance of filters and accurate statistics. Timing Is Everything In Trading To learn more, please visit www.mql5.com/en/blogs/post/718212 Anticipate the next big move before it unfolds in 3 Simple Steps! Advantages You Get Early impulse detection algorithm. Flexible combination to different trading s
Product Overview Global Session Zones System is a chart indicator designed for both   MT4 and MT5   platforms. It visualizes the four major global trading sessions (New York, London, Tokyo, Sydney) by drawing session background boxes, key price levels, and a statistical panel. It helps traders identify market volatility and trend strength, providing reliable breakout signals. Core Features Session Visualization : Customizable start/end times and colors for the four major sessions. Technical Anal
XFlow4
Maxim Kuznetsov
XFlow shows an expanding price channel that helps determine the trend and the moments of its reversal. It is also used when accompanying transactions to set take profit/stop loss and averages. It has practically no parameters and is very easy to use - just specify an important moment in the history for you and the indicator will calculate the price channel. DISPLAYED LINES ROTATE - a thick solid line. The center of the general price rotation. The price makes wide cyclical movements around the
YearlyRects
Anton Karabeinikov
О продукте Yearly Rects   — авторский индикатор для MetaTrader 4, который автоматически строит диапазоны каждого торгового года прямо на графике и рассчитывает   прогнозируемую ценовую цель   следующего года на основе статистики предыдущего. Индикатор создан специально для работы с   фондовыми индексами   (S&P 500, NASDAQ, DAX, FTSE, Nikkei, MOEX и др.), где годовые циклы имеют ярко выраженный характер и исторически хорошо отрабатывают уровни открытия/закрытия. Однако методика универсальна — её
Market Ticker
John Louis Fernando Diamante
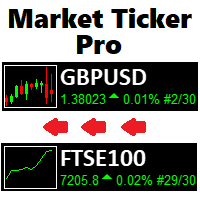
The only Market Ticker on the market! Add a professional novelty to your workspace, with built in mini-charts A scrolling Market Ticker that displays price changes from all symbols in the Market Watch list. Provides an easy snapshot of symbol prices, and keeps scrolling automatically while you trade and analyse the chart. The ticker color (+/- price changes) are based on either the current or completed candle, and the previous candle. Options include: - MTF, eg choose to show price changes of

FVG Detector Pro MT5 – Advanced Fair Value Gap Detection Indicator FVG Detector Pro is a professional Fair Value Gap (FVG) detection indicator for MetaTrader 5, designed to help traders identify potential institutional imbalance zones with speed, accuracy, and chart clarity. The indicator automatically detects Bullish and Bearish Fair Value Gaps across all symbols and timeframes, helping traders analyze possible continuation areas, liquidity imbalances, and price reaction zones often used in pr

Forex Gump
Andrey Kozak
2.4 (5)
Forex Gump is a fully finished semi-automatic trading system. In the form of arrows, signals are displayed on the screen for opening and closing deals. All you need is to follow the instructions of the indicator. When the indicator shows a blue arrow, you need to open a buy order. When the indicator shows a red arrow, you need to open a sell order. Close orders when the indicator draws a yellow cross. In order to get the most effective result, we recommend using the timeframes H1, H4, D1. There
A technical indicator that displays information about the trading volume in the form of a histogram of distribution by price levels. It is used as an independent indicator that helps to evaluate the current objective situation of the instrument, as well as in the format of integration with other methods of analysis, to confirm or filter when making trading decisions. Key Features: Interactive profile update, real-time work Five modes of histogram calculation The possibility of separating the vol
FutureTrade
Andrey Spiridonov
3 (2)
FutureTrade is one of the few indicators that predicts the price right on the price chart. The indicator calculation algorithm is based on the fast Fourier transform. Given the oscillatory behavior of the price, the Fourier function predicts its future behavior. The indicator should be attached in the usual way to a chart with the trading instrument specified symbol and with the M15 timeframe. This timeframe is the most optimal for working with any symbols. Once started, the indicator calculates
King Box Thor
Nguyen Cong Hoan
The product has a great combination of pending orders and trends to help investors manage capital effectively. The bot does not have a martingale, so it is always safe of capital. Run the D1 timeframe pairs. The main parameters can be installed: Lot -  Startot . Auto-Grid   -    ON/OFF AutoLot  - ON/OFF TP - Takeprofit   -pips. SL - StopLoss  - Pips. Magic -  Number magic. TralllingStop  - ON/OFF Comment  - KING Tralling - pips
Ultra Hedge Scalper is a fully automated scalping Expert Advisor that combines scalping and hedging strategy that you can use to backtest a 10-year of data with modelling quality of at least 90%. It uses only an entry analysis based on a proprietary Candlestick Breakout System and settings to detect price breakout movement. The success secrets of the Expert Advisor if back-tested and forward-tested correctly are the combination of the entry method with the Money Management and multiple exit str
XAU Marti
BILLY ARANDUQUE ABCEDE
Get the EA for FREE Just sign up and use my broker. Broker Link :  https://fbs.partners?ibl=684451&ibp=26113188 Setfile Here :  https://drive.google.com/file/d/1IetLj8ZC-AehDXQLJCTYfWGn3GB4JgqU/view?usp=sharing MT5 Version Here :  https://www.mql5.com/en/market/product/136467 XAU Marti The Smart Choice for Gold & Forex Traders -  Profit Potential! Why This EA Stands Out: RSI-POWERED ENTRIES   - Combines the reliability of RSI indicators with advanced money management for high-probab
Robot scalper for M5 timeframe. Trades on the GBPUSD currency pair. This robot has been specially developed by a company of professional traders for trading in the pound sterling. The robot approximately opens 5 to 15 trades every day. It is best to trade with brokers that have a low spread on GBPUSD up to 10 pips. The recommended minimum deposit to start is $500 or more. Advantages: does not use martingale. not a net. every trade has a stop loss. professional bot specifically for the GBPUSD p
Full Forex Market View Dashboard
Opengates Success International
5 (2)
TAM FOREX PİYASASI GÖRÜNÜMÜ Pano Göstergesi Bu, Yatırımcılara piyasada neler olup bittiğine dair tam bir görüş sağlamak için oluşturulmuş özel bir göstergedir. Piyasaya erişmek ve başarılı ticaret yapmak için gereken her türlü bilgiyi görüntülemek için gerçek zamanlı bir veri kullanır. KURULUM: Bu Göstergeyi pencere grafiğinize eklemeden önce, MT4'ünüzün Piyasa İzleme paneline gidin ve ihtiyaç duymadığınız veya ticaret yapmadığınız tüm Döviz çiftlerini GİZLEYİN ve geri kalanını orada bırakın.
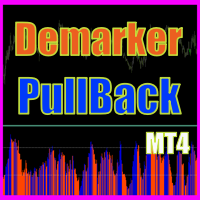
Demarker pullback system - is the manual trading system for choppy markets. It show 2 colored histogram.  When histogram is blue - market is quite bullish, when histogram ir orange - market is more bearish. Up arrow is plotted when histogram is in oversold zone but blue color. Down arrow is plotted when histogram is in overbought zone but orange color. These patterns shows false breakout and possible soon reverse(price is overbought but shows bearish signs and price is oversold but shows bullis
SP Volatility Break M15 Strategy is a fully automated MetaTrader 5 strategy designed to capture volatility breakout opportunities on the S&P 500 using Bollinger Band market structure, Bollinger Band Width Ratio execution filters, ATR-based risk management and pending STOP orders. The strategy is designed for the S&P 500 market on the M15 timeframe. Its goal is to participate when the market moves out of a normal volatility structure and then confirms a tradable breakout condition. The system d
FREE
Bu ürünün alıcıları ayrıca şunları da satın alıyor
Miraculous Indicator Binary & Forex v3 StrategySafe Miraculous Indicator Binary & Forex v3 StrategySafe , net sinyaller, güçlü onay araçları ve Binary ile Forex piyasalarında kullanılabilecek yapılandırılmış bir işlem yaklaşımı isteyen traderlar için geliştirilmiş profesyonel bir indikatördür. v3 sürümü; MIR Dashboard, Miraculous Confirmation Dashboard, GANN Law, Square of 9 seviyeleri, GANN açıları ve daha gelişmiş Forex modu ile daha güçlü bir piyasa analizi sunar. Öne çıkan özellikler Tek ind
ORB Seeker
Marcela Goncalves De Oliveira
4 (1)
Ürünün sınırlı sayıda bulunmasını ve kıtlığını korumak için özel fiyat! Sadece 599 dolar! Satın alma işleminden sonra, bonus ORB Seeker EA ve kişisel olarak optimize edilmiş set dosyalarını almak için benimle iletişime geçin. Temiz antrenman seanslarında güvenle mola verin! ORB Seeker, doğruluk, sadelik, esneklik ve net grafik yapısı isteyen yatırımcılar için tasarlanmış profesyonel bir Açılış Aralığı Kırılımı (ORB) göstergesidir. Otomatik olarak herhangi bir enstrüman için piyasa öncesi veya
Meravith
Ivan Stefanov
5 (3)
Market maker aracı. Meravith şunları yapar: Tüm zaman dilimlerini analiz eder ve geçerli trendi gösterir. Alış ve satış hacimlerinin eşit olduğu likidite bölgelerini (hacim dengesi) vurgular. Farklı zaman dilimlerinden tüm likidite seviyelerini doğrudan grafiğinizde gösterir. Referansınız için metin tabanlı piyasa analizi üretir ve sunar. Mevcut trende göre hedefler, destek seviyeleri ve stop-loss noktalarını hesaplar. İşlemleriniz için risk/ödül oranını hesaplar. Hesap bakiyenize göre pozisyon
First time on MetaTrader, introducing IQ Star Lines - an original Vedic Astrology based indicator. "Millionaires don't use astrology, billionaires do" . - J.P. Morgan, Legendary American financier and banker. We don't offer free or bonus indicators in exchange of reviews from you. You won't need any free products with this indicator to make it work. ;) Enjoy! Welcome to  the new and updated  IQ Star Lines , the ultimate fusion of ancient planetary harmonic cycles and modern quantitative trading.
FFx Engulfing Setup Alerter gives trade suggestions with Entry, Target 1, Target 2 and StopLoss. Below are the different options available: Entry suggestion - pips to be added over the break for the entry 3 different options to calculate the SL - by pips, by ATR multiplier or at the pattern High/Low 3 different options to calculate the 2 TPs - by pips, by ATR multiplier or at Risk/Reward Offset the dashboard - any place on the chart Remove the suggestion once the price reached the SL line Lines
FFx InsideBar Setup Alerter gives trade suggestions with Entry, Target 1, Target 2 and StopLoss. Below are the different options available: Entry suggestion - pips to be added over the break for the entry Minimum candle size - to avoid too close buy/sell entry suggestions 3 different options to calculate the SL - by pips, by ATR multiplier or at the pattern High/Low 3 different options to calculate the 2 TPs - by pips, by ATR multiplier or at Risk/Reward Offset the dashboard - any place on the c
FFx OutsideBar Setup Alerter gives trade suggestions with Entry, Target 1, Target 2 and StopLoss. Below are the different options available: Entry suggestion - pips to be added over the break for the entry. 3 different options to calculate the SL - by pips, by ATR multiplier or at the pattern High/Low. 3 different options to calculate the 2 TPs - by pips, by ATR multiplier or at Risk/Reward. Offset the dashboard - any place on the chart. Remove the suggestion once the price reached the SL line.
FFx PinBar Setup Alerter gives trade suggestions with Entry, Target 1, Target 2 and StopLoss. Below are the different options available: Entry suggestion - pips to be added over the break for the entry Minimum candle size - to avoid too small candles 3 different options to calculate the SL - by pips, by ATR multiplier or at the pattern High/Low 3 different options to calculate the 2 TPs - by pips, by ATR multiplier or at Risk/Reward Offset the dashboard - any place on the chart Remove the sugges
Automatic, live & interactive picture of all trendlines. Assign push, email and sound alerts to the lines of your choice and be informed about price rollback, breakout, rollback after breakout, number of rollbacks, line expiration by double breakout. Correct, drag or delete the lines and interactively tune the line system. https://youtu.be/EJUo9pYiHFA . Chart examples https: //www.mql5.com/en/users/efficientforex Price Interaction Events All events are effective immediately and only after one
The purpose of this new version of the MT4 standard indicator provided in your platform is to display in a sub-window multiple timeframes of the same indicator with its divergences. See the example shown in the picture below. But the display isn't like a simple MTF indicator. This is the real display of the indicator on its timeframe. Here's the options available in the FFx divergences indicator: Select the timeframes to be displayed (M1 to Monthly) Define the width (number of bars) for each tim
The purpose of this new version of the MT4 standard indicator provided in your platform is to display in a sub-window multiple timeframes of the same indicator with its divergences. See the example shown in the picture below. But the display isn't like a simple MTF indicator. This is the real display of the indicator on its timeframe. Here's the options available in the FFx divergences indicator: Select the timeframes to be displayed (M1 to Monthly). Define the width (number of bars) for each ti
The FFx Dashboard MTF alerter will show you on a single chart all the timeframes (M1 to Monthly) with their own status for the indicator. 2 Alert Options: Single timeframe: each selected timeframe alert separately when a signal occurs Multi timeframes: all selected timeframes must agree for an alert to be triggered Both options have an input to select the timeframes to be used for the alert(s). How to Understand the Status: Green/Red square: histogram above/below 0 line Green square + Red bord
The FFx Dashboard MTF alerter will show you on a single chart all the timeframes (M1 to Monthly) with their own status for the indicator. 2 Alert Options: Single timeframe: each selected timeframe alert separately when a signal occurs Multi timeframes: all selected timeframes must agree for an alert to be triggered Both options have an input to select the timeframes to be used for the alert(s). How to understand the status: Green/Red square: RSI above/below 50 line Green square + Red border: R
The FFx Dashboard MTF alerter will show you on a single chart all the timeframes (M1 to Monthly) with their own status for the indicator. 2 Alert Options: Single timeframe: each selected timeframe alert separately when a signal occurs Multi timeframes: all selected timeframes must agree for an alert to be triggered Both options have an input to select the timeframes to be used for the alert(s). How to understand the status: Green/Red square: Stoch above/below 50 line Green square + Red border:
The FFx Dashboard MTF alerter will show you on a single chart all the timeframes (M1 to Monthly) with their own status for the indicator. 2 Alert Options: Single timeframe: each selected timeframe alert separately when a signal occurs Multi timeframes: all selected timeframes must agree for an alert to be triggered Both options have an input to select the timeframes to be used for the alert(s). How to understand the status: Green/Red square: Price above/below Cloud (Kumo) Green square + Red bo
The FFx Dashboard MTF alerter will show you on a single chart all the timeframes (M1 to Monthly) with their own status for the indicator. 2 Alert Options: Single timeframe: each selected timeframe alert separately when a signal occurs Multi timeframes: all selected timeframes must agree for an alert to be triggered Both options have an input to select the timeframes to be used for the alert(s). How to understand the status: Green/Red square: MA pointing Up/Down Green square + Red border: MA po
The FFx Dashboard MTF alerter will show you on a single chart all the timeframes (M1 to Monthly) with their own status for the indicator. 2 Alert Options: Single timeframe: each selected timeframe alert separately when a signal occurs. Multi timeframes: all selected timeframes must agree for an alert to be triggered. Both options have an input to select the timeframes to be used for the alert(s). How to understand the status: Green square: Price above PSAR Red square: Price below PSAR Options
The FFx Dashboard MTF alerter will show you on a single chart all the timeframes (M1 to Monthly) with their own status for the indicator. 2 Alert Options: Single timeframe: each selected timeframe alert separately when a signal occurs Multi timeframes: all selected timeframes must agree for an alert to be triggered Both options have an input to select the timeframes to be used for the alert(s). How to understand the status: Green/Red square: CCI above/below levels (ie. 100/-100) Grey square: C
The FFx Dashboard MTF alerter will show you on a single chart all the timeframes (M1 to Monthly) with their own status for the indicator. 2 Alert Options: Single timeframe: each selected timeframe alert separately when a signal occurs Multi timeframes: all selected timeframes must agree for an alert to be triggered Both options have an input to select the timeframes to be used for the alert(s). How to understand the status: Green/Red square: ADX above level Grey square: ADX below level Red bor
The FFx Dashboard MTF alerter will show you on a single chart all the timeframes (M1 to Monthly) with their own status. 2 Alert Options: Single timeframe: each selected timeframe alert separately when a signal occurs Multi timeframes: all selected timeframes must agree for an alert to be triggered Both options have an input to select the timeframes to be used for the alert(s). How to understand the status: Green/Red square: bullish/bearish candle Options available in the FFx Dashboard Alerter
The indicator of a Professional Trader is an arrow indicator for predicting the direction of price movement. I have been working on this indicator since 2014. You can use this indicator as your main indicator, use its entry signals, and use it as your only indicator to find entry points. About the product: Recommended TF [H4-D1-W1]   . The indicator predicts the direction of the next candle. Fits a variety of tools; Flexibility in settings for different instruments and intervals through the MO
The [GRAFF] III manual trading system is based on multiple MetaTrader (MT4) indicators. Together, the entire PACK of GRAFF III indicators makes an advanced trading tool. The system consists of over 20 different custom-built indicators which have been carefully selected and tested in the long term to produce strong and efficient trading signals. The particular indicators are based on different mathematical formulas, so the entire system is calibrated to remove false signals from its own indicator
This indicator allows you to see the strength of the trend on all timeframes. It can be used for all currency pairs. The indicator can be displayed in the form of a column (from left to right): status buy / sell / strong buy / strong sell, strength of the trend in percentage, pips last candle, body candle now, remaining time, and the timeframe of M1 to MN. Information contained below (from left to right): total trend percent, sell percent, buy percent.
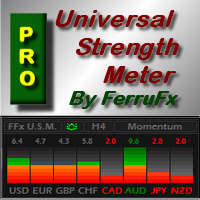
FFx Universal Strength Meter PRO is more than a basic strength meter. Instead of limiting the calculation to price, it can be based on any of the 19 integrated strength modes + 9 timeframes. With the FFx USM, you are able to define any period for any combination of timeframes. For example, you can set the dashboard for the last 10 candles for M15-H1-H4… Full flexibility! Very easy to interpret... It gives a great idea about which currency is weak and which is strong, so you can find the best pai
A simplistic indicator informing a user on RSI divergence by sending messages to mobile device and email. The indicator draws 2 vertical lines, marking two RSI extrema that formed the divergence. You get the alert, open the charts and make a decision. The indicator does not show past divergences, thus when you attach it to a chart for the first time you see nothing. Graphics and alerts will appear as soon as divergences do. Drop it in Tester to see how it works. Parameters: RSIPeriod - number of
ZLevels
Sergio Andres Zuleta Lopez
This indicator is based on Market Profile methodology, which contains the Z-Zone , unlike the latter, allows visualization of multiple time frames on the same graph. This methodology has proven to be very effective for: Reduce the number of windows required to analyze or track a financial asset. Display important resistance areas (ROZ), support (SoZ) and average distribution (PoC) in different periods of time. Define areas to take profits as well locate technical stop loss. Analysis in the devel
Pan PrizMA CD Phase is an analogue of the МetaТrader 5 indicator , and is an option based on the Pan PrizMA indicator. Details . Averaging by a quadric-quartic polynomial increases the smoothness of lines, adds momentum and rhythm. Extrapolation by the sinusoid function near a constant allows adjusting the delay or lead of signals. The value of the phase - wave status parameter (which is close in meaning to the trigonometric phase or the angle of the radius-vector rotation in the trigonometric p
Yazarın diğer ürünleri
Stop and Reverse MTF MT4
Johan George Abraham Viviers
Welcome Please note that I am currently uploading all my precious indicators. (It takes time with all the files, names, pics etc.)  Feel free to ask questions. This indicator works on all TFs and instruments, from AUDCAD to Gold (Any vehicle). When price runs into one of these lines, then we would assume a reversal might happen. For Binary Options: Imagine there is 2min 23 sec remaining of the chart candle, price hit the S/R line, then trade the remainder time.this chart is an M5 chart when pr
Smart Volatility Matrix
Johan George Abraham Viviers
Welcome Please note that I am currently uploading all my precious indicators. (It takes time with all the files, names, pics etc.)  Feel free to ask questions. Smart Volatility Matrix is an advanced multi-preset technical indicator designed for MetaTrader 4, engineered to map out market volatility dynamics across 9 distinct parameter blocks simultaneously in a clean separate window. Overview Navigating changing market conditions requires more than a single moving average or standard band. The
FREE
FX777 Volume MT4
Johan George Abraham Viviers
Welcome Please note that I am currently uploading all my precious indicators. (It takes time with all the files, names, pics etc.)  Feel free to ask questions. FX777 Markov Heatmap V35 is an institutional-grade analytical indicator designed for MetaTrader 4, built around advanced multi-factor quantitative modeling and Markov state transition matrices to map out market regime shifts in real time[cite: 12]. Core Logic & Strategy: How to Use It Professional price action and Smart Money traders k
FREE
Special RSI in Subwindow MT4
Johan George Abraham Viviers
Welcome Please note that I am currently uploading all my precious indicators. (It takes time with all the files, names, pics etc.)  Feel free to ask questions. FX777 QUANTUM RSI: Sovereign Quantum Stability v8.0 Overview Step into the next tier of institutional-grade technical analysis with FX777 Quantum RSI (v8.0) . Moving far beyond traditional, lagging indicator models, this subwindow masterpiece integrates dynamic volatility-based gates with an advanced Persistence Engine , filtering out f
FX777 Iceberg Reversal MT4
Johan George Abraham Viviers
Welcome Please note that I am currently uploading all my precious indicators. (It takes time with all the files, names, pics etc.)  Feel free to ask questions. FX777 Iceberg Reversal V3 – Sales Description Overview The FX777 Iceberg Reversal V3 is an advanced MetaTrader 4 indicator built upon the FX777 Master Trading Protocol . Designed for elite precision, it identifies institutional order flow absorption, liquidity traps, and dynamic mean reversion extremes to deliver high-probability revers
Gann Galaxy and Planetary Lines
Johan George Abraham Viviers
Welcome Please ENJOY the indicator with me for now. I will add a full Description soon. For now, the indicator is easy to just load with no adjustments needed. I have a couple of these indicators, and will, over time, we will see which ones you want or which functions they should have. The Price is very Low. Hurry!! Meanwhile have a look at the other products available as well. Happy trading. Feel free to ask if you have any questions.
Turbo Turn MTF MT4
Johan George Abraham Viviers
FX777 Turbo Turn: The Quantum Threshold of Market Momentum Step beyond the ordinary boundaries of technical analysis and enter a realm where precision engineering meets the unseen flow of financial destiny. FX777 Turbo Turn is not merely a trading tool; it is a finely tuned instrument designed to capture the hidden rhythms of the market across multiple dimensions. Crafted with an uncompromising dedication to excellence and inspired by forces that transcend standard charting, this system honors a
Correlation MAX MT4
Johan George Abraham Viviers
FX777 Correlation V3.1 MTF: The Sovereign Multi-Dimensional Protocol Step beyond ordinary correlation and immerse yourself in an elite ecosystem where multi-timeframe synchronization meets institutional-grade precision. FX777 Correlation V3.1 MTF is not just an indicator; it is a master protocol engineered to decode market alignment across multiple dimensions simultaneously. Infused with an energetic frequency of abundance, high-vibrational discipline, and good-luck karma , this system transfo
Volume Profile Level MT4
Johan George Abraham Viviers
FX777 Pillar 06: The Pot of Gold Volume Profile Protocol Step beyond conventional chart analysis and anchor your trading in the ultimate institutional footprint. FX777 Pillar 06 is not just an indicator; it is a sovereign multi-asset volume intelligence engine engineered to uncover the hidden financial gravity of the market . Infused with an energetic frequency of abundance, high-vibrational discipline, and good-luck karma , this system transforms your trading terminal into a sanctuary of weal
FREE
Correlation MTF MT4
Johan George Abraham Viviers
FX777 Correlation V2.1 MTF: The Ultimate Multi-Timeframe Binary Options Reversal Engine Step beyond conventional trading boundaries and elevate your strategy with an elite multi-timeframe intelligence system designed specifically for the precision demands of the binary options trader . FX777 Correlation V2.1 MTF is a powerhouse instrument engineered to capture institutional market correlations and translate them into crystal-clear reversal signals across every time horizon . Infused with an en
VEDIC Planetary Lines MT4
Johan George Abraham Viviers
FX777 Gann Celestial V680 Vedic: The Cosmic Geometry & Nakshatra Protocol Step beyond conventional chart analysis and anchor your trading in the ancient, cyclical geometry of the cosmos . FX777 Gann Celestial V680 Vedic is not just an indicator; it is a master astronomical and geometric intelligence engine engineered to track planetary cycles, Vedic sidereal mechanics, and dynamic price-time squaring . Infused with an energetic frequency of abundance, high-vibrational discipline, and good-luck k
Gann Planetary Lines MT4 pro S
Johan George Abraham Viviers
FX777 Gann Celestial V710 Flow: The Cosmic Inertia & Signal Protocol Step beyond traditional boundaries and immerse your strategy in the ultimate synchronization of astronomical mechanics and live market momentum. FX777 Gann Celestial V710 Flow is an advanced intelligence engine engineered to track planetary cycles, mass-inertia velocity, and dynamic Gann octave projections in real time . Infused with an energetic frequency of abundance, high-vibrational discipline, and good-luck karma , this
Liquidity Flow Zone MT4
Johan George Abraham Viviers
FX777 Liquidity 1000: The Sovereign Curved Liquidity Zone Protocol Step beyond basic support and resistance and trade right where institutional liquidity pools. FX777 Liquidity 1000 is an advanced indicator engineered to anchor dynamic, curved liquidity channels onto a heavy 1000-period Simple Moving Average (SMA) baseline, tracking the exact structural zones where price loves to reverse. Infused with an energetic frequency of abundance, high-vibrational discipline, and good-luck karma, this s
Filtrele:
Değerlendirme yok
Değerlendirmeye yanıt