Swing Size Ruler
- Göstergeler
-
Anna Makwana
 MetaTrader tools and indicators that measure the odds on your own chart: how often levels were reached, how far days and sessions usually run, and what followed past signals. Every figure comes from the symbol’s own price history and uses closed bars only, so nothing repaints. Questions are welcome
- Sürüm: 1.0
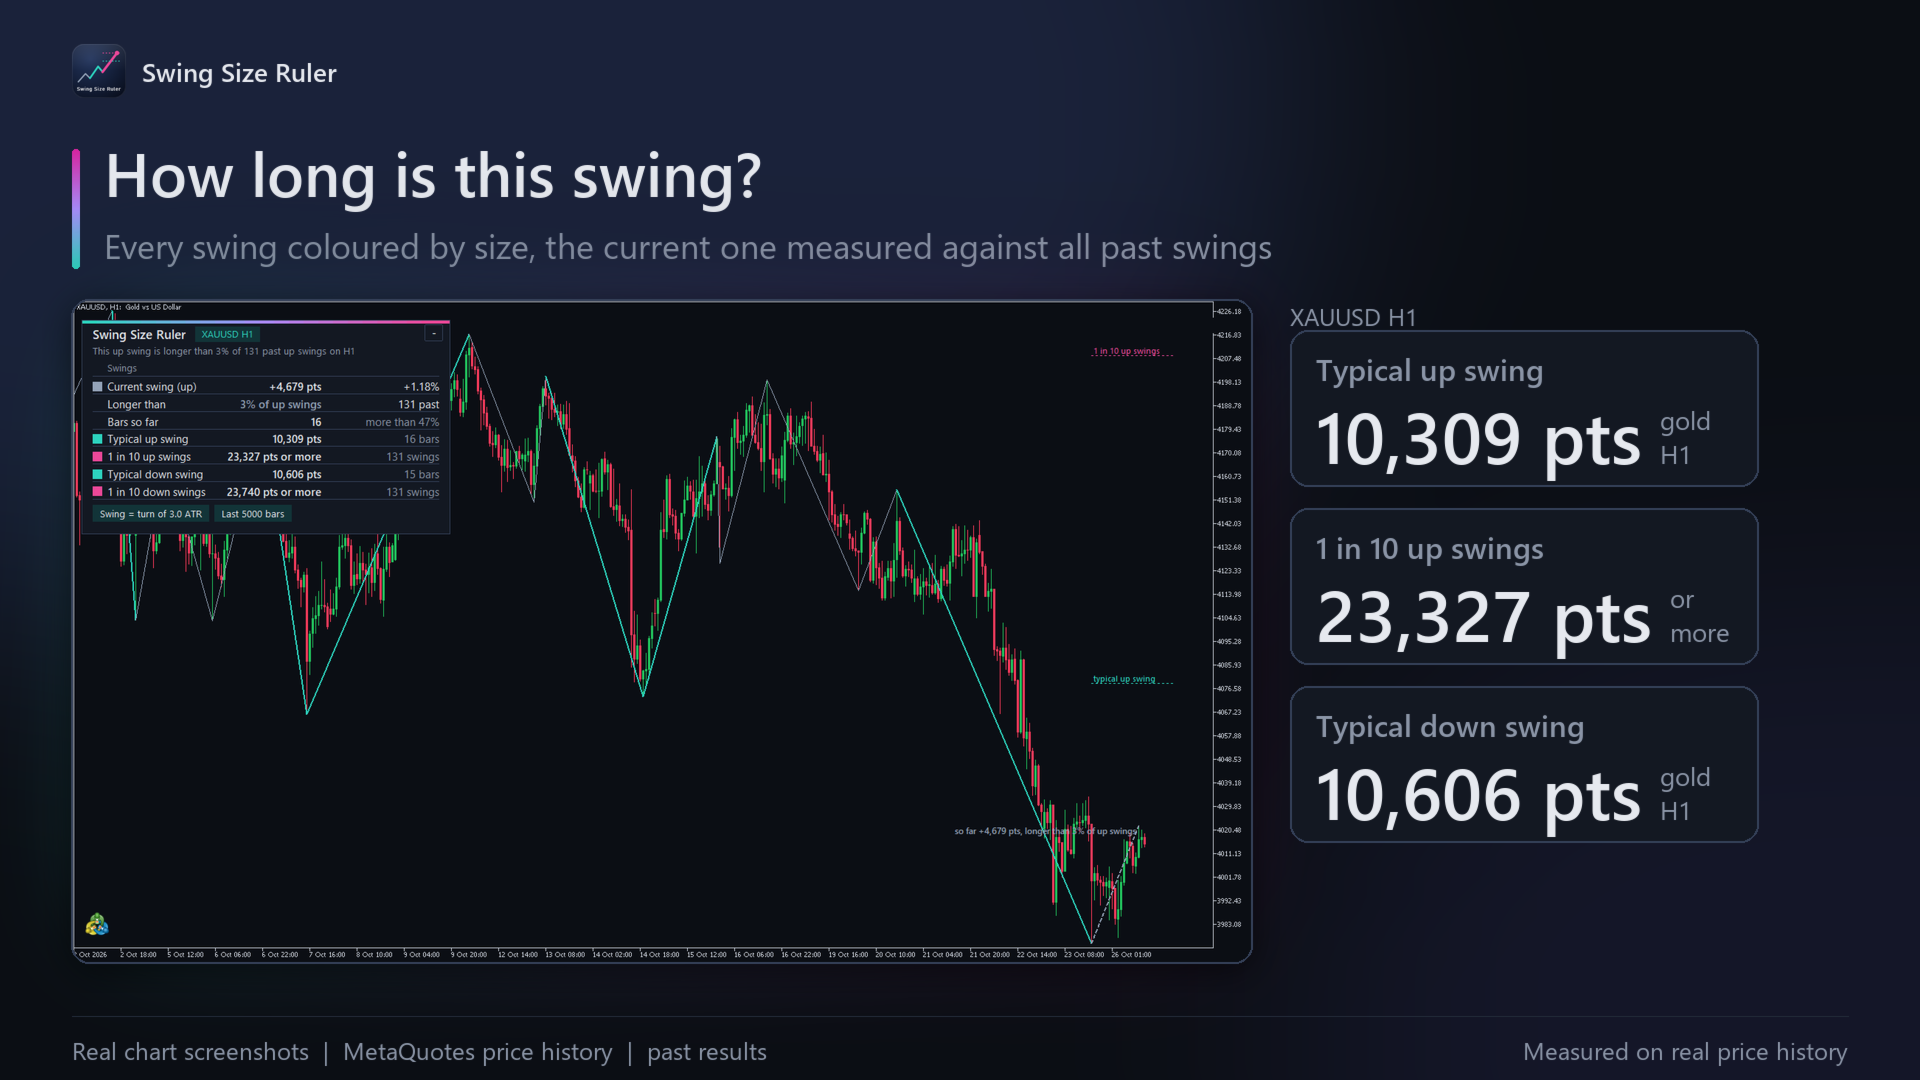
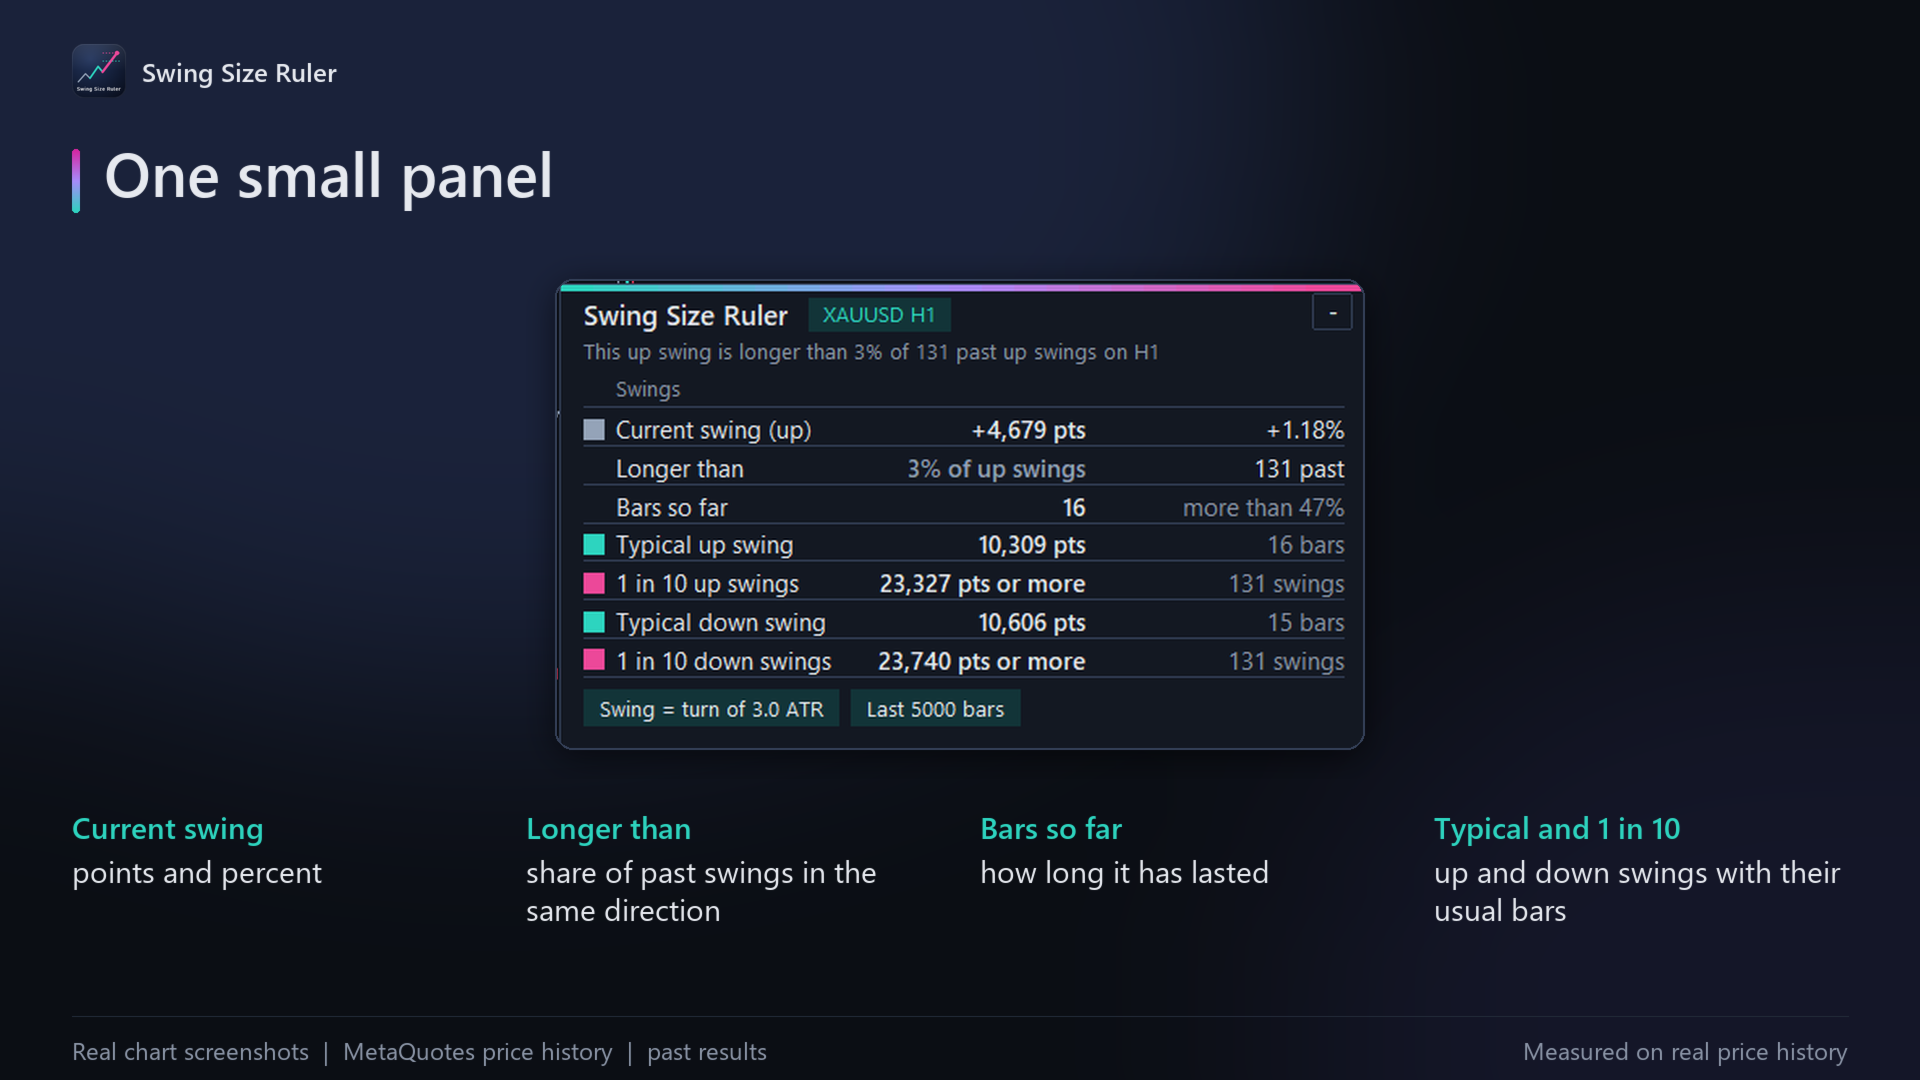
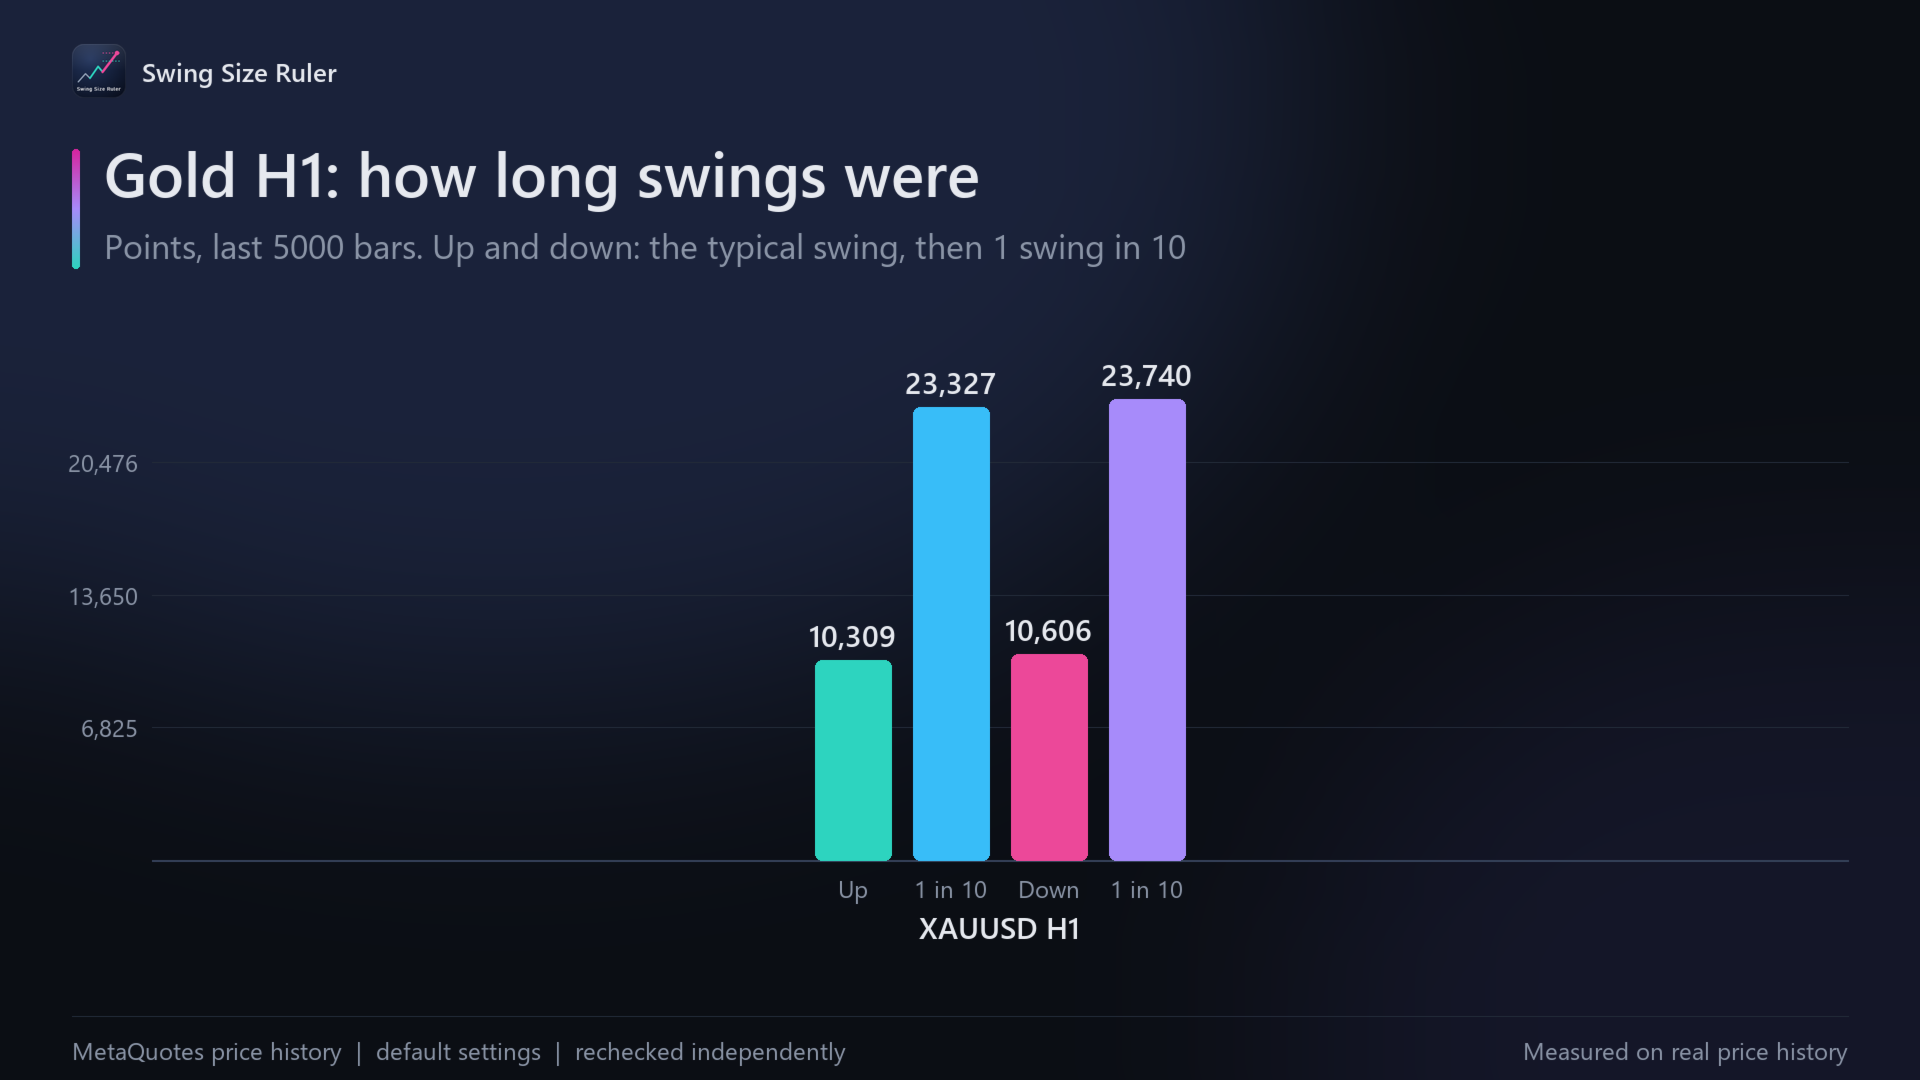
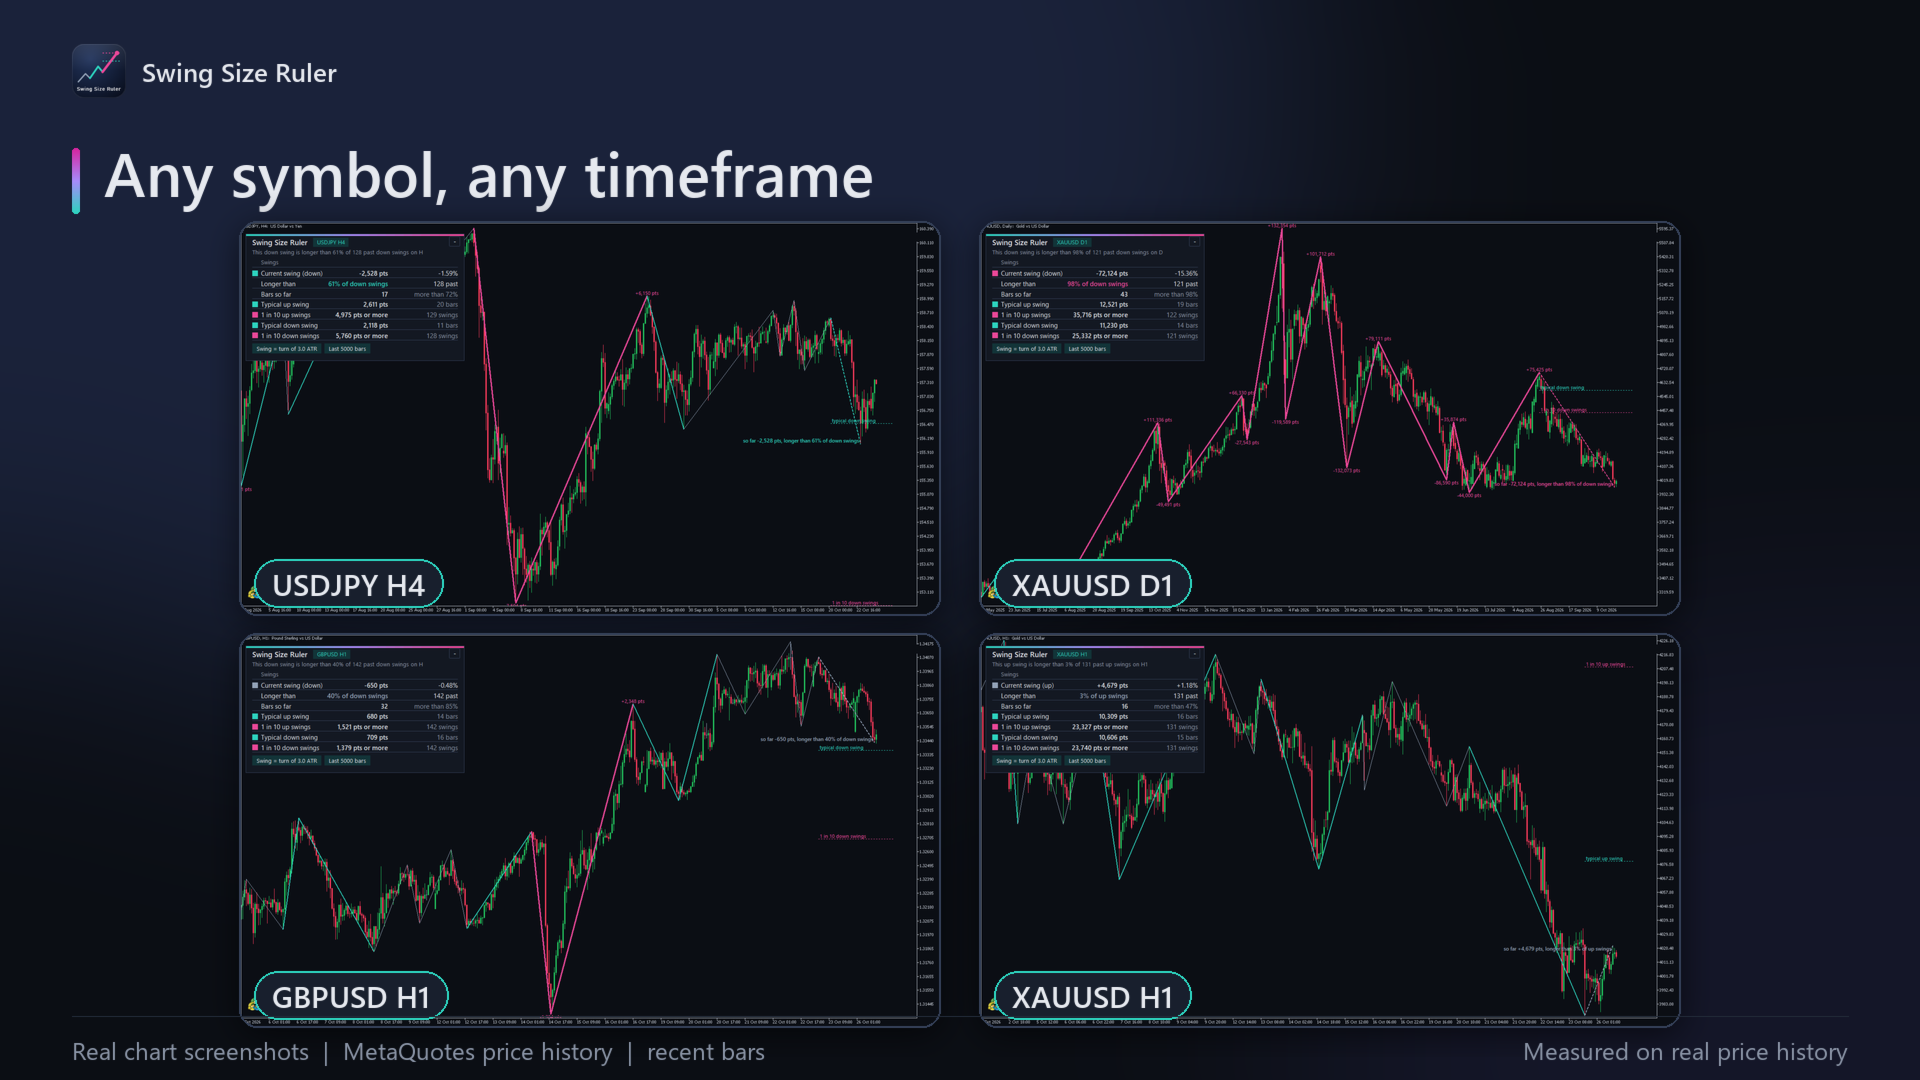
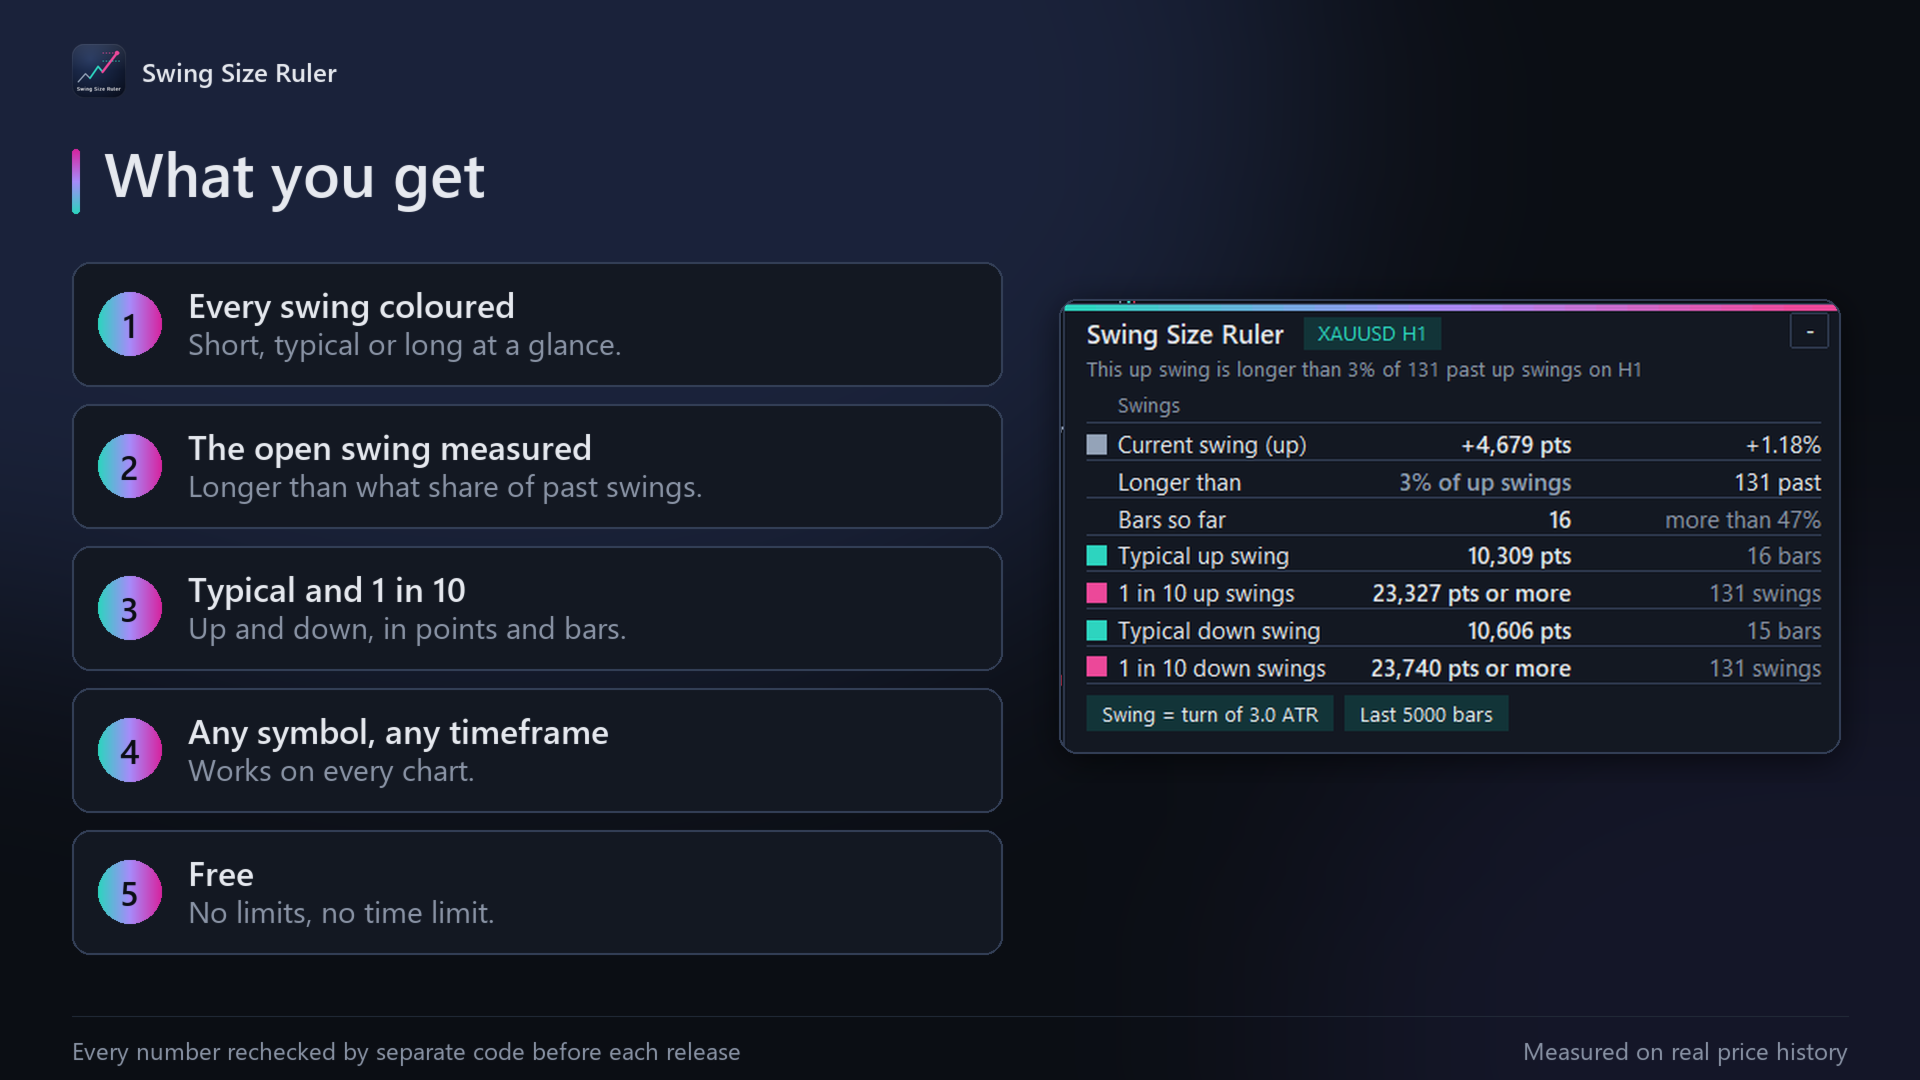
Swing Size Ruler colours every swing on the chart by its size and measures the swing you are in now against all past swings on this symbol and timeframe: "this up swing is longer than 82% of past up swings". On gold H1, a typical up swing covered 10,309 points in 16 bars, and 1 swing in 10 covered 23,327 points or more. Closed bars only, so it never repaints. Every number is verified against a separate implementation before each release.
What it does
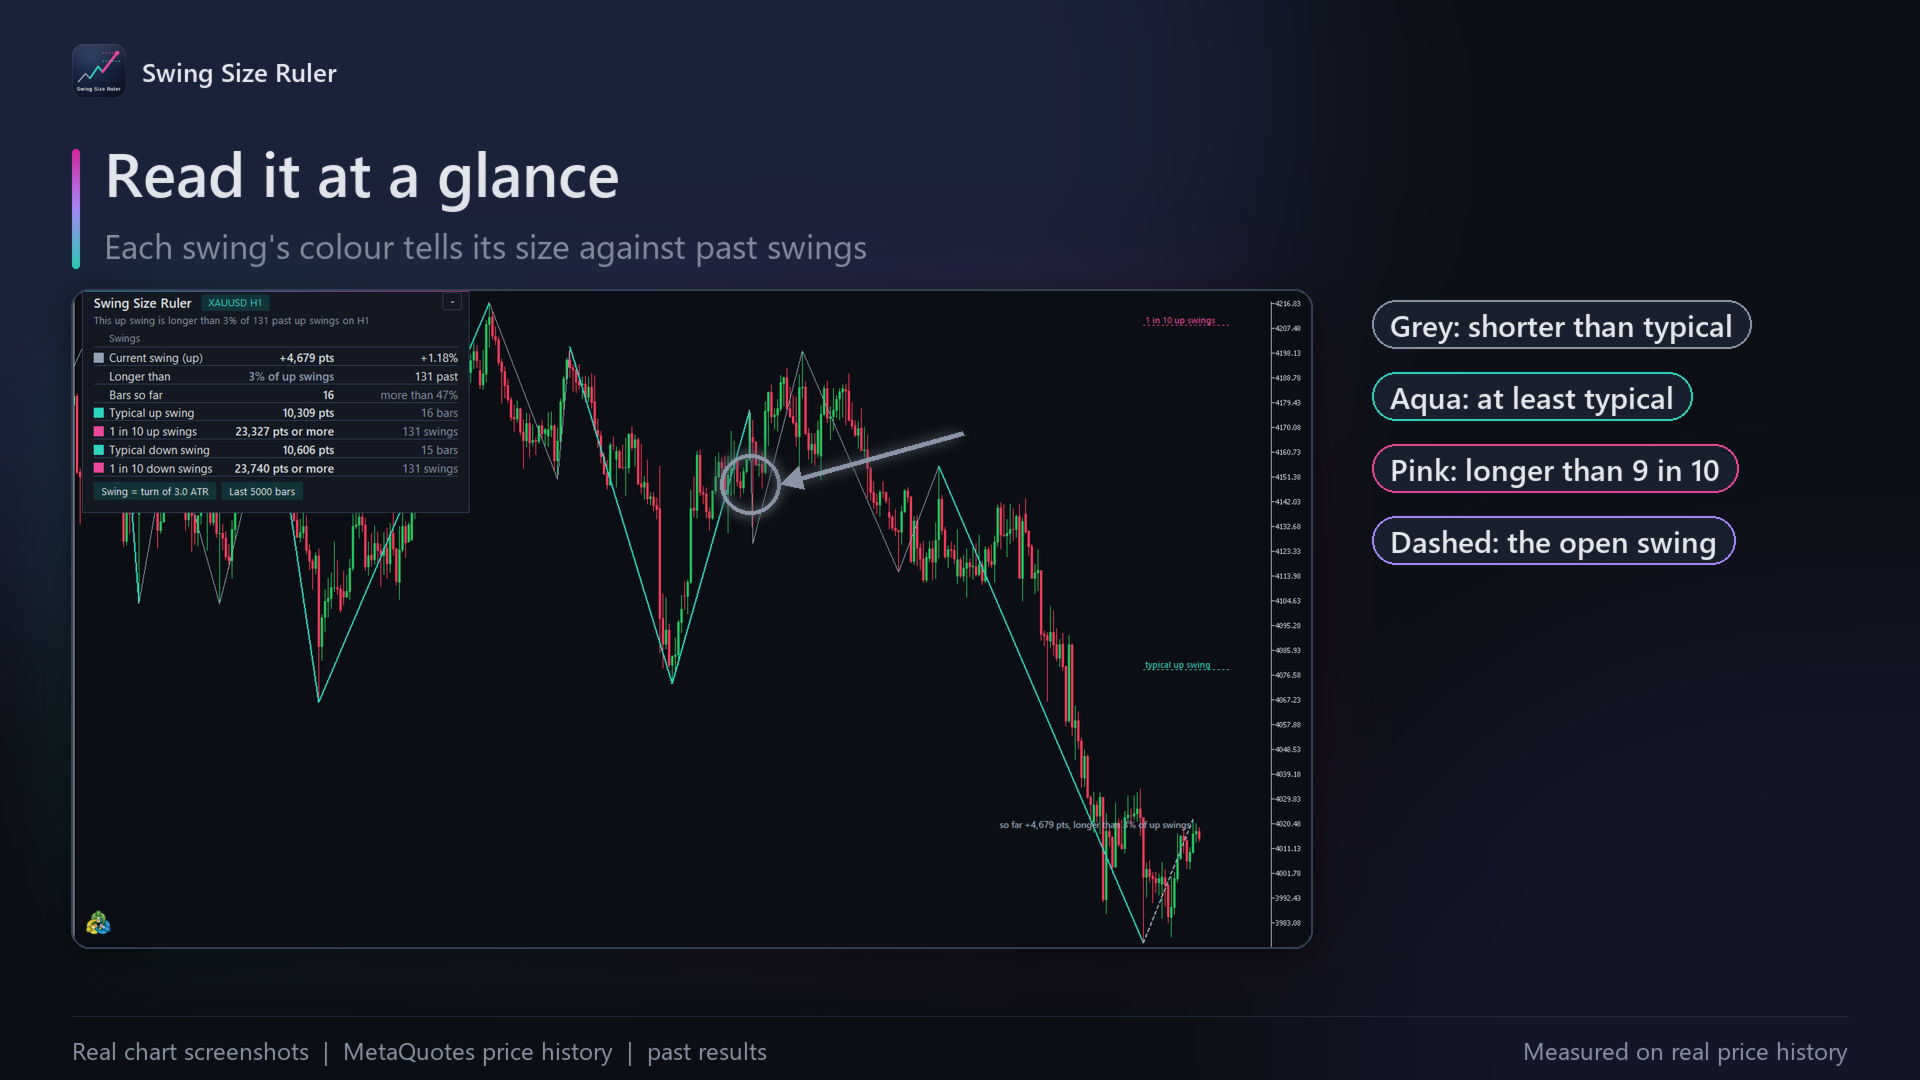
Each finished swing is drawn on the price chart as a line from its turning point to the next one. The colour shows its size against past swings in the same direction: grey for a swing shorter than the typical one, aqua for at least typical, and pink, thicker and labelled with its points, for a swing longer than 9 in 10. The swing that is still open is drawn dashed, with its size so far and the share of past swings it is already longer than. Two dotted levels start from its turning point: where a typical swing and a 1-in-10 swing in that direction would reach. A small panel shows the current swing in points and percent, the share of past swings it is longer than, the bars it has lasted, and the typical and 1-in-10 swing up and down with their typical number of bars.
How it works
A swing ends when price turns against it by at least a set number of ATRs (3 by default, ATR over 14 bars), so the swings follow each market's own volatility and the same settings fit gold, currencies and indices. Up and down swings are counted apart, over the last 5000 bars by default. Only finished bars are used: a finished swing never changes, and the open swing grows until price turns.
How it was tested
Every swing (its start, end, prices and colour) and every figure in the panel is recomputed by a separate implementation from the same broker data and matches it to the last decimal, on gold, EURUSD, US500 and USDJPY across H1, M15, D1 and H4, at swing sizes from 1 to 6 ATRs, ATR lengths from 5 to 100 bars and several history lengths.
Results and risks
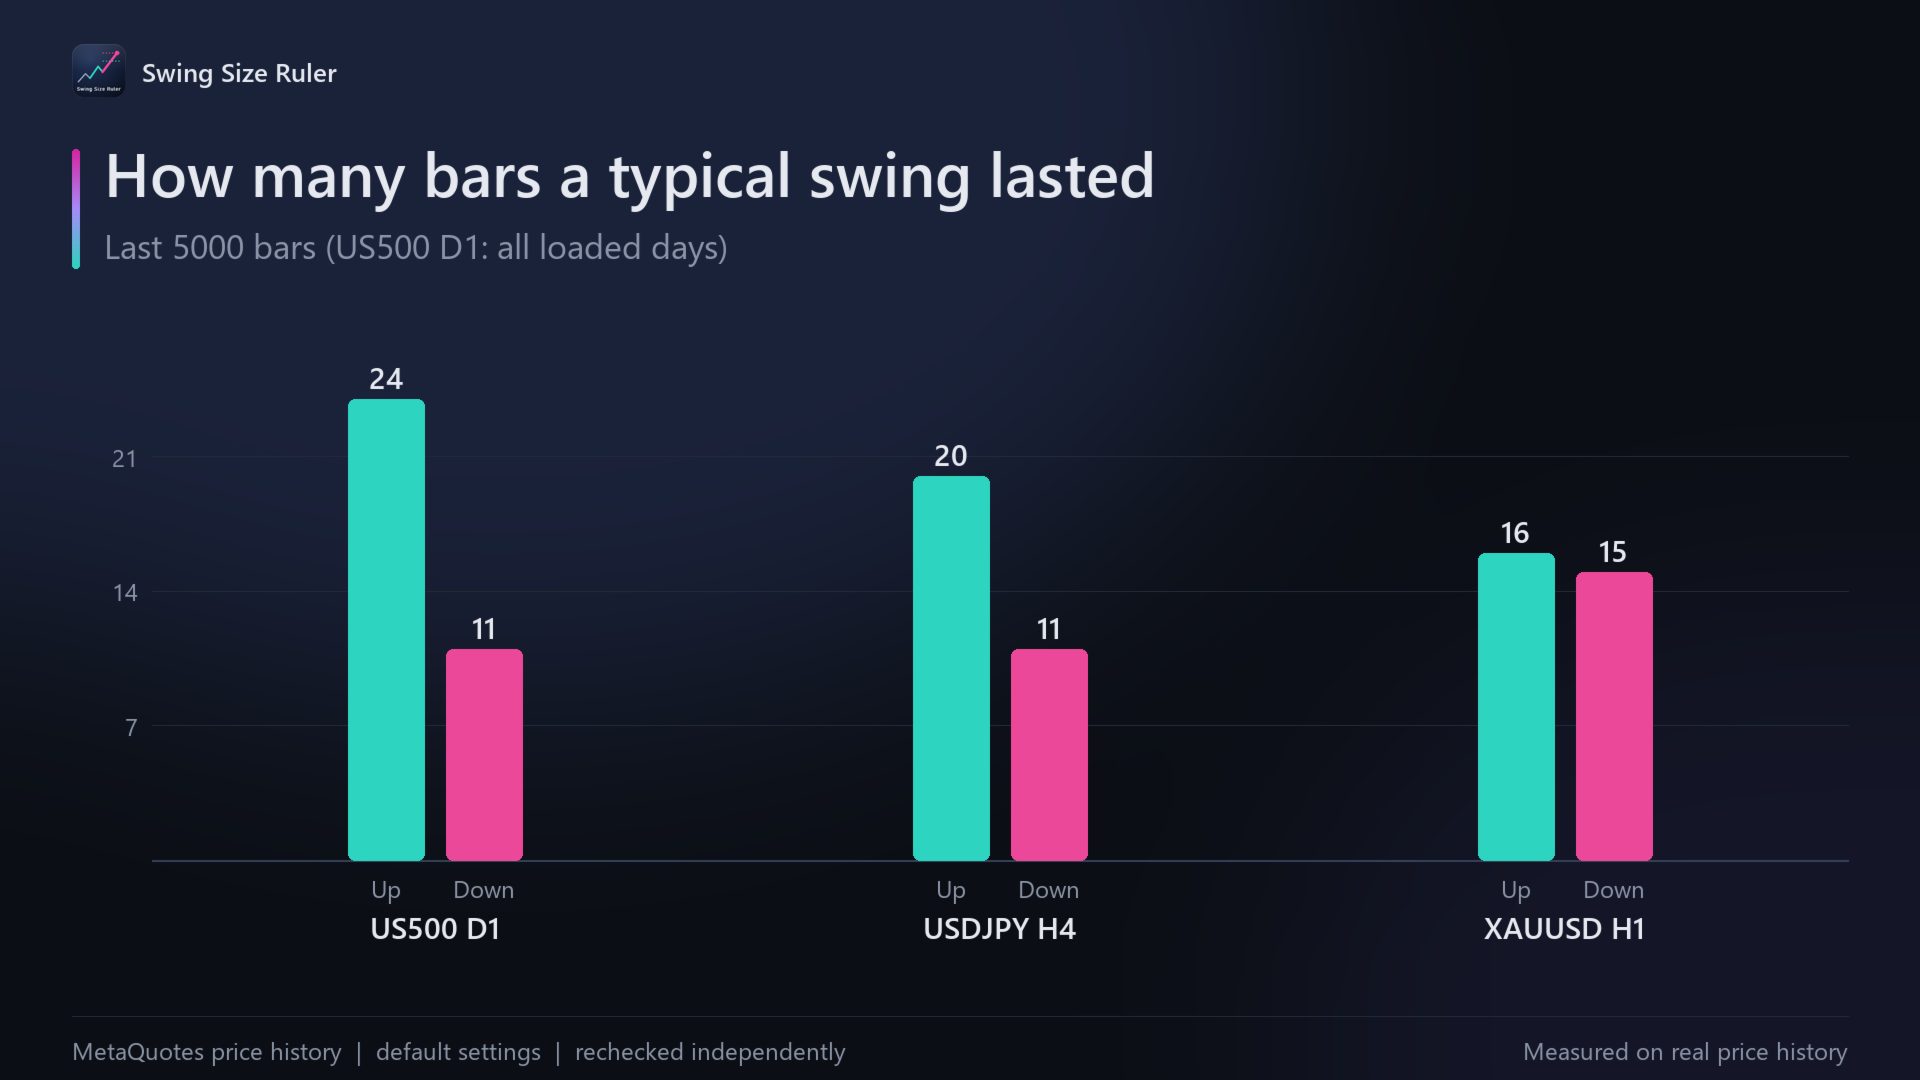
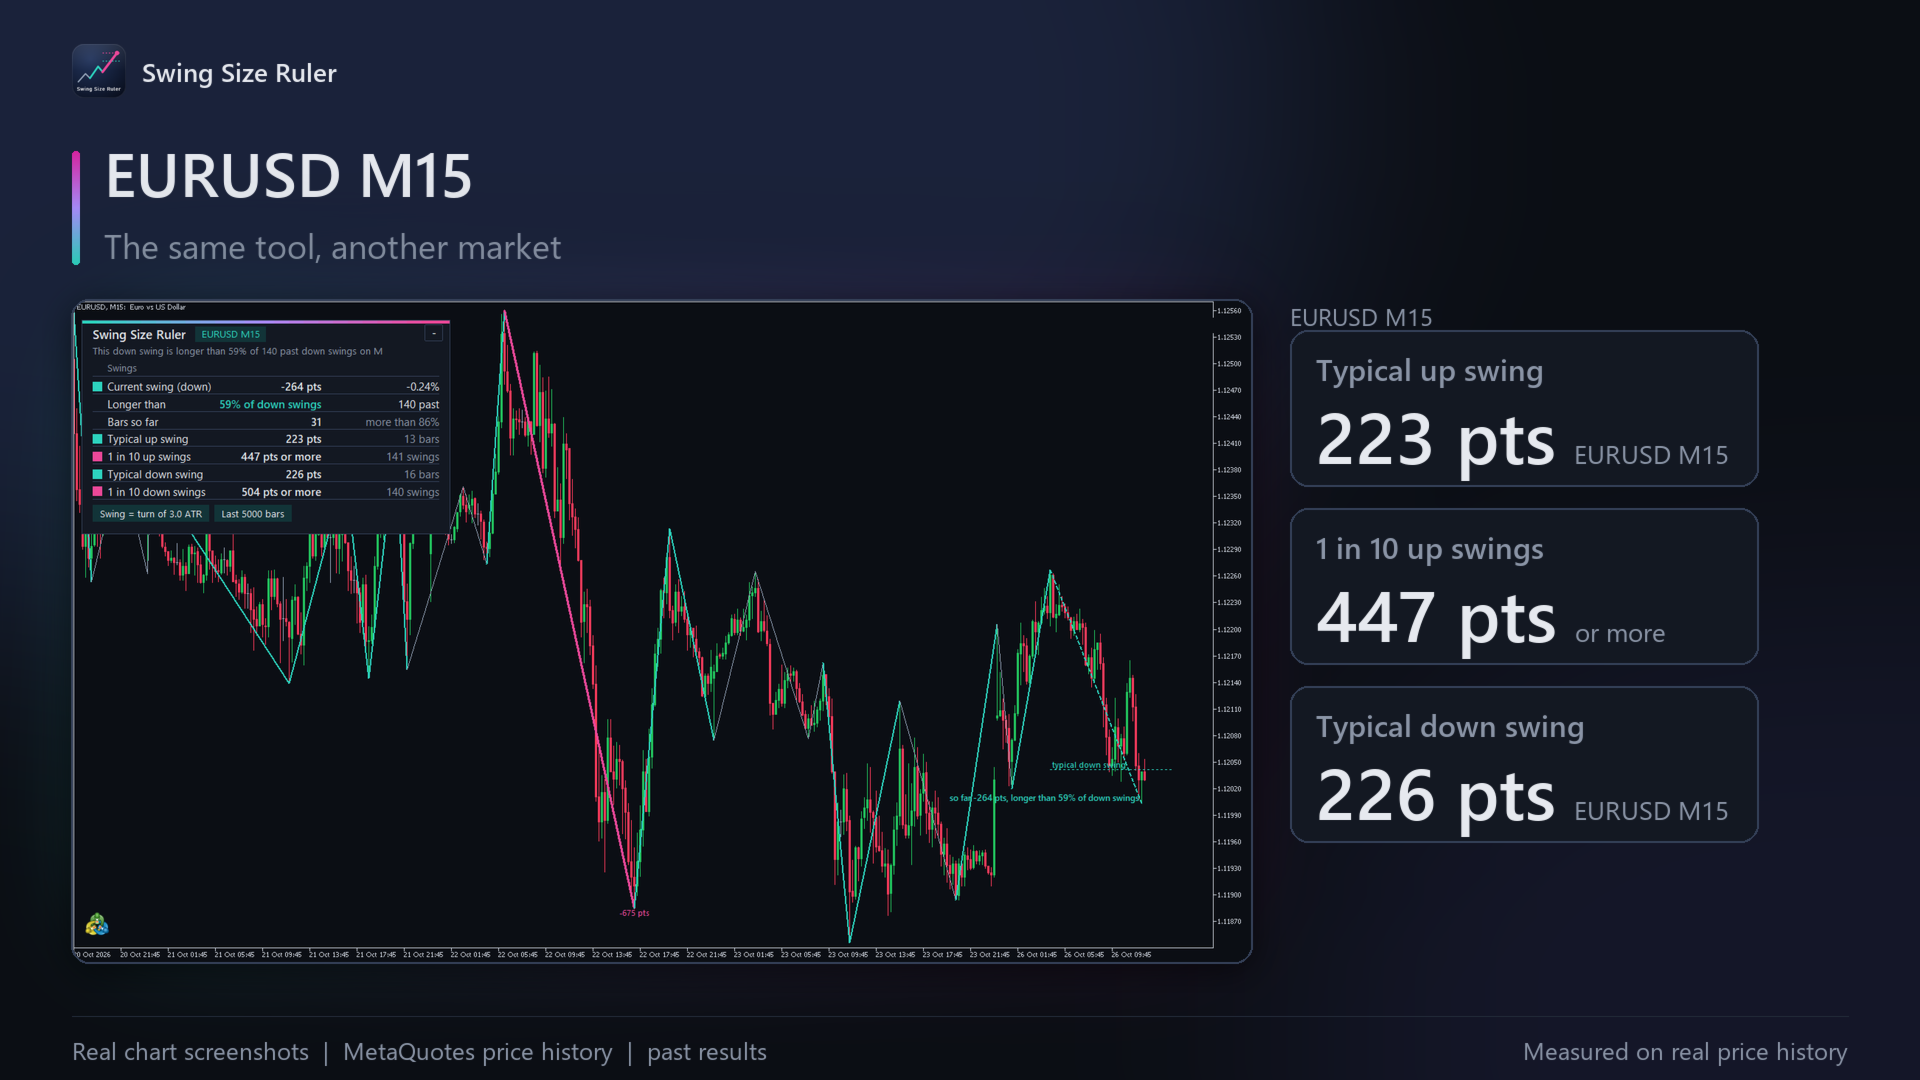
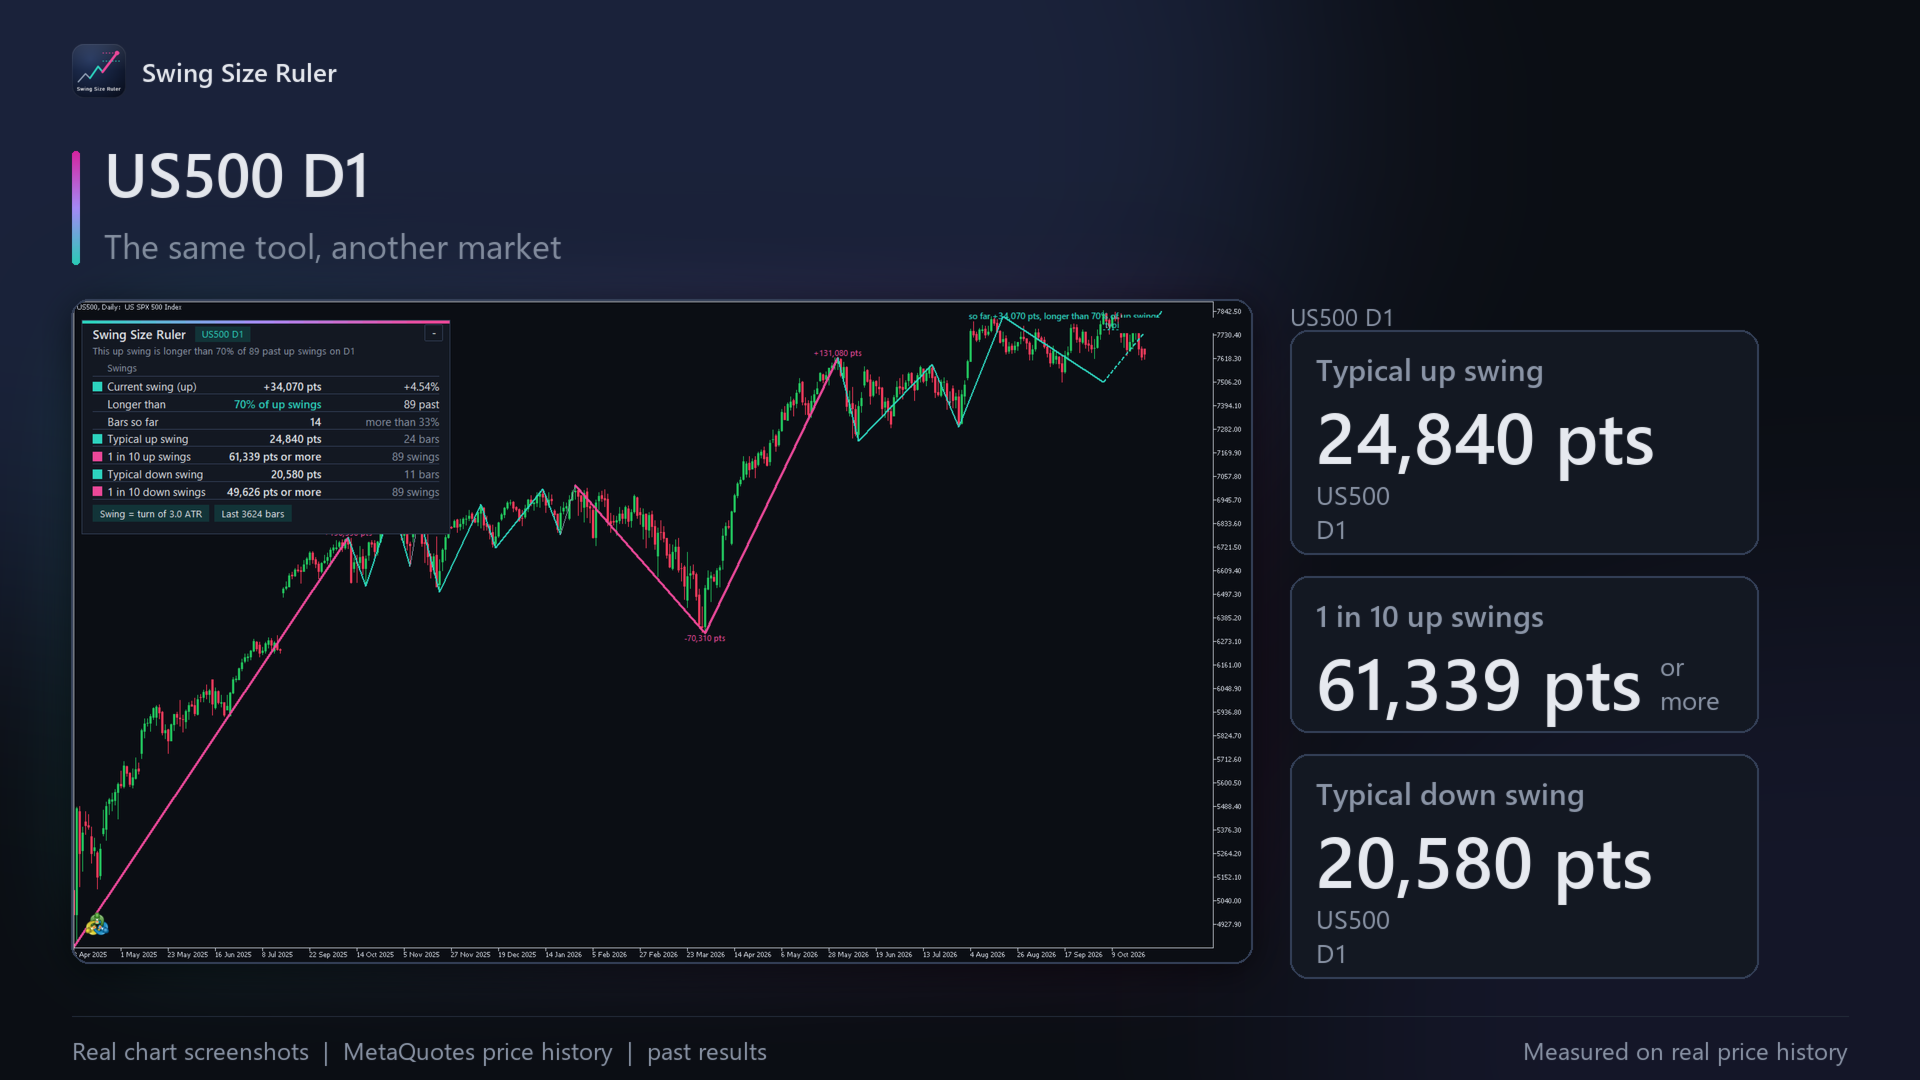
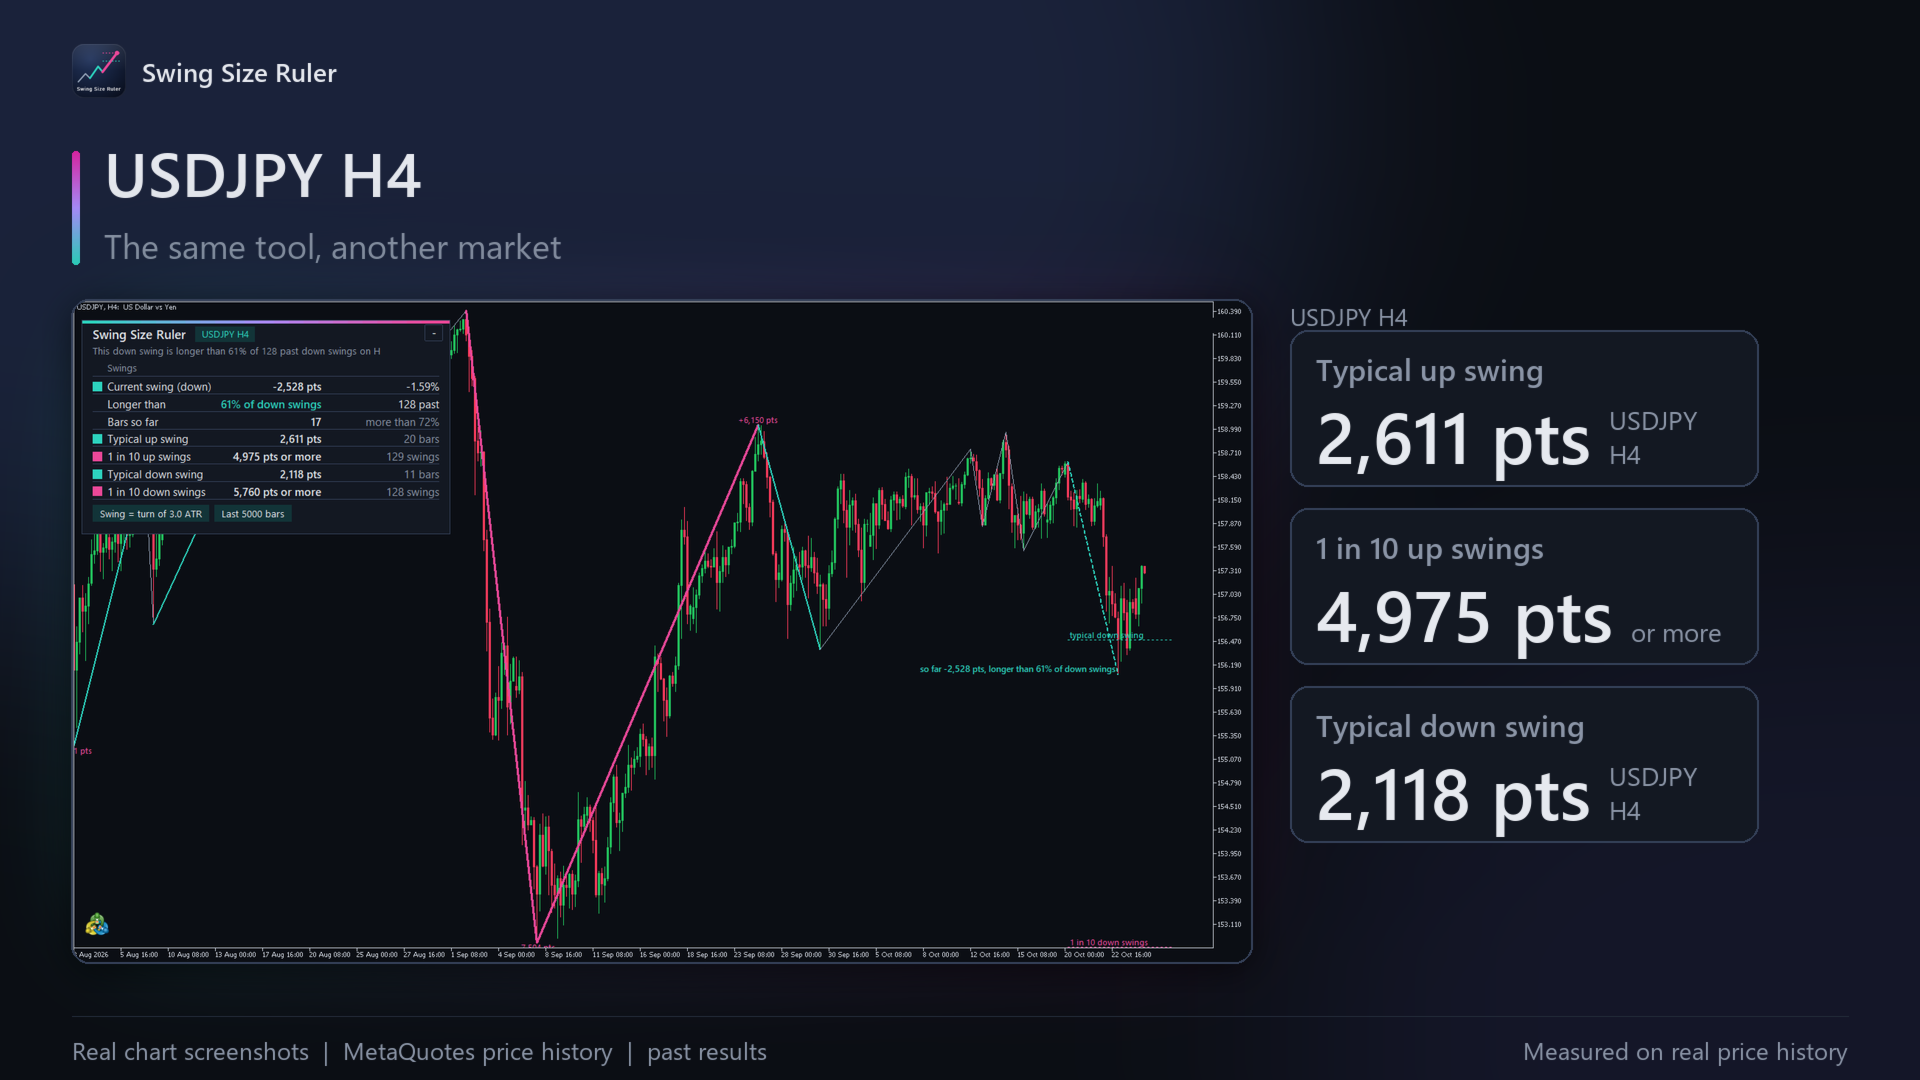
Over the last 5000 bars, a typical up swing covered 10,309 points on gold H1 and 223 points on EURUSD M15; 1 swing in 10 covered 23,327 and 447 points or more. On US500 D1, a typical up swing lasted 24 days and a typical down swing 11. These describe past swings, not the future: a swing can always go further than any before it, especially around major news.
Recommended use
Any symbol and any timeframe, from M1 to monthly, with at least 20 past swings in the direction of the current one. Typical uses: seeing at a glance which past swings were small, typical or unusually long; judging how far the current swing has already travelled compared with this market's own history; and comparing a planned stop or target with the typical swing.
Inputs
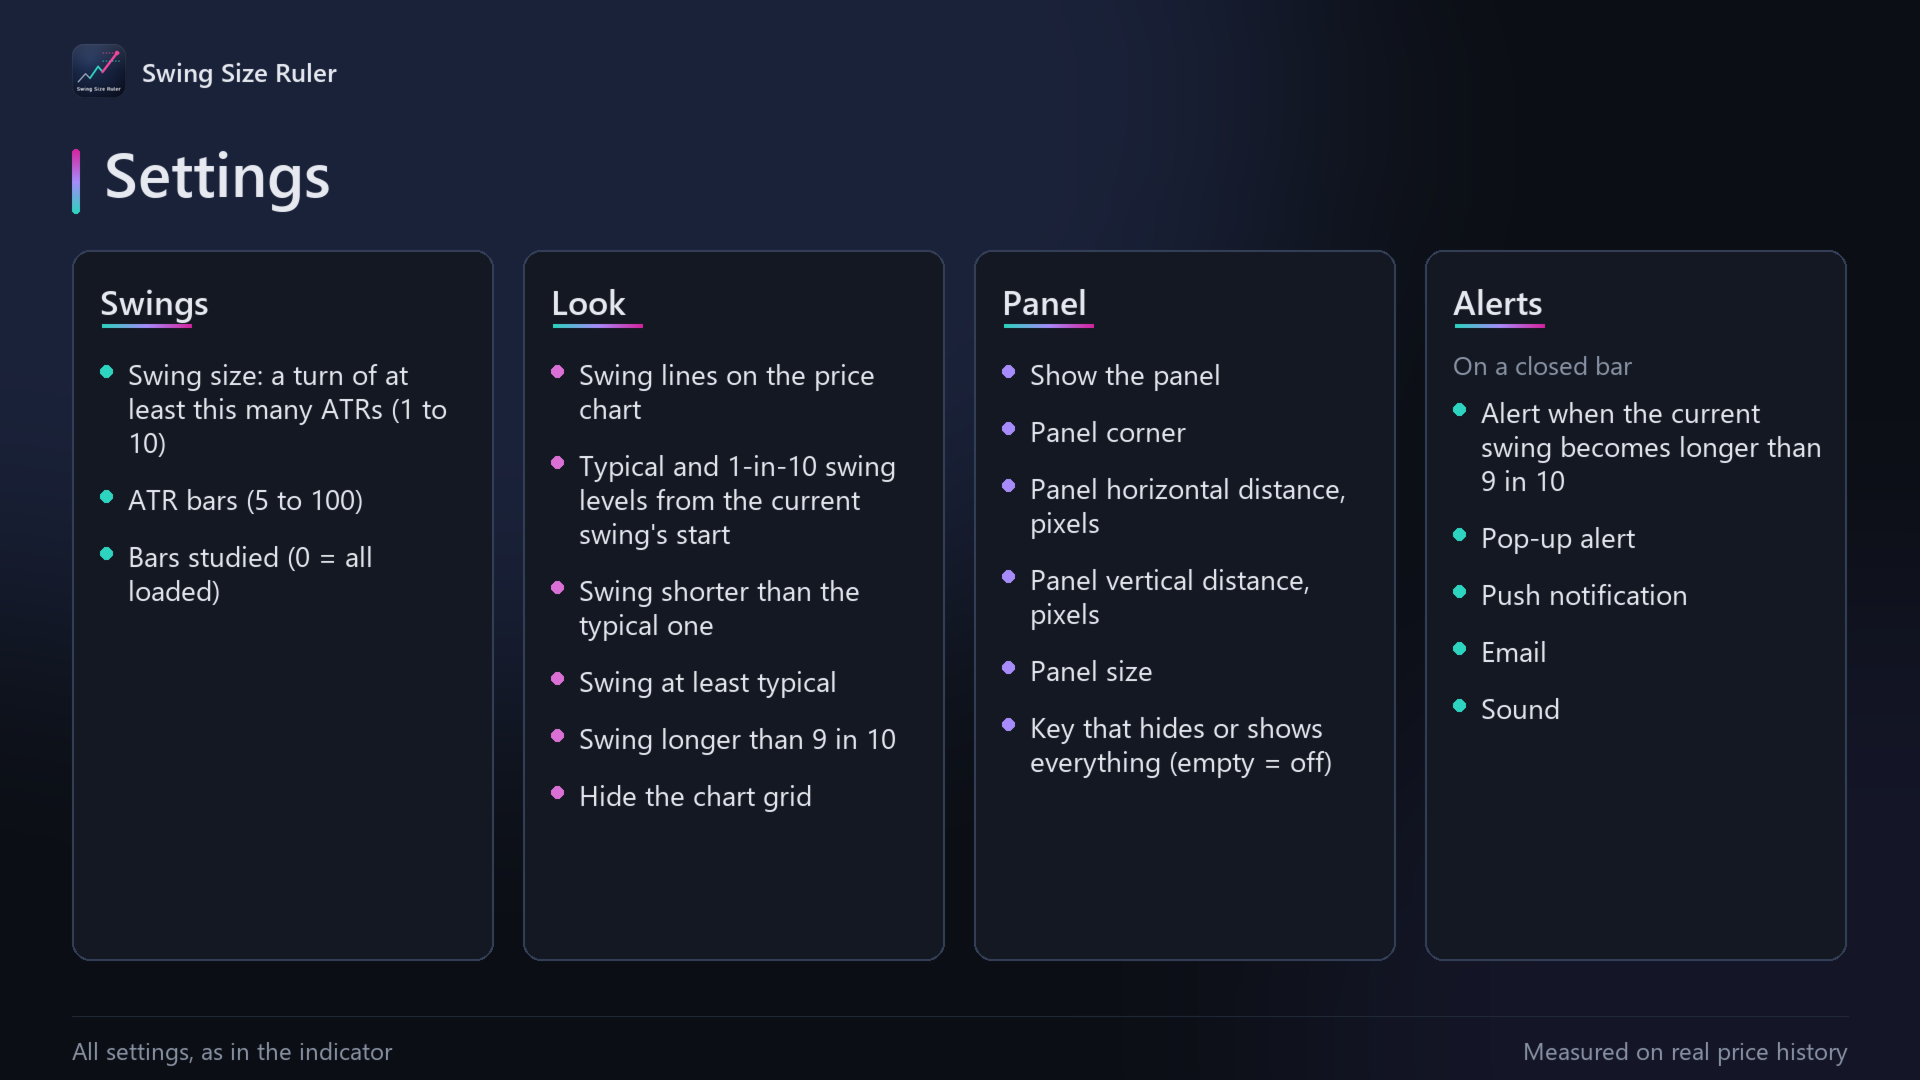
- Swing size: a turn of at least this many ATRs ends a swing (3 by default, 1 to 10).
- ATR bars: 14 by default (5 to 100).
- Bars studied: 5000 by default; 0 uses all loaded history.
- Swing lines on the chart and the typical and 1-in-10 levels: each can be switched off.
- Colours for short, typical and long swings.
- Panel: show or hide, any chart corner, distance from the edges in pixels, and size (small, normal, large). One key (H by default) hides or shows everything the indicator draws.
- Alert when the current swing becomes longer than 9 in 10 past swings: pop-up, push, email or sound, once per swing, on a closed bar.
- Hide the chart grid: on by default.
Risk notice
Trading forex, metals, indices and other leveraged products carries a high risk of loss. Swing Size Ruler is an analysis tool: it does not give investment advice or trading recommendations, and it does not guarantee any result. All figures describe past data, and past behaviour does not guarantee future behaviour. You are responsible for your own trading decisions.
Support
Questions? Message me through MQL5 chat.
Useful? A short review helps other traders find it.
A full guide with pictures: https://www.mql5.com/en/blogs/post/778508