KT CRT Indicator MT4

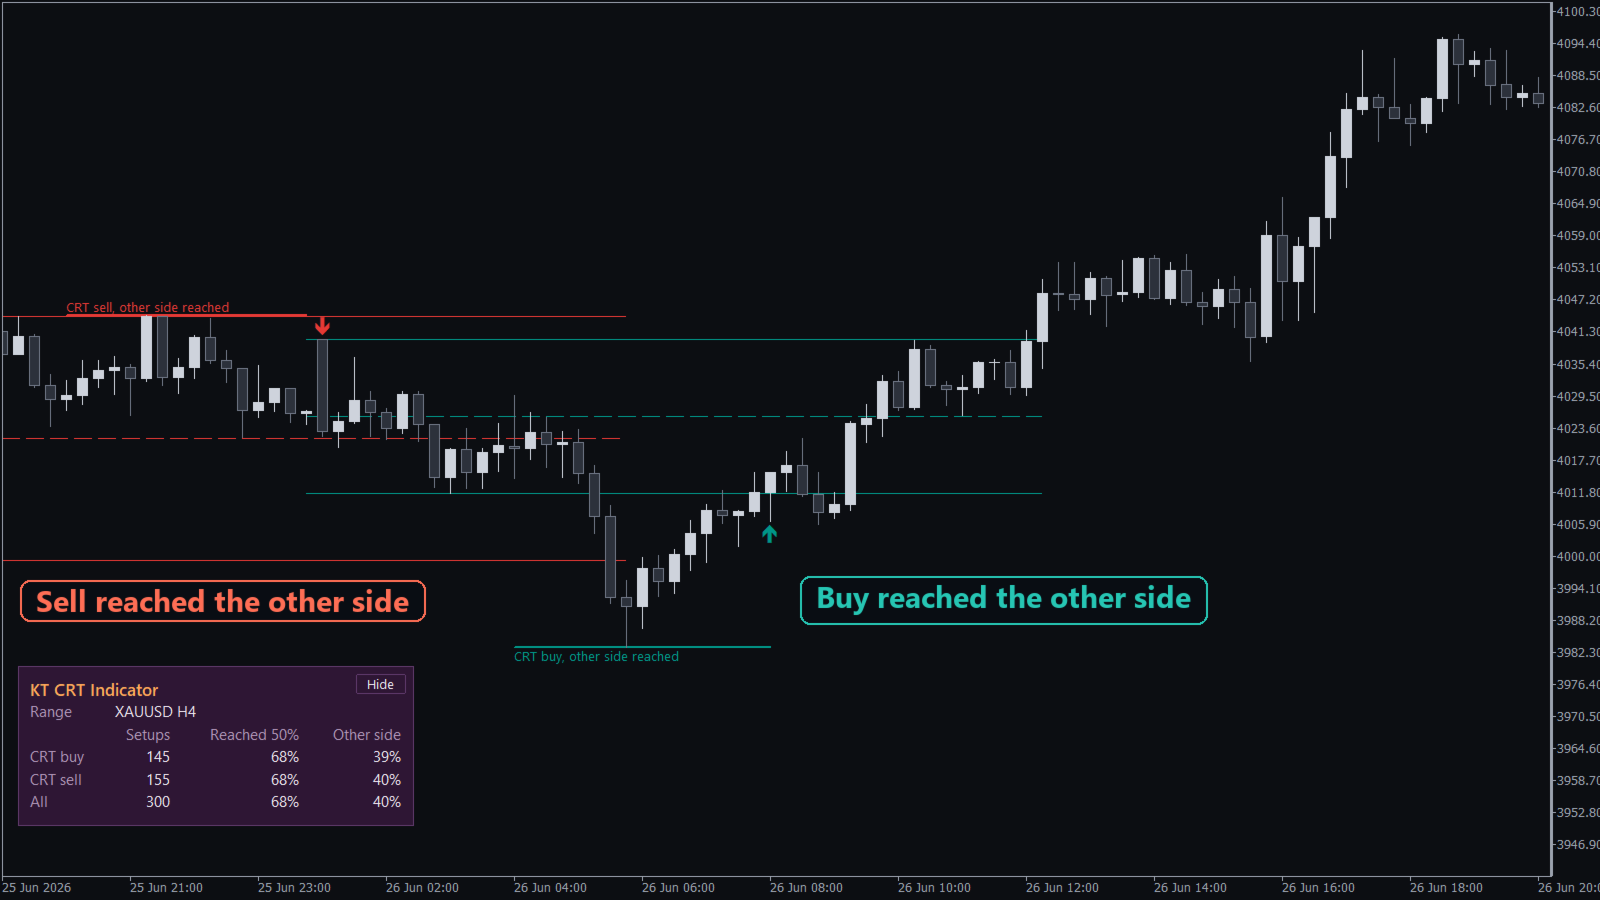
A Candle Range Theory (CRT) indicator for MetaTrader that marks each CRT setup at the candle close and keeps a record of how those setups played out on your symbol. Every setup is tracked until price reaches the middle of the range, crosses to its opposite edge or fails, and the outcome is written on the chart.

A statistics panel counts the recent CRT buys, CRT sells and all setups together, with the share that got to the 50% line and the share that got to the opposite edge. You see what the last setups did before you take the next one.

What you get

  • The higher timeframe range on your chart: the high, the low and the dashed 50% line of each H1, H4 or D1 range candle.
  • CRT buy and CRT sell arrows: when the next candle trades below the range low (CRT buy) or above the range high (CRT sell) and closes back inside the range, an arrow marks the setup.
  • No repainting: a setup is confirmed when the sweep candle closes, and it stays exactly as drawn.
  • Setups you can see forming: during a sweep, dotted range lines appear with a live timer that shows how long the candle has left, for example "closes in 1:12:30".
  • An outcome on every setup: each label follows price to its outcome, and setups that failed are drawn in grey, so a scroll back through the chart shows the history at a glance.
  • Levels on hover: point at any arrow and a box shows the 50% target, the opposite edge, the failure price and how the setup is doing.
  • New York key times: a single input limits H4 ranges to the 1:00, 5:00 and 9:00 New York opens, with broker time handled for you all year.
  • Alerts by popup, phone or email: choose to hear about new setups, pending setups and outcomes.


How to use it

Pick H1, H4 or D1 as the range timeframe, attach the indicator to a lower timeframe chart and read the panel. Turn on the pending setup alert to hear about a sweep while it happens.

Once a setup is confirmed, the 50% line is the first target, the opposite edge of the range is the second, and price moving past the sweep extreme fails it.

To compare two range timeframes, attach a second copy, for example H4 next to D1. Each copy keeps its own panel, and the panels sit one above the other.

Recommendations

Use KT CRT Indicator on gold, stock indices and forex pairs. For H1 and H4 ranges, trade from M5 or M15 charts. For D1 ranges, M15 or H1 charts work well. Each symbol and broker gives its own numbers, so read the panel on the chart you trade.

Input parameters

  • Range candle timeframe: H1, H4 or D1, the timeframe whose candles set the range.
  • Only H4 ranges at 1:00, 5:00 and 9:00 New York: turns the key time filter on or off.
  • Broker daylight saving: Auto, US (New York close) or Europe.
  • Strategy Tester only, broker GMT offset in winter: the broker's winter offset, used in the Strategy Tester only.
  • Show a pending setup with a countdown: shows or hides the pending setup.
  • Show buy and sell arrows at confirmation: shows or hides the arrows.
  • Show the statistics panel and Panel position: the panel and the corner of the chart where it sits.
  • Setups drawn on the chart: how many setups stay on the chart, from 5 to 300.
  • CRT buy, CRT sell and failed setup colours: the colour of each kind of setup.
  • Alerts: pick the events (new CRT setup, pending setup, 50% line, opposite edge or fail) and the delivery (popup with sound, push notification, email).


Know your CRT numbers before the next trade

Every confirmed setup on your chart, a timer on the one that is forming, and the outcome record of your own symbol in one panel. Add KT CRT Indicator to your chart and take the next CRT trade with the numbers in front of you.
Yazarın diğer ürünleri
KT Support and Resistance Levels MT5
KEENBASE SOFTWARE SOLUTIONS
5 (1)
KT Auto Support Resistance Levels: MetaTrader 4/5 için Çoklu Zaman Dilimi S&R, Smart Zones ve Seviye Paneli Swing tepeleri. Pivotlar. Order block’lar. Önceki tepe ve dipler. Her trader piyasayı biraz farklı şekilde işaretler ve bunun bedelini genellikle grafik öder. Tek ekrana yeterince fazla yöntem yığarsanız, grafik artık bir harita olmaktan çıkar. Gürültüye dönüşür. KT Auto Support Resistance Levels bunu çözer. Aylık, haftalık, günlük ve mevcut zaman diliminizi aynı anda tarar, ardından gerçe
ACB Breakout Arrows MT5
KEENBASE SOFTWARE SOLUTIONS
3.5 (2)
İşlem bağlamıyla birlikte kırılma sinyalleri ACB Breakout Arrows, fiyatın sakinleştiği bir aşamadan sonra oluşan yönlü kırılmayı algılar ve kurulumu alış veya satış oku ile işaretler. Ok, algılanan bir kırılma formasyonunu gösterir. Her sinyalin büyük bir harekete dönüşeceğini garanti etmez. Alış oku yükseliş yönlü bir kırılma kurulumunu, satış oku ise düşüş yönlü bir kurulumu gösterir. Fiyat kırılma alanını yeniden test edebileceği veya önceki aralığa dönebileceği için girişten önce piyasa yapı
ACB Trade Filter MT5
KEENBASE SOFTWARE SOLUTIONS
Bir işlem açmadan önce ACB Trade Filter pratik bir soruyu yanıtlamanıza yardımcı olur: Piyasa bu işlemi destekliyor mu, yoksa karışık koşullarda bir sinyali zorla kabul etmeye mi çalışıyorsunuz? Gösterge piyasa duyarlılığını ve trendi analiz eder, ardından sonucu renkli histogram ve trend yönü ile sunar. Normal giriş sinyalinizden sonra doğrulama amacıyla kullanın, giriş sisteminizin yerine koymayın. Üç piyasa durumunu hızlıca görün Yeşil histogram ve yükseliş trendi: koşullar stratejinize uygun
KT Auto Support Resistance Levels: MetaTrader 4/5 için Çoklu Zaman Dilimi S&R, Smart Zones ve Seviye Paneli Swing tepeleri. Pivotlar. Order block’lar. Önceki tepe ve dipler. Her trader piyasayı biraz farklı şekilde işaretler ve bunun bedelini genellikle grafik öder. Tek ekrana yeterince fazla yöntem yığarsanız, grafik artık bir harita olmaktan çıkar. Gürültüye dönüşür. KT Auto Support Resistance Levels bunu çözer. Aylık, haftalık, günlük ve mevcut zaman diliminizi aynı anda tarar, ardından gerçe
KT Stoch Divergence MT4
KEENBASE SOFTWARE SOLUTIONS
Fiyat yeni bir zirve yaparken Stokastik bu hareketi onaylamıyorsa, traderların neden uyumsuzlukları takip ettiğini zaten biliyorsunuz. KT Stoch Divergence, fiyat ile gösterge arasındaki bu farkları doğrudan grafikte işaretler. Böylece her çizgiyi elle çizmeden olası dönüşleri ve trend devamı fırsatlarını daha kolay görebilirsiniz. Gösterge, fiyat ile Stokastik osilatör arasındaki normal ve gizli uyumsuzlukları bulur. Size otomatik bir işlem emri değil, karar verirken kullanabileceğiniz ek bilgi
ACB Breakout Arrows
KEENBASE SOFTWARE SOLUTIONS
4.15 (34)
İşlem bağlamıyla birlikte kırılma sinyalleri ACB Breakout Arrows, fiyatın sakinleştiği bir aşamadan sonra oluşan yönlü kırılmayı algılar ve kurulumu alış veya satış oku ile işaretler. Ok, algılanan bir kırılma formasyonunu gösterir. Her sinyalin büyük bir harekete dönüşeceğini garanti etmez. Alış oku yükseliş yönlü bir kırılma kurulumunu, satış oku ise düşüş yönlü bir kurulumu gösterir. Fiyat kırılma alanını yeniden test edebileceği veya önceki aralığa dönebileceği için girişten önce piyasa yapı
ACB Trade Filter MT4
KEENBASE SOFTWARE SOLUTIONS
5 (1)
Bir işlem açmadan önce ACB Trade Filter pratik bir soruyu yanıtlamanıza yardımcı olur: Piyasa bu işlemi destekliyor mu, yoksa karışık koşullarda bir sinyali zorla kabul etmeye mi çalışıyorsunuz? Gösterge piyasa duyarlılığını ve trendi analiz eder, ardından sonucu renkli histogram ve trend yönü ile sunar. Normal giriş sinyalinizden sonra doğrulama amacıyla kullanın, giriş sisteminizin yerine koymayın. Üç piyasa durumunu hızlıca görün Yeşil histogram ve yükseliş trendi: koşullar stratejinize uygun
KT Momentum Arrows
KEENBASE SOFTWARE SOLUTIONS
KT Momentum Arrows, bir mum uyarlanabilir fiyat bantlarının dışında kapandığında yükseliş ve düşüş yönlü momentum kırılımlarını oklarla işaretler. Bantlar fiyat sapmasına ve değişen volatiliteye tepki verir. Mavi yukarı ok üst bandın üzerinde kapanışı, kırmızı aşağı ok ise alt bandın altında kapanışı onaylar. Sinyal mum kapandıktan sonra sabitlenir, böylece grafiği daha sonra incelediğinizde ok başka bir bara taşınmaz. Okun gösterdiği hareket Ok, momentumun fiyatı bandın dışına taşıdığı mumu gös
KT COG Advanced MT4
KEENBASE SOFTWARE SOLUTIONS
1 (1)
KT COG is an advanced implementation of the center of gravity indicator presented by John F. Ehlers in the May 2002 edition of Technical Analysis of Stocks & Commodities magazine. It's a leading indicator which can be used to identify the potential reversal points with the minimum lag. The COG oscillator catches the price swings quite effectively. MT5 version of the same indicator is available here KT COG Advanced MT5 Calculation of COG The COG indicator is consist of the two lines. The main l
KT Pin Bar
KEENBASE SOFTWARE SOLUTIONS
KT Pin Bar identifies the pin bar formation which is a type of price action pattern which depicts a sign of reversal or rejection of the trend. When combined with support and resistance, BRN and other significant levels, Pin Bar pattern proved to be a very strong sign of reversal. Basically, a pin bar is characterized by a small body relative to the bar length which is closed either in upper or lower 50% part of its length. They have very large wicks and small candle body. A pin bar candlestic
KT Trend Magic
KEENBASE SOFTWARE SOLUTIONS
Trend yönünü doğrudan grafikte okuyun KT Trend Magic, momentum ile volatiliteyi fiyatı izleyen renkli bir çizgide birleştirir. Çizgi aktif trend durumunu sürekli gösterir ve hesaplanan yön değiştiğinde renk değiştirir. Yeşil çizgi: yükseliş trendi durumunu gösterir. Kırmızı çizgi: düşüş trendi durumunu gösterir. Renk değişimi: grafikte yeni bir yön geçişini işaretler. Süregelen bir hareket sırasında çizgi, geri çekilmeler ve devam hareketleri için dinamik bir grafik referansı olarak da kullanıla
KT Auto Fibo
KEENBASE SOFTWARE SOLUTIONS
Auto Fibonacci indicator that draws the Fibonacci retracement on the swing you are looking at, and redraws it the moment you zoom or scroll the chart. Zoom in on a pullback and the levels measure that pullback. Zoom out and they measure the whole trend. There are no anchor points to drag and no levels to redraw after every new high. Key features Measures the highest high and the lowest low on your screen, the current candle included. Follows zoom, scroll and window size at once, even when the ma
KT Psar Arrows
KEENBASE SOFTWARE SOLUTIONS
KT Psar Arrows, standart Parabolic SAR göstergesini kullanarak grafikte oklar çizer. Mumun en yüksek noktası SAR'a temas ettiğinde yükseliş oku çizilir. Mumun en düşük noktası SAR'a temas ettiğinde düşüş oku çizilir. Sinyaller, mum kapanışını beklemeden gerçek zamanlı olarak üretilir.  Özellikler Parabolic SAR göstergesini kullanan ticaret stratejilerini denemek isteyen yatırımcılar için faydalı bir araçtır.  Piyasadaki dönüş noktalarını bulmak için kullanılabilir. Özel PSAR girişlerini destekl
KT Ichimoku Trader
KEENBASE SOFTWARE SOLUTIONS
1 (1)
Otomatik işlem yapılan beş Ichimoku stratejisi KT Ichimoku Trader, beş klasik Ichimoku Kinko Hyo stratejisiyle işlemleri otomatik olarak açıp kapatan bir Expert Advisor'dır. İstediğiniz stratejileri açarsınız ve her biri kendi başına işlem yapar: kendi giriş kuralları, kendi çıkış kuralları ve aynı anda strateji başına en fazla bir açık işlem ile. Her giriş kapanmış bir mum üzerinde kontrol edilir. Yeni bir mum açıldığında EA az önce kapanan mumu okur ve yalnızca stratejinin tüm giriş kuralları
KT Volatility Oscillator
KEENBASE SOFTWARE SOLUTIONS
KT Volatilite Osilatörü, geçmiş ve mevcut piyasa verilerini matematiksel bir formül kullanarak analiz eder ve sonucu bir osilatör formunda gösterir. Yükselen ve azalan dalgalar, varlığın yüksek ve düşük volatilitesine karşılık gelir.  Kısaca, volatilite bir varlığın belirli bir zaman diliminde fiyat dalgalanmalarının ölçüsüdür. Volatilite olmasaydı, piyasada çok az hareket olurdu ve traderlar fiyat değişimlerinden kazanç sağlayamazdı. Forex Piyasasında Volatilite Kullanımı Forex piyasasında vol
KT COG Robot
KEENBASE SOFTWARE SOLUTIONS
KT COG Robot is a fully automated Expert Advisor based on the KT COG Indicator . The COG indicator was originally presented by John F. Ehlers in the May 2002 edition of Technical Analysis of Stocks & Commodities magazine. The EA fires a long trade when COG line cross above the signal line and a short trade is fired when the COG line cross below the signal line.  Adaptive Filtration Our adaptive filtration algorithm combines the original COG formula with the major trend direction and market acce
ACB Breakout Arrows EA
KEENBASE SOFTWARE SOLUTIONS
ACB kırılma işlem akışını otomatikleştirin ACB Breakout Arrows EA, aktif grafikteki kırılma sinyallerini değerlendirir ve yerleşik ACB Breakout Arrows ile ACB Trade Filter mantığını kullanarak işlemleri yönetir. EA'yı izlemek istediğiniz sembol ve zaman dilimi grafiğine ekleyin, otomatik işlemi etkinleştirin ve ardından test planınıza uygun pozisyon, seans, filtre ve çıkış kurallarını seçin. Gerekli göstergeler ve bileşenler EA içine gömülüdür, bu nedenle ayrı bir indirme gerekmez. Bu göstergele
KT Asian Breakout
KEENBASE SOFTWARE SOLUTIONS
4 (1)
KT Asian Breakout carefully analyzes the range-bound market during the Asian session and then fires a long or short trade after doing some preassessment based on its inbuilt technical analysis module. The executed orders are closed within a day before the completion of the next day session. The inbuilt technical analysis module checks for the session range and compares it with the last 20 days price movement. If it finds any erratic price movement within the session, the orders are not executed
KT London Breakout
KEENBASE SOFTWARE SOLUTIONS
First thirty minutes are essential for a trading session. The early reaction of traders and market players sets a path for the rest of the day. KT London Breakout EA takes advantage of this phenomenon, and after analyzing the first thirty minutes of London session, it places two bidirectional pending orders. One of pending order is eventually canceled after realizing the market direction with certainty. It has been strictly tested and developed for EUR/JPY using 30-Min Time Frame. You can expe
Currency strength and pair correlation in one indicator KT Currency Strength and Correlation ranks the eight major currencies from strongest to weakest and shows, in a colored matrix, how closely ten currency pairs of your choice move together. Before you open a trade from your own strategy, you can check whether the two currencies of the pair are really moving apart, and whether the new trade adds risk to a trade you already hold. What you see on the chart Strength lines: a separate window belo
MACD Divergence Seeker
KEENBASE SOFTWARE SOLUTIONS
KT MACD Divergence Seeker trades the regular and hidden divergence signals generated by our free indicator named KT MACD Divergence indicator. Trading the standalone divergences can be a risky affair that's why the KT MACD Divergence Seeker combines the standard divergence signals with an advanced analysis module to exploit the price inefficiencies on some FX pairs. What is the Divergence exactly? As a general conception if the price is making higher highs, then macd should also be making hig
KT Asian Breakout Indicator
KEENBASE SOFTWARE SOLUTIONS
Asya seansı aralığını işaretleyin KT Asian Breakout Indicator, Asya seansındaki dört saatlik bir pencerenin en yüksek ve en düşük seviyelerini işaretler ve aralık tamamlandıktan sonra fiyatı izler. GMT Offset ayarı seansı broker sunucu saatinizle hizalarken Draw Session Box görünür aralığı kontrol eder. Kırılımı ve işlem seviyelerini birlikte görün Fiyat seansın en yüksek seviyesinin üzerinde kapandığında yükseliş oku görünür. Fiyat seansın en düşük seviyesinin altında kapandığında düşüş oku gör
MACD Divergence MT4
KEENBASE SOFTWARE SOLUTIONS
KT MACD Divergence, fiyat ile osilatör arasında oluşan düzenli ve gizli uyumsuzlukları gösterir. Eğer ticaret stratejinizde trend dönüşü bekleniyorsa, potansiyel dönüş noktalarını belirlemek için MACD’nin düzenli uyumsuzluğunu kullanabilirsiniz. Trendin devamına dayalı stratejilerde ise MACD’nin gizli uyumsuzluğu daha uygun bir tercih olacaktır. KT MACD Divergence'nın Sınırlamaları MACD uyumsuzluğunu tek başına giriş sinyali olarak kullanmak riskli olabilir. Her uyumsuzluk mutlaka bir trend dö
KT Bollinger Bands Trader MT4
KEENBASE SOFTWARE SOLUTIONS
KT Bollinger Bands Trader, düşük volatilite dönemlerinde Bollinger Bantlarını kullanarak ortalamaya dönüş stratejisi uygulayan %100 otomatik bir uzman danışmandır (Expert Advisor). Fiyat genellikle Bollinger Bantlarının üst veya alt çizgisine tepki verir, ancak her zaman bir dönüş gerçekleşmez. Bununla birlikte, düşük volatilite dönemlerinde fiyat dönüşü olasılığı daha yüksektir. Girişler Fiyat Bollinger Bantlarının alt çizgisinin altına doğru şekilde hizalandığında alış işlemi başlatılır. Fiya
KT CCI Divergence MT4
KEENBASE SOFTWARE SOLUTIONS
KT CCI Divergence shows the regular and hidden divergence created between the price and CCI oscillator. Divergence is one of the vital signals that depicts the upcoming price reversal in the market. Manually spotting the divergence between price and CCI can be a hectic and ambiguous task. Limitations of KT CCI Divergence   Using the CCI divergence as a standalone entry signal can be risky. Every divergence can't be interpreted as a strong reversal signal. For better results, try to combine it w
KT Heiken Ashi Smoothed MT4
KEENBASE SOFTWARE SOLUTIONS
Yumuşatılmış Heiken Ashi durumunu takip edin KT Heiken Ashi Smoothed, fiyat hareketini yumuşatılmış mavi ve kırmızı mumlara dönüştürür. Durum düşüşten yükselişe geçtiğinde mavi yukarı ok, yükselişten düşüşe geçtiğinde kırmızı aşağı ok ekleyerek yön geçişlerinin grafikte kolayca görülmesini sağlar. Yumuşatma periyodu ve yumuşatma yöntemi, mumların ne ölçüde yumuşatılacağını belirler. Böylece standart Heiken Ashi'ye göre daha istikrarlı bir görünüm sunarken grafiğinize uygun tepkiyi seçmenize olan
KT MA Crossover MT4
KEENBASE SOFTWARE SOLUTIONS
KT MA Crossover, seçilen hareketli ortalamaların kesişimine göre alım ve satım oklarını çizer. Ayrıca her ardışık sinyal için uygun uyarıları üretir ve MFE (En Avantajlı Sapma) değerini görüntüler. Hareketli ortalama kesişimi, dünya çapında trader'lar tarafından yaygın olarak kullanılan temel stratejilerden biridir. Genellikle biri hızlı, diğeri yavaş olmak üzere iki hareketli ortalamadan oluşur ve kesişim yönüne göre alım ya da satım sinyali üretir. Alım sinyali – hızlı MA, yavaş MA'nın üzerin
KT Round Numbers MT4
KEENBASE SOFTWARE SOLUTIONS
KT Round Numbers plots the round number levels which are also commonly known as psychological levels in the Forex world. In the context of Forex trading, round number levels are those levels in which there are two or more zeroes at the end. They are named as 00 levels on the chart. Some traders also consider the halfway points as a valid round number level. They are named as 50 levels on the chart. Use of round number levels in trading Round number levels work as strong support and resistance
KT Inside Bar Advanced MT4
KEENBASE SOFTWARE SOLUTIONS
Despite the popularity of inside bar pattern among the traders, using it as a standalone signal doesn't provide any edge in the market. KT Inside Bar Advanced indicator solves this problem by combining the classic inside bar pattern with the "ECE" cycle and Fibonacci extensions. Using this indicator in place of our classic inside bar indicator will provide a tremendous advantage and edge in the market. What is the ECE cycle? In financial markets, the price never moves in a straight line but u
KT Inside Bar Hunter MT4
KEENBASE SOFTWARE SOLUTIONS
Despite the popularity of inside bar pattern among traders, using it as a standalone entry signal doesn't provide any evidentiary advantage. KT Inside Bar Hunter trades only selected inside bar patterns using some preassessment and ECE price action cycle. Trading Strategy On successful detection of the required pattern, EA places a pending order in the direction of the forecasted price expansion phase. Pending orders are canceled if they are not triggered within the next bar. Once triggered, ac
Filtrele:
Değerlendirme yok
Değerlendirmeye yanıt