Session Statistics
- Göstergeler
- Sürüm: 1.0
- Etkinleştirmeler: 10

Session Statistics marks three trading sessions and the day's opening range on
an intraday chart, and then measures what actually happened after each of those
levels was broken, on the history of the chart you have it on.
What it draws
Three session ranges and the day's opening range, as outlines, for the most
recent days. The session hours are yours to set in server time, and a range may
cross midnight.
What it measures
For every range, on both sides, over the lookback you choose:
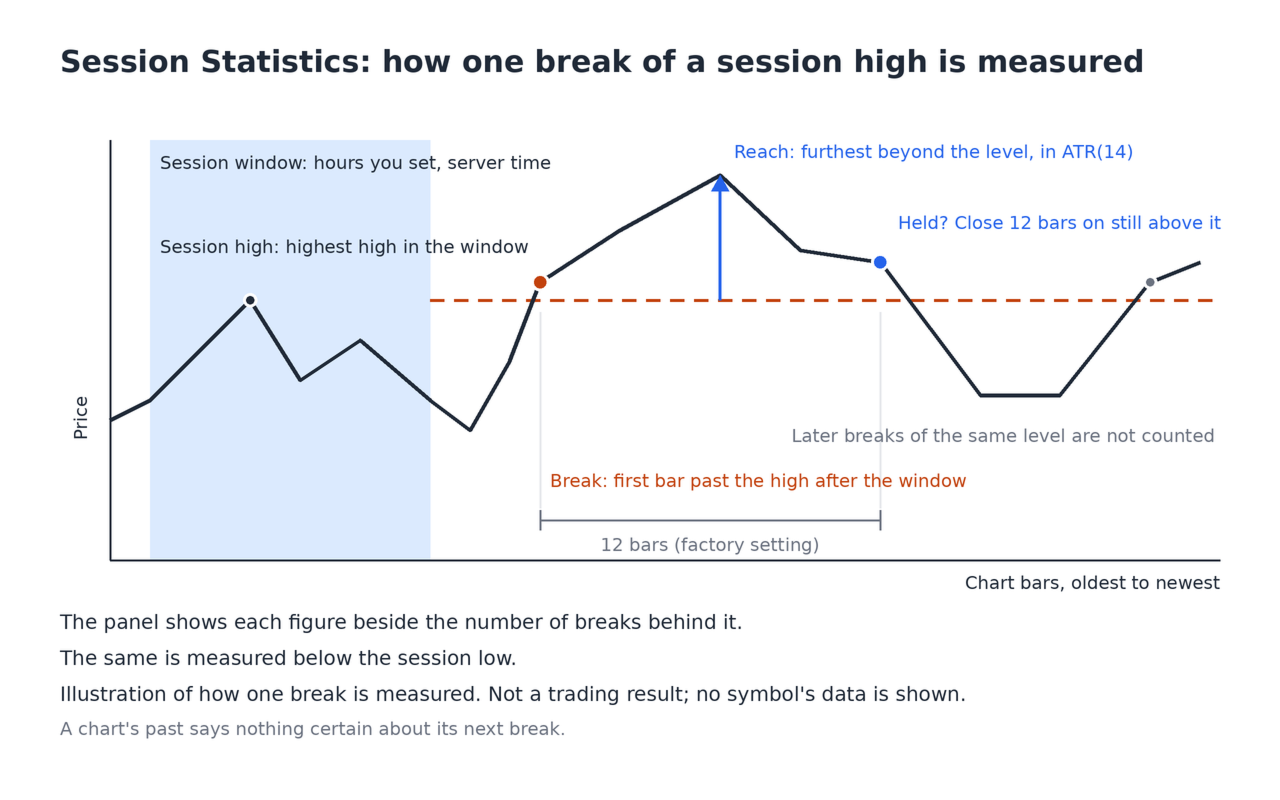
- how many times the level was broken after its window closed;
- how often price was still beyond the level a chosen number of bars later;
- the median distance price reached beyond the level, expressed in ATR, so the
figure means the same thing on a fast instrument and a slow one.
The panel reports the sample size alongside every figure, because a percentage
without a count is not a statistic.
The numbers are yours, not mine
Everything on the panel is computed from the bars your broker gave your
terminal. Change the symbol, the timeframe, the session hours or the lookback
and the figures change with them. There is no table of results shipped inside
this product, and nothing on this page tells you what the figures will be. That
is deliberate: a statistic you can reproduce on your own chart is worth more
than one you have to take on trust.
Readable by your own programs
The levels are published as data series, so an Expert Advisor or another
indicator can read the session highs and lows directly through iCustom rather
than recalculating them. The series are, in order: Session 1 high and low,
Session 2 high and low, Session 3 high and low, opening range high and low. A
value is empty until its window has closed, since a range is not knowable
before then.
Beside a robot that trades range breaks
If an Expert Advisor you run enters when price leaves a range, Session
Statistics lets you look at how breaks of a range behaved on your own symbol.
Set a session's hours to the window your robot watches, and the panel shows how
often a break of that window's high or low was still beyond the level some bars
later, how far price went, and how many breaks each figure rests on. It does not
read, test or judge any robot, and a chart's past says nothing certain about
its next break.
On daily and higher timeframes
A session is a block of hours inside a day, so on a chart whose bars are a day
or longer there is nothing to measure. The indicator says so on the panel and in
the log, draws nothing, and leaves its data series empty. It does not refuse to
load.
What it does not do
It gives no entry or exit signals, sends no orders and draws no arrows. It
reports what the chart's own history did.
Support through the product comments or MQL5 messaging.