TraderStart MTF Trend Dashboard
- Göstergeler
- Sürüm: 1.4

TraderStart MTF Trend Dashboard
Multi-timeframe trend context in one clean panel.
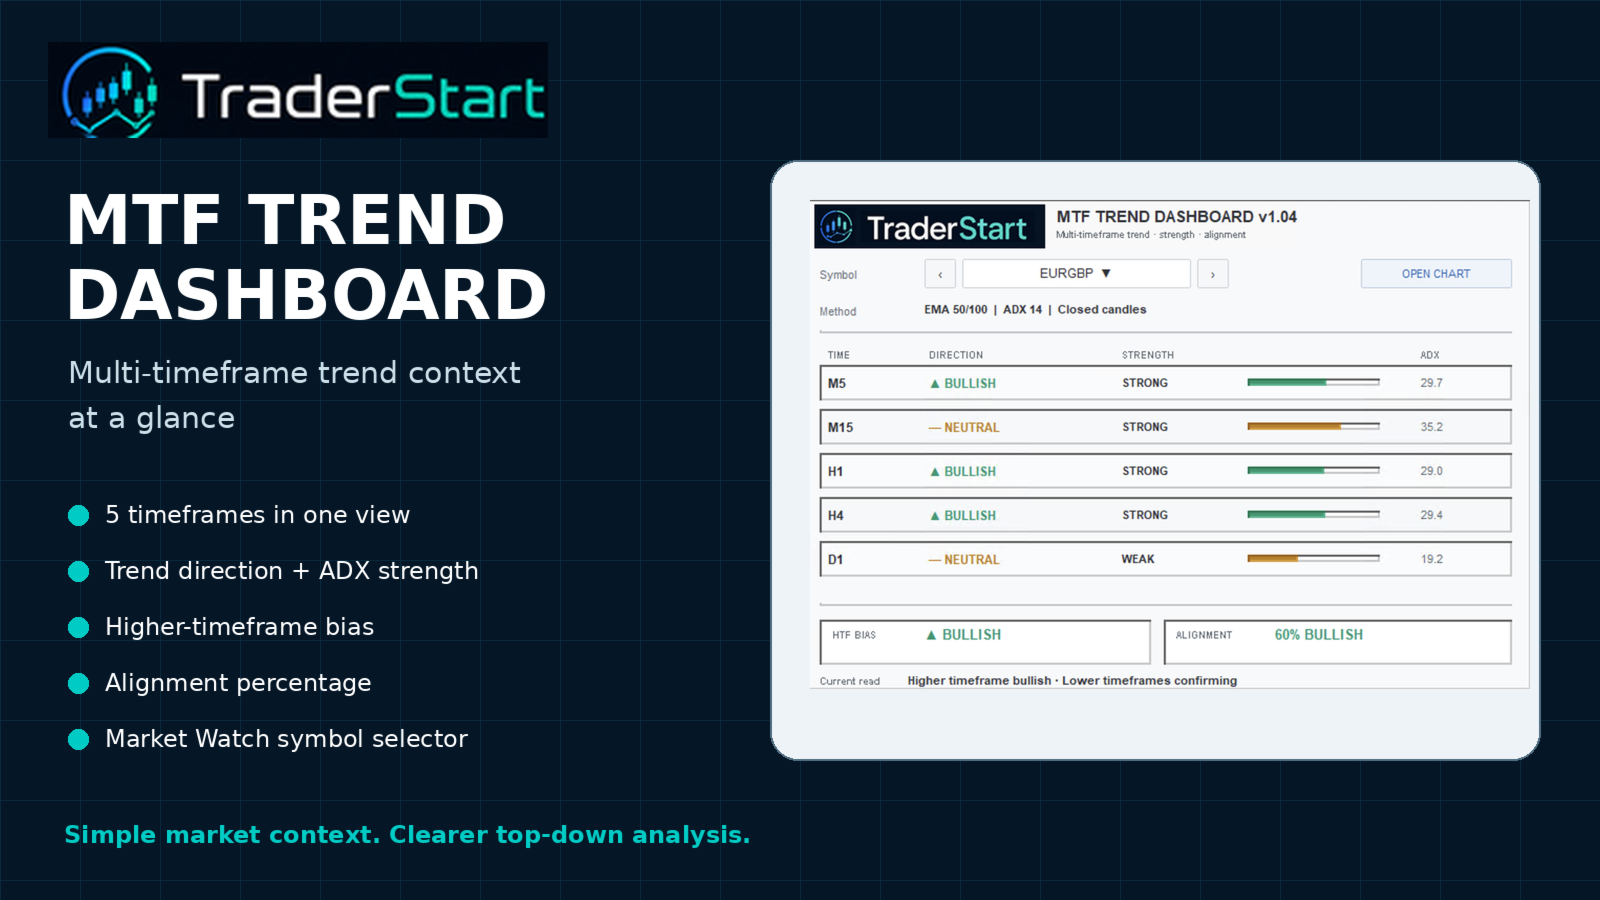
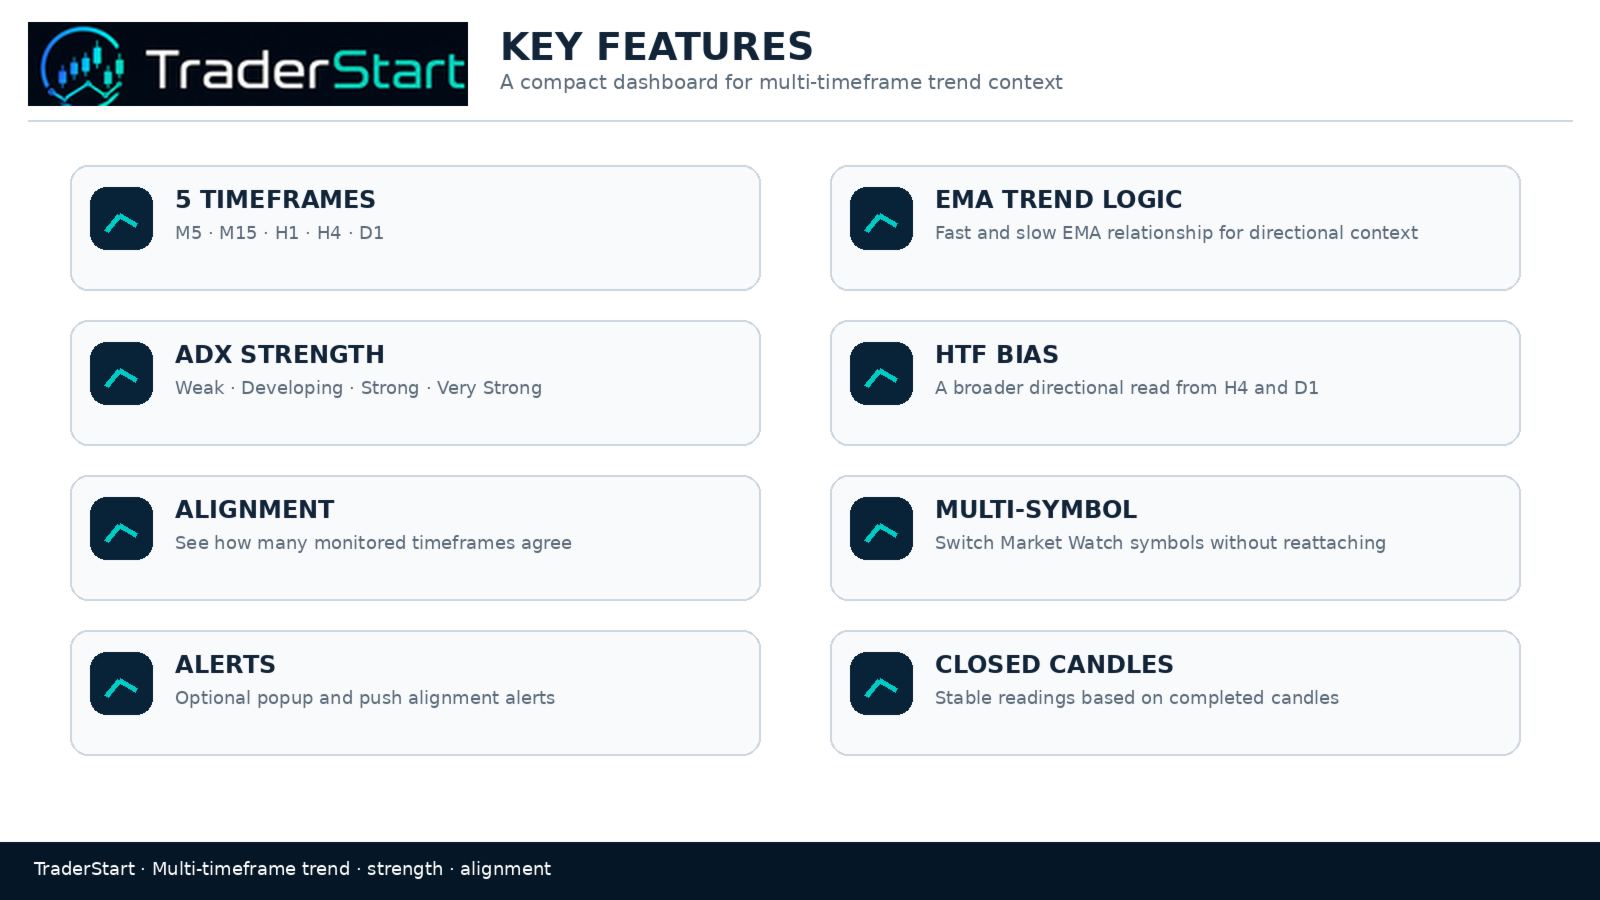
TraderStart MTF Trend Dashboard helps you compare trend direction, trend strength and timeframe alignment across five configurable timeframes from one chart.
The dashboard is designed for traders who use top-down analysis and want a faster way to answer practical questions such as:
- Is the broader market bias bullish, bearish or mixed?
- Are lower timeframes confirming the higher-timeframe direction?
- Is the current trend weak, developing, strong or very strong?
- How many monitored timeframes currently agree?
- Is the market aligned, or is there meaningful timeframe disagreement?
MAIN FEATURES
Multi-timeframe view
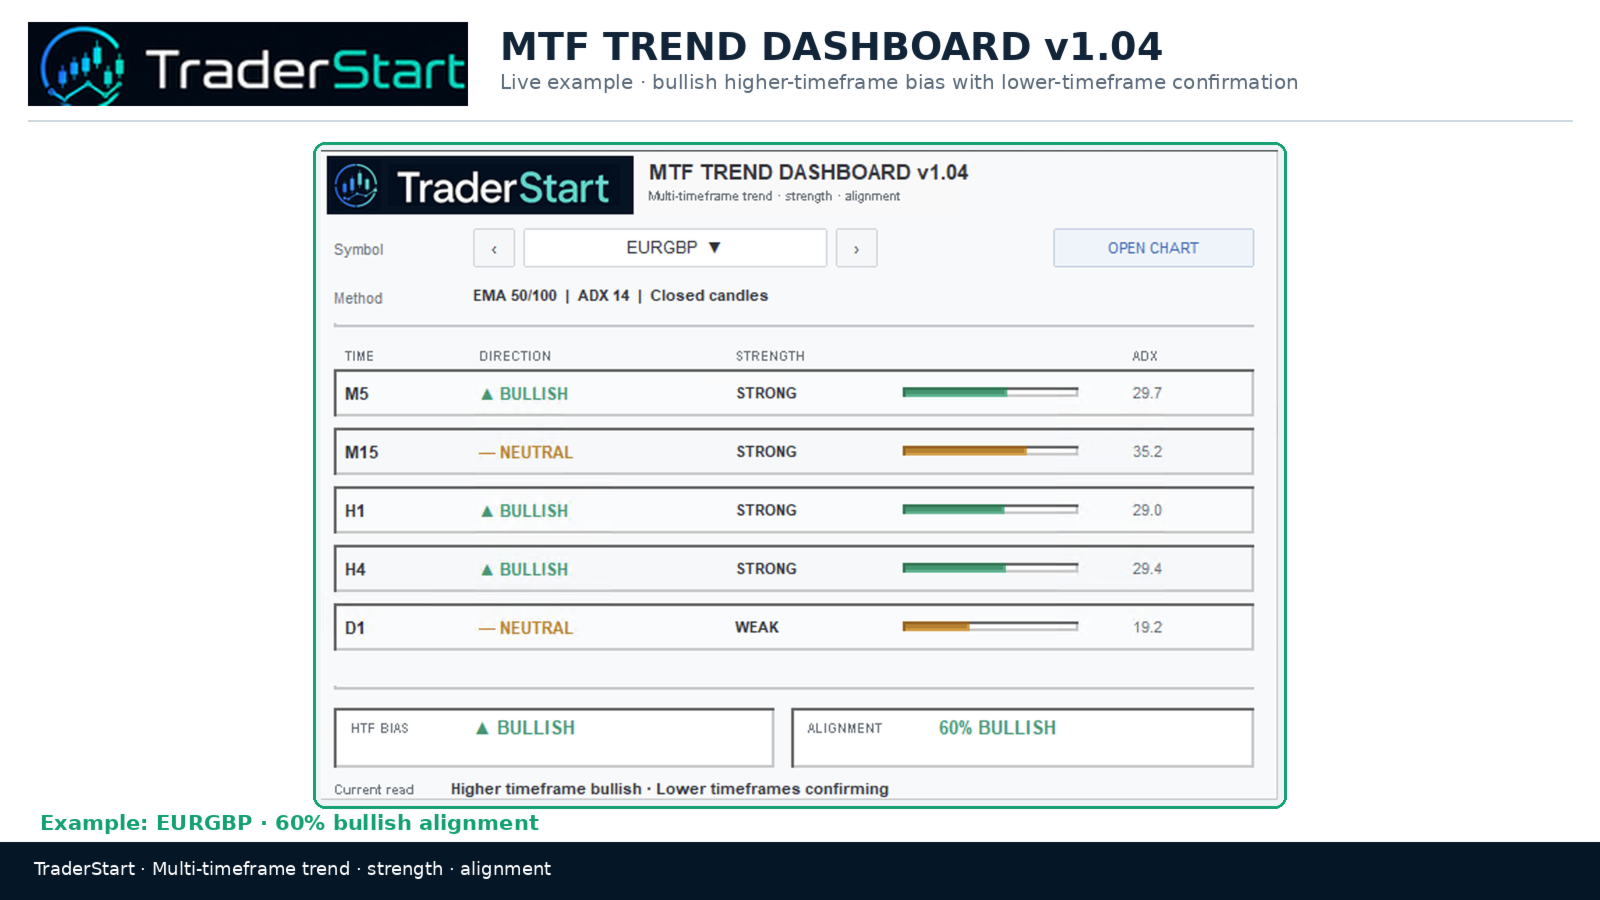
Monitor five configurable timeframes. The default set is M5, M15, H1, H4 and D1.
EMA trend context
The indicator compares a configurable fast EMA and slow EMA to determine directional context. Default settings are EMA 50 and EMA 100.
ADX trend strength
Each timeframe includes an ADX reading and a plain-English strength classification:
Weak
Developing
Strong
Very Strong
Higher-timeframe bias
The dashboard combines the higher-timeframe picture into a simple bullish, bearish or mixed bias.
Alignment percentage
See how many monitored timeframes currently point in the same direction.
Current read
A short plain-English summary explains whether higher and lower timeframes are confirming each other or disagreeing.
Multi-symbol selection
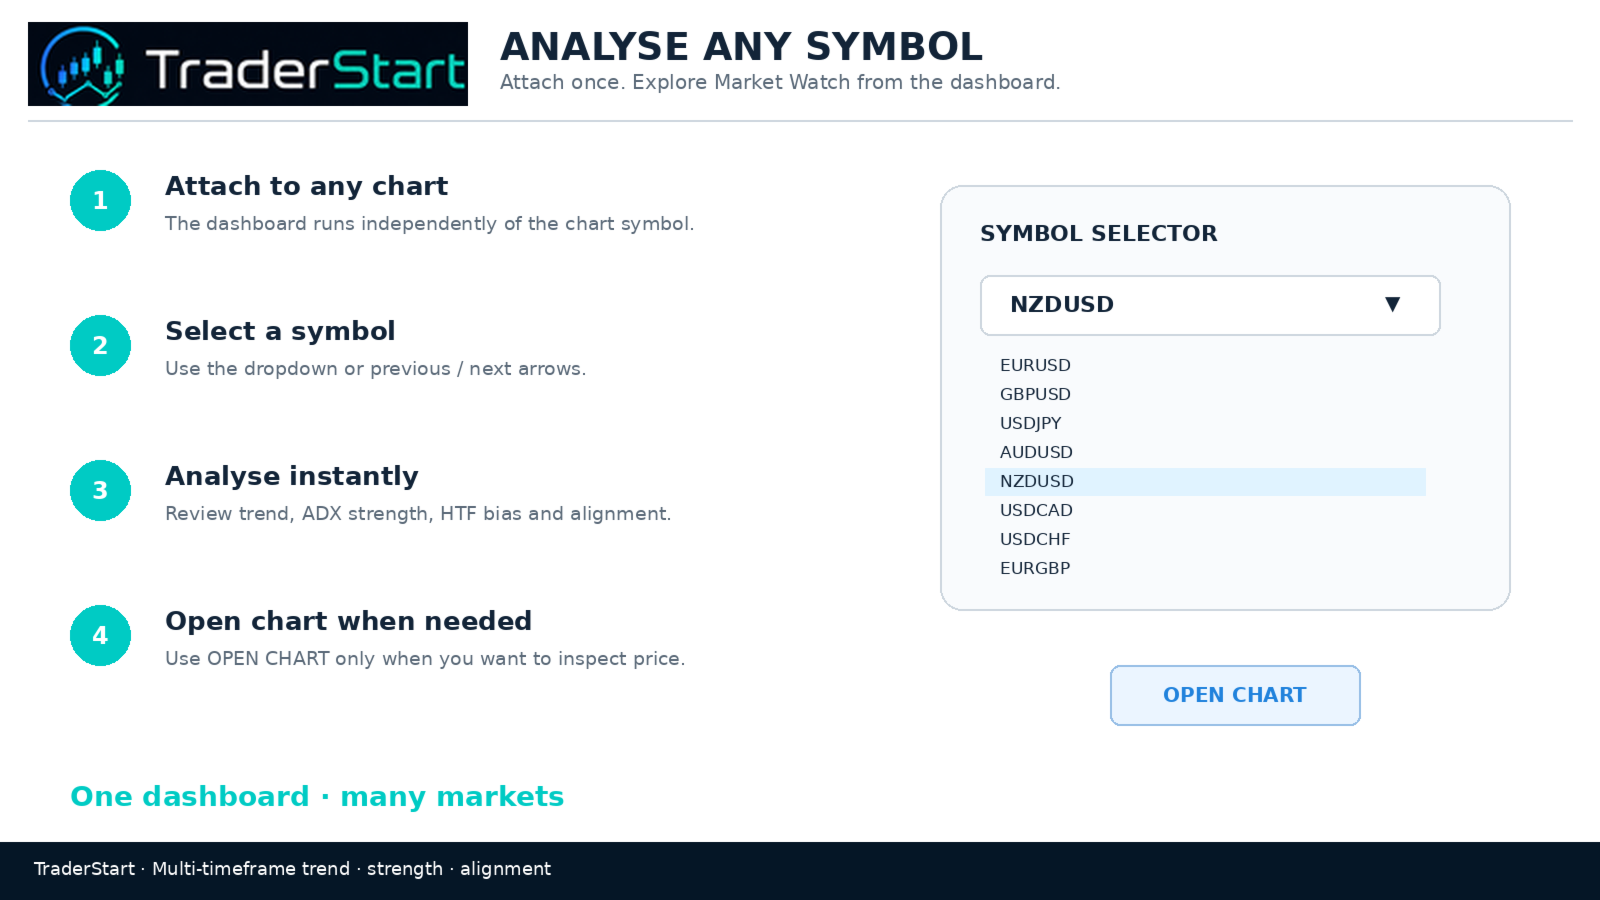
The dashboard can analyse symbols from Market Watch without needing to attach the indicator separately to each chart.
Use the symbol dropdown or previous / next buttons to move through available Market Watch symbols.
Open Chart
Select a symbol in the dashboard and use OPEN CHART when you want to inspect that instrument's price chart.
Optional alignment alerts
Enable popup and/or push alerts when the required number of monitored timeframes becomes aligned.
Closed-candle calculations
The dashboard uses completed candles for its displayed trend readings to reduce unnecessary changes from an unfinished candle.
HOW TO USE THE DASHBOARD
1. Start with the higher-timeframe bias.
2. Check whether H1, M15 and M5 confirm or disagree with that broader direction.
3. Review ADX strength on each timeframe.
4. Check the alignment percentage.
5. Use the Current Read as a quick summary.
6. Combine this information with your own entry method, stop placement and risk-management rules.
IMPORTANT
TraderStart MTF Trend Dashboard is a market-context indicator. It does not place trades and it is not intended to provide automatic buy or sell instructions.
Trend direction and timeframe alignment do not guarantee a profitable trade. Market conditions can change, and users should apply their own analysis and risk management.
DEFAULT SETTINGS
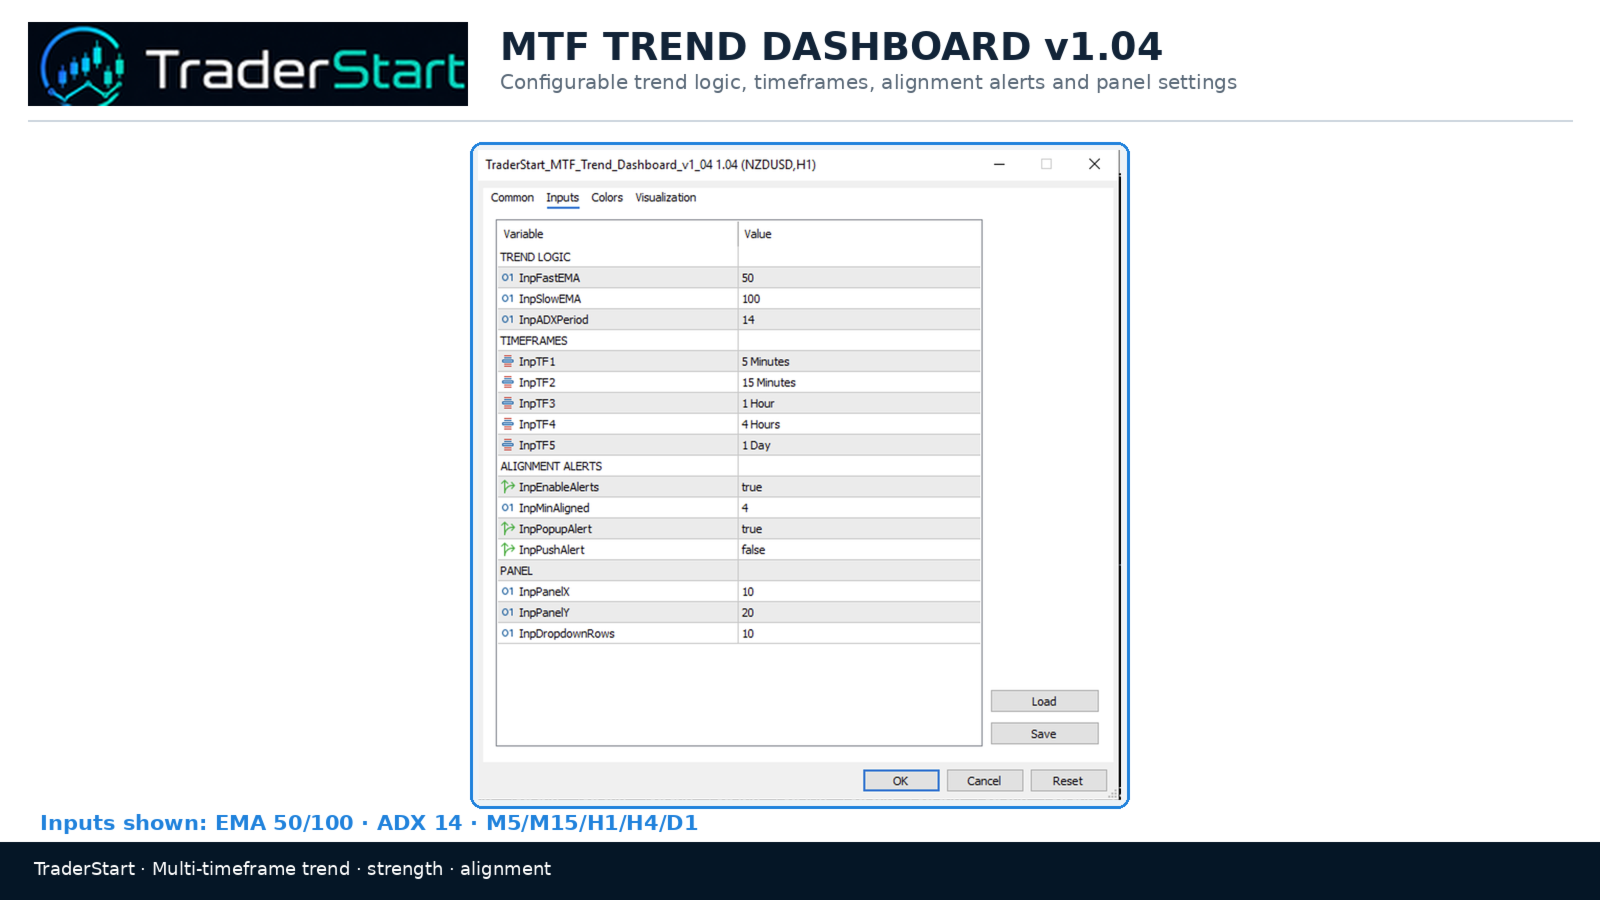
Fast EMA: 50
Slow EMA: 100
ADX Period: 14
Timeframes: M5, M15, H1, H4, D1
Minimum aligned timeframes for alert: 4
CUSTOMISATION
You can change:
- Fast EMA period
- Slow EMA period
- ADX period
- All five monitored timeframes
- Minimum number of aligned timeframes
- Popup alerts
- Push alerts
- Panel position
- Number of visible symbol-dropdown rows
WHO IT MAY SUIT
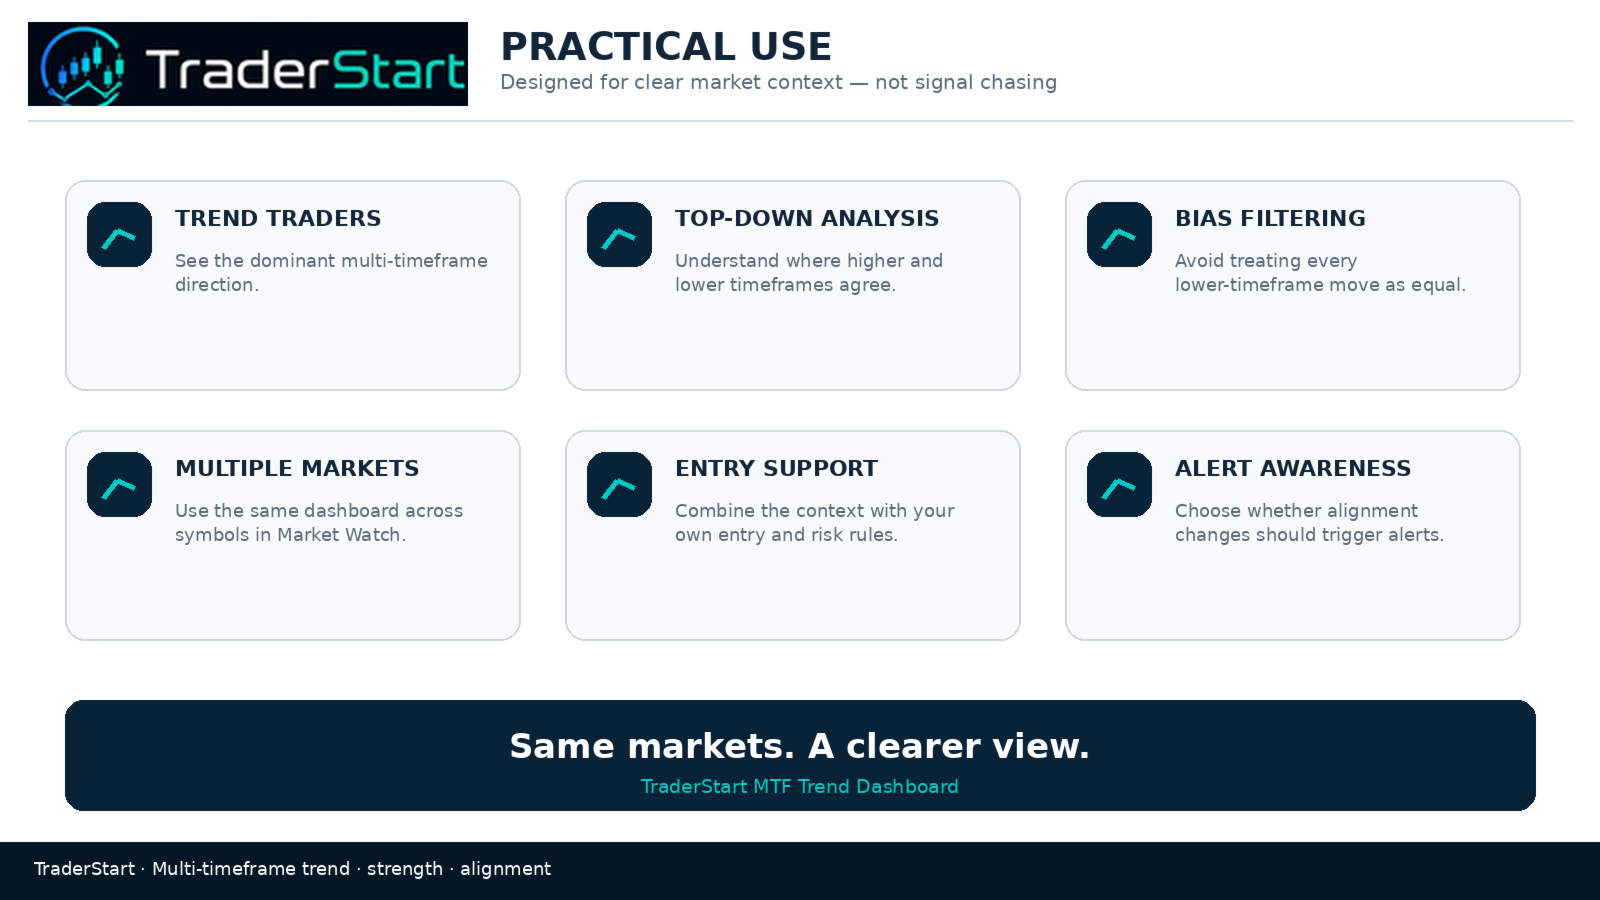
- Trend traders
- Intraday traders using top-down analysis
- Traders who compare multiple timeframes before entering
- Traders who want a simple directional filter
- Traders monitoring multiple Market Watch symbols from one chart
TraderStart MTF Trend Dashboard is designed to keep the information simple: trend, strength, alignment and context in one place.
TraderStart MTF Trend Dashboard — FAQ
Does the indicator trade automatically?
No. It is an analysis indicator only and does not place or manage trades.
Does it only analyse the chart symbol?
No. You can select another Market Watch symbol directly from the dashboard.
Will selecting another symbol automatically change my chart?
No. The dashboard can analyse the selected symbol independently. Use OPEN CHART if you want to switch the chart to that instrument.
What does HTF Bias mean?
HTF Bias is the broader directional read based on the higher monitored timeframes.
What does Alignment mean?
Alignment shows how many monitored timeframes currently point in the same direction.
What does ADX measure here?
ADX is used as a trend-strength measure. The dashboard translates the value into Weak, Developing, Strong or Very Strong.
Can I change the timeframes?
Yes. All five monitored timeframes are configurable in Inputs.
Can I change EMA and ADX settings?
Yes. The fast EMA, slow EMA and ADX period are configurable.
Does it use the current unfinished candle?
The displayed readings are based on closed candles.
Can it send alerts?
Yes. Popup and push alignment alerts can be enabled in Inputs.
Will it work with broker symbol suffixes?
The symbol selector uses symbols available in Market Watch, so broker-specific symbol names can be selected when they are present there.
Is this a buy/sell signal indicator?
No. It provides multi-timeframe context and should be combined with the user's own entry and risk-management process.