FVG Pro

FVG Pro — ICT Fair Value Gap Signal Indicator

Built for professional traders who already trade ICT concepts.

This indicator is designed for traders already familiar with ICT (Inner Circle Trader) methodology and FVG (Fair Value Gap) concepts — Consequent Encroachment, mitigation, inverse gaps, and bias-based execution. It is not a beginner "buy/sell" signal box; it's a precision tool that automates the tedious part (finding, tracking, and grading FVGs in real time) so you can focus on execution and risk management.

What it does:

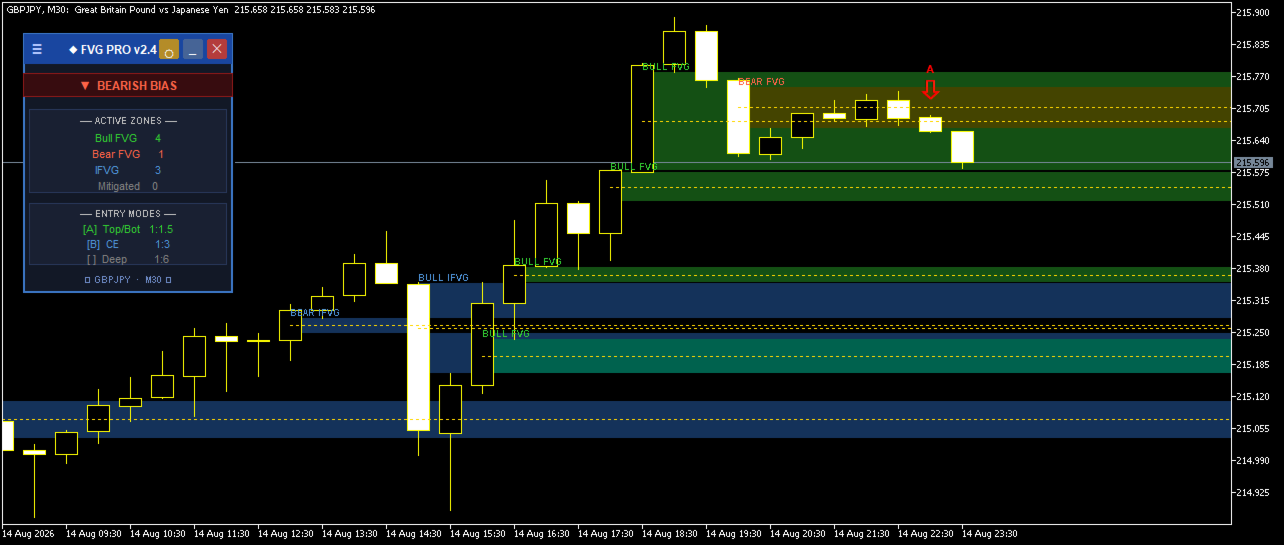
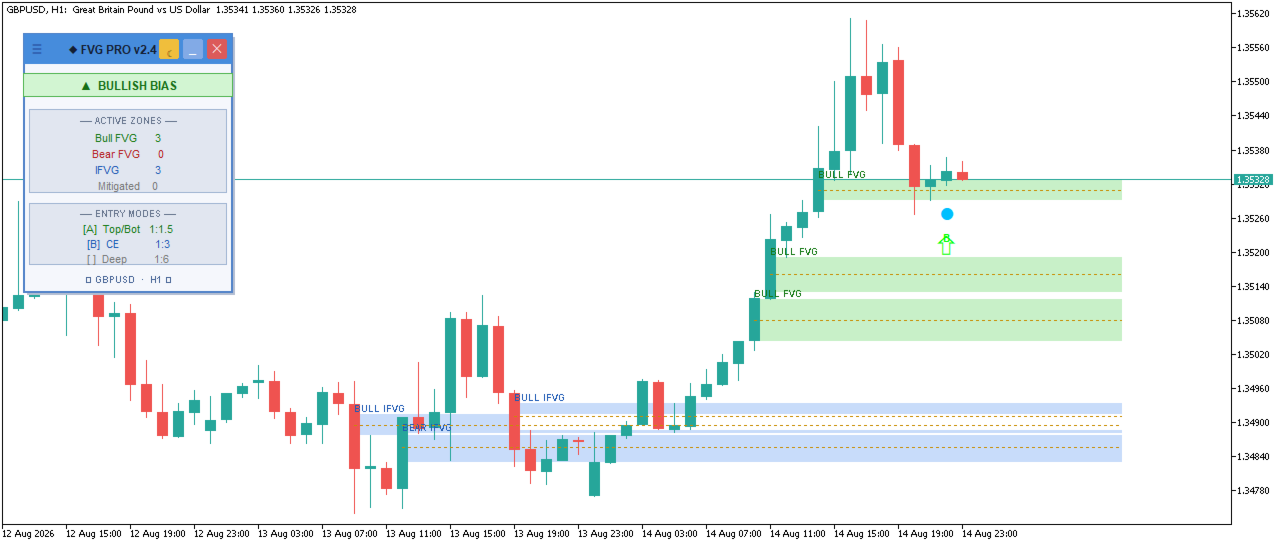
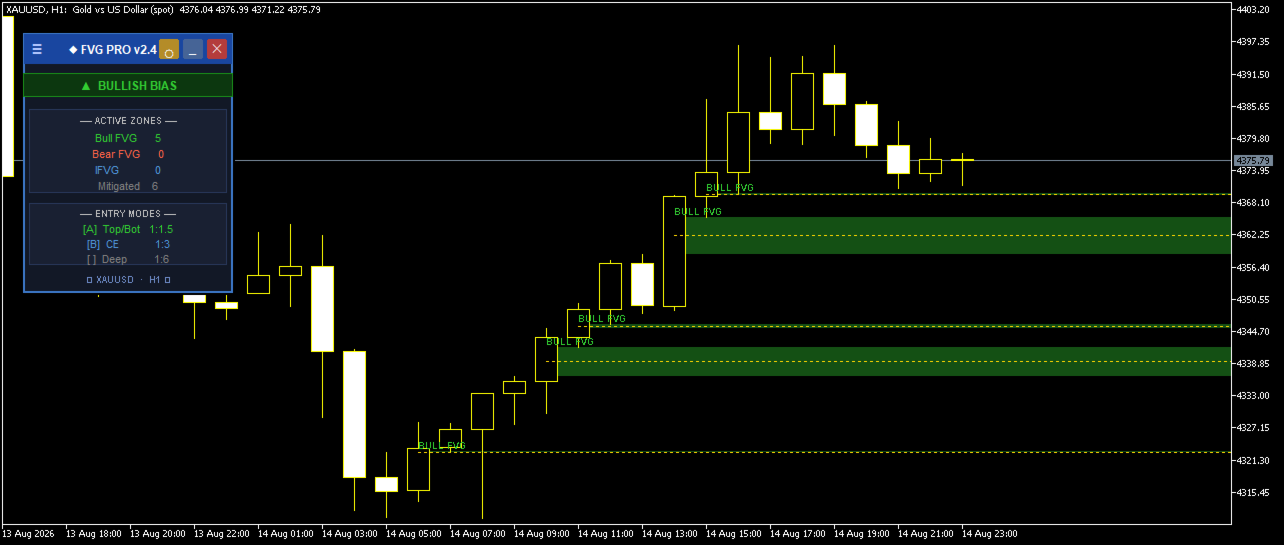
  • Automatically detects bullish and bearish Fair Value Gaps as they form, with a configurable minimum gap size so noise is filtered out
  • Tracks each zone's lifecycle — active, mitigated, or (optionally) flipped into an Inverse FVG once price trades through it
  • Offers three distinct entry models per zone, each with a different risk/reward profile, so you can match the signal to your own execution style:
    • Entry A — reaction at the top/bottom edge of the gap (tighter stop, ~1:1.5 R:R)
    • Entry B — reaction at the Consequent Encroachment (50% midpoint), the classic ICT entry (~1:3 R:R)
    • Entry C — deep entry near the far edge of the gap (widest stop, ~1:6 R:R)
  • Optional daily bias filter (EMA-based) so signals only fire in the direction of higher-timeframe flow
  • Signal cooldown per zone to prevent repeated alerts on the same setup
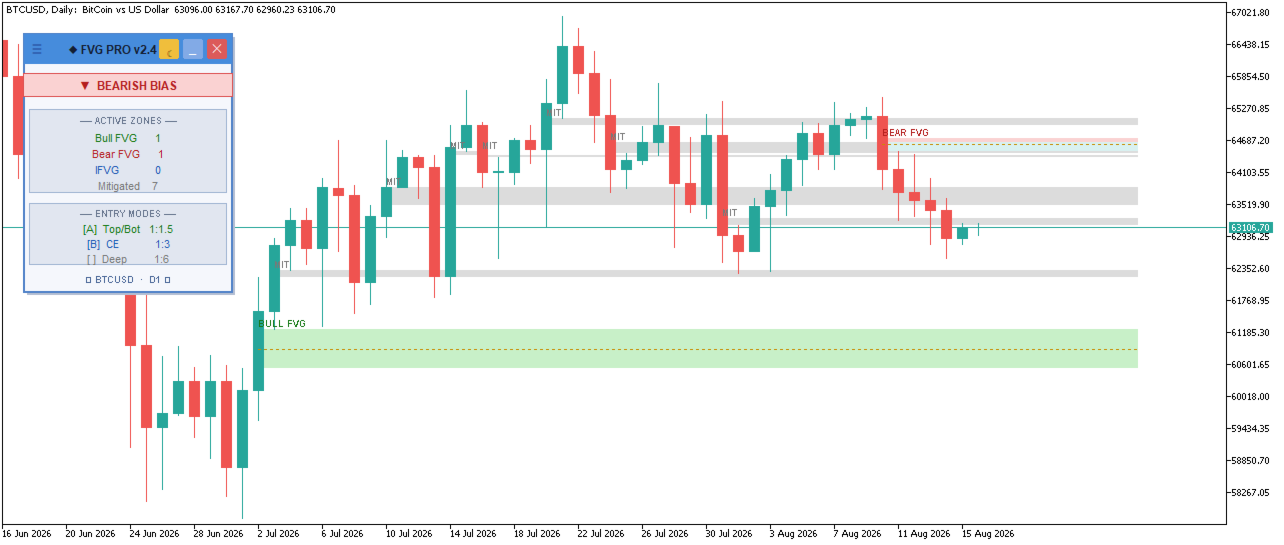
  • Clean, non-intrusive on-chart panel showing live bias, active zone counts, and which entry types are enabled
  • Fully configurable colors, zone projection length, and alerting

Note: This is a discretionary decision-support tool, not a fully automated strategy. It will not open trades for you — it highlights where ICT-defined opportunity exists and lets you apply your own confirmation and risk management.

How to Use It

  1. Attach it to your chart on any symbol and timeframe you trade FVGs on (M15–H4 works well for intraday ICT setups; H1–D1 for swing).
  2. Set your entry model(s) — enable Entry B (CE) for the classic 50% ICT entry, Entry A for tighter/faster reactions, or Entry C if you're comfortable with wider stops for bigger targets. You can run more than one at the same time.
  3. Decide on bias filtering — leave Daily Bias Filter on if you only want signals aligned with the higher-timeframe EMA trend; turn it off if you trade both directions independently.
  4. Tune zone lifetime  Max FVG Age controls how long a zone stays valid before it's retired. If you raise Bars to Scan, raise Max FVG Age to match, or the extra history won't actually display.
  5. Choose your theme — click the  D / L  button on the dashboard. Dark theme is optimized for dark chart backgrounds, Light theme uses soft pastels ideal for white/light charts.
  6. Position the dashboard — drag the blue header bar to place the panel where it doesn't cover your key levels. Minimize it with  _  when you just want the bias strip visible.
  7. Watch the chart: green zones = bullish FVGs, red = bearish, blue = Inverse FVGs (only if enabled), gray = mitigated. A lime/red arrow with an  A / B / C  badge marks a signal on the last closed candle when price reacts inside a zone according to your chosen entry model.
  8. Use the panel as a quick-glance dashboard for current bias and how many zones are active — useful when scanning multiple pairs.
  9. Apply your own trade management — the indicator marks the setup; stop placement, position sizing, and trade management remain up to you.

Full Input Reference

FVG Detection

  • Bars to scan — historical depth for FVG discovery
  • Min FVG size (pips) — filter out micro-gaps
  • Max FVG age (bars) — how many bars a zone stays valid before retirement
  • Show Bullish FVGs / Show Bearish FVGs — enable/disable each direction
  • Convert invalidated FVGs → Inverse FVGs — turn IFVG tracking on/off

Signal Settings

  • Entry A — Top/Bottom (1:1.5) — enable/disable
  • Entry B — CE (1:3) — enable/disable
  • Entry C — Deep (1:6) — enable/disable

Filters

  • Daily Bias Filter (EMA) — restrict signals to HTF trend direction
  • EMA Period for Bias — customize the bias EMA length
  • Only unmitigated FVGs — hide mitigated zones for a cleaner chart
  • Signal cooldown (bars) — minimum bars between signals on the same zone

Visuals

  • Show CE midpoint line — toggle the gold dotted line
  • Show info panel — toggle the dashboard
  • Enable alerts — pop-up alerts on new signals
  • Zone extend bars — how far into the future zone rectangles project
  • Panel start X / Y — initial dashboard position
  • Start in dark theme — default theme on load
  • Short name — used by the close button to remove the indicator (keep unique if you load multiple instances)
Yazarın diğer ürünleri
SRP (Strong Retracement/Reversal Points) is a powerful and unique support and resistance indicator. It displays the closest important levels which we expect the price retracement/reversal! If all level are broken from one side, it recalculates and draws new support and resistance levels, so the levels might be valid for several days depending on the market! Key Features You can use it in all time-frames smaller than daily! Displays closest significant support and resistance levels Update the le
FREE
The Shark Pattern is dependent upon the powerful 88.6% retracement and the 113% Reciprocal Ratio, works extremely well retesting prior support/resistance points (0.886/1.13) as a strong counter-trend reaction. Represents a temporary extreme structure that seeks to capitalize on the extended nature of the Extreme Harmonic Impulse Wave. The indicator demands immediate change in price action character following pattern completion. Extreme Harmonic Impulse Wave utilized depends upon location of 88.6
Strongest and Weakest Currency Analysis This product shows the strength of the main currencies in FOREX based on average pip gain/loss in different time-frames! Depending on the strength of the currency, the indicator colors changes from blue to red also the orders may also be changed, allowing you to find the strongest and weakest currency at a glance! Advantages Whatever your trading method and strategy are, it is always important to choose the correct pairs, so this indicator will help you a
This EA is working based on our Shark indicator ( https://www.mql5.com/en/market/product/22786 ). After forward testing this EA for more than 2 months and publishing live signals on our Telegram channel https://t.me/SharkChannel , we received so many positive feed-backs from the clients. Therefore, I decided to put this simple but nice EA on the Market! The robot is multi pair and multi timeframe. So it can monitor several instruments on different timeframes to find shark patterns and then trade
SRP Pro
Farhad Kia
5 (1)
Strong Retracement Points Pro edition! SRP (Strong Retracement/Reversal Points) is a powerful and unique support and resistance indicator. It displays the closest important levels which we expect the price retracement/reversal! If all level are broken from one side, it recalculates and draws new support and resistance levels, so the levels might be valid for several days depending on the market! If you are still hesitating to start using this wonderful tool, you can check this link to see how ef
This robot is multi pair and multi timeframe.  It monitors several instruments on different timeframes to find Shark and Bat harmonic patterns . You can use this Robot as a fully automated trading system. Or you can use it as a trigger for your entry points with your own trading systems. Entry point, Stop loss and take profit are well defined based on Harmonic pattern! Entry points  are indicated by golden lines. Stop loss is indicated by red line and finally we have 6 take profit points which a
Gioteen Volatility Index (GVI)   - your ultimate solution to overcoming market unpredictability and maximizing trading opportunities. This revolutionary indicator helps you in lowering your losing trades due to choppy market movements. The GVI is designed to measure market volatility, providing you with valuable insights to identify the most favorable trading prospects. Its intuitive interface consists of a dynamic red line representing the volatility index, accompanied by blue line that indicat
Advanced SRP (Strong Retracement/Reversal Points) Tired of support and resistance indicators that constantly repaint, clutter your charts with irrelevant lines, and fail across different timeframes? It's time to stop guessing and start trading with institutional-grade clarity. Advanced SRP is not just another S/R tool; it's a definitive market structure indicator designed for the serious trader. It identifies and displays the most critical price levels where the market is statistically likely t
AlphaGrid Pro                                                                                                                          See the market in full dimension.                                                                                                   Built for traders who demand more than a single indicator can tell them.   Overview AlphaGrid Pro is a professional
PivotMeridian is an advanced, visually optimized daily range and pivot mapping tool designed for professional manual traders. Instead of relying on static, intrusive chart overlays, it features a native, fully draggable dashboard that puts total control over historical analysis directly on your chart. Core Features Smart Daily Zones:  Highlights the exact High-to-Low range of previous trading days using semi-transparent, color-faded blocks. Zones are intelligently inset to prevent them from visu
FVG Pro — ICT Fair Value Gap Signal Indicator Built for professional traders who already trade ICT concepts. This indicator is designed for traders already familiar with   ICT (Inner Circle Trader) methodology   and   FVG (Fair Value Gap)   concepts — Consequent Encroachment, mitigation, inverse gaps, and bias-based execution. It is not a beginner "buy/sell" signal box; it's a precision tool that automates the tedious part (finding, tracking, and grading FVGs in real time) so you can focus on ex
Strongest and Weakest Currency Analysis This product shows the strength of the main currencies in FOREX based on average pip gain/loss in different time-frames! Depending on the strength of the currency, the indicator colors changes from blue to red also the orders may also be changed, allowing you to find the strongest and weakest currency at a glance! Advantages Whatever your trading method and strategy are, it is always important to choose the correct pairs, so this indicator will help you a
is a fully automatic Forex trading Expert Advisor. The robot can run on any instrument, but the results are better with EURUSD on the H1 timeframe.  If you are a long-term investor looking at yearly profits with high Sharpe-ratio then Money magnet is a good option. Please check the comment part to share your settings with others and enjoy the latest optimal settings uploaded by other users.  Expert Advisor Advantages High Sharpe-ratio The EA does not use such systems as martingale, hedging,  gr
Gioteen Volatility Index (GVI) - your ultimate solution to overcoming market unpredictability and maximizing trading opportunities. This revolutionary indicator helps you in lowering your losing trades due to choppy market movements. The GVI is designed to measure market volatility, providing you with valuable insights to identify the most favorable trading prospects. Its intuitive interface consists of a dynamic red line representing the volatility index, accompanied by blue line that indicate
Advanced SRP (Strong Retracement/Reversal Points) Tired of support and resistance indicators that constantly repaint, clutter your charts with irrelevant lines, and fail across different timeframes? It's time to stop guessing and start trading with institutional-grade clarity. Advanced SRP   is not just another S/R tool; it's a definitive market structure indicator designed for the serious trader. It identifies and displays the most critical price levels where the market is statistically likely
AlphaGrid Pro                                                                                                                          See the market in full dimension.                                                                                
PivotMeridian is an advanced, visually optimized daily range and pivot mapping tool designed for professional manual traders. Instead of relying on static, intrusive chart overlays, it features a native, fully draggable dashboard that puts total control over historical analysis directly on your chart. Core Features Smart Daily Zones:  Highlights the exact High-to-Low range of previous trading days using semi-transparent, color-faded blocks. Zones are intelligently inset to prevent them from visu
Filtrele:
Değerlendirme yok
Değerlendirmeye yanıt