Cumulative Volume Delta Divergence
- Göstergeler
- Sürüm: 1.50
- Etkinleştirmeler: 10

Cumulative Volume Delta Divergence
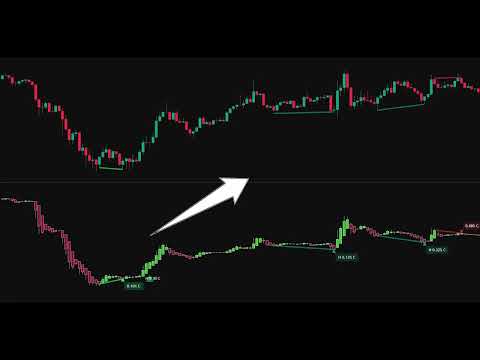
Cumulative Volume Delta Divergence is a volume-pressure analysis indicator for MetaTrader 5.
It combines estimated cumulative volume delta with regular and hidden divergence detection, higher-timeframe context, absorption analysis, exhaustion zones, configurable signal scoring, alerts, and historical target/stop outcome tracking.
The indicator is designed to help traders identify situations where price structure and estimated volume pressure are behaving differently.
Cumulative Delta
The indicator estimates buying and selling pressure using candle structure and available volume data.
- When real volume is available, it is used.
- When real volume is unavailable, MetaTrader tick volume is used.
- The calculated delta is accumulated into a Cumulative Volume Delta oscillator displayed as candles in a separate indicator window.
- Optional Heikin Ashi processing can be applied to the cumulative delta candles for a smoother view of changes in volume pressure.
Divergence Detection
The indicator automatically detects four types of confirmed divergence:
- Regular Bullish Divergence — price forms a lower low while cumulative delta forms a higher low.
- Regular Bearish Divergence — price forms a higher high while cumulative delta forms a lower high.
- Hidden Bullish Divergence — price forms a higher low while cumulative delta forms a lower low.
- Hidden Bearish Divergence — price forms a lower high while cumulative delta forms a higher high.
Divergences are based on confirmed oscillator pivots. Signals therefore appear only after the required number of confirmation bars.
Optional lines can connect the relevant oscillator pivots and corresponding price pivots, making the divergence structure easier to inspect.
Signal Strength and Scoring
Detected divergences are evaluated using a configurable composite scoring system.
The score can include:
- Divergence strength
- Delta momentum
- Relative volume activity
- Trend alignment
- Higher-timeframe agreement
- Distance between confirmed pivots
Signals are classified into A+, B, and C categories.
These categories are internal analytical classifications and are not probability estimates or guarantees of future performance.
Users can configure:
- Scoring weights
- Grade thresholds
- Minimum accepted grade
- Minimum divergence strength
- Adaptive score scaling
The indicator can calculate additional divergence information from a selected higher timeframe.
Higher-timeframe analysis includes:
- Regular bullish divergence
- Regular bearish divergence
- Hidden bullish divergence
- Hidden bearish divergence
- Independent higher-timeframe scoring
- Higher-timeframe grade filtering
- Higher-timeframe agreement as an optional component of the main divergence score
The selected higher timeframe must be greater than the current chart timeframe for this feature to become active.
Absorption Analysis
The indicator identifies potential bullish and bearish absorption conditions by comparing estimated delta with volume, candle range, candle body structure, and recent divergence context.
Bullish absorption looks for unusually negative estimated delta combined with a comparatively limited downside price response.
Bearish absorption looks for unusually positive estimated delta combined with a comparatively limited upside price response.
Absorption can optionally require recent divergence confluence.
User-adjustable parameters include:
- Volume sensitivity
- Delta sensitivity
- Candle range
- Body size
- Lookback settings
- Cooldown period
- Divergence confluence
- Delta Exhaustion Zones
The indicator calculates a Z-score of the cumulative delta oscillator.
When the oscillator moves beyond the selected positive or negative Z-score threshold, the indicator can highlight an exhaustion zone in the oscillator pane.
These zones identify statistically unusual cumulative-delta readings. They do not, by themselves, establish that price will reverse.
The following can be configured:
- Z-score length
- Z-score threshold
- Exhaustion-zone colors
- Cumulative Delta Moving Averages
Four optional moving averages can be displayed directly on the cumulative delta oscillator:
- SMA 1
- SMA 2
- EMA 1
- EMA 2
Each moving average has an independently configurable length and color.
They can be used to examine longer-term changes in cumulative volume pressure and oscillator structure.
Timeframe Presets
Low, Mid, and High presets are included.
When presets are enabled, the indicator automatically adjusts several internal settings, including:
- Pivot lengths
- Signal-score behavior
- Adaptive scaling
- Absorption sensitivity
- Absorption lookback settings
- Heikin Ashi processing
Presets provide a starting configuration and can be disabled for full manual control.
Visual Controls
Users can independently configure:
- Regular divergences
- Hidden divergences
- Bullish and bearish conditions
- Divergence markers
- Oscillator divergence lines
- Price divergence lines
- Signal-strength labels
- Higher-timeframe signals
- Absorption markers
- Exhaustion zones
- Cumulative delta moving averages
- Line width and transparency
- Signal colors
- Dark and light themes
- Target and Stop Reference Levels
The indicator can draw configurable percentage-based target and stop reference levels after detected divergence and absorption conditions.
These levels are also used for the indicator's internal historical outcome tracking.
They are visual and analytical reference levels only. The indicator does not open, manage, or close trades.
The indicator tracks simplified historical target-first and stop-first outcomes for:
Regular bullish divergence
Regular bearish divergence
Hidden bullish divergence
Hidden bearish divergence
Bullish absorption
Bearish absorption
The statistics use the configured fixed-percentage target and stop distances.
They are intended as a quick analytical reference and should not be interpreted as a complete strategy backtest.
Changing the symbol, timeframe, target, stop, or indicator settings can materially change the displayed results.
Alerts
Built-in alerts are available for:
- Regular bullish divergence
- Regular bearish divergence
- Hidden bullish divergence
- Hidden bearish divergence
- A+ bullish divergence
- A+ bearish divergence
- Bullish absorption
- Bearish absorption
- Bullish divergence with exhaustion
- Bearish divergence with exhaustion
- Higher-timeframe bullish divergence
- Higher-timeframe bearish divergence
Important Information
Cumulative Volume Delta Divergence is an analytical indicator and does not perform automatic trading.
The cumulative delta calculation is an estimate derived from available MetaTrader price and volume data. It is not exchange-level bid-versus-ask order-flow data.
Where real traded volume is unavailable, MetaTrader tick volume is used.
Divergence signals use confirmed pivots and therefore require subsequent bars before confirmation.
Absorption, divergence, exhaustion, grading, and historical outcome information should be treated as analytical tools rather than predictions.
No individual indicator can determine future market direction with certainty. Signals should be evaluated together with market structure, appropriate risk management, and the trader's own analysis.