ChartTradingPRO

ChartTradingPRO

Features and Benefits
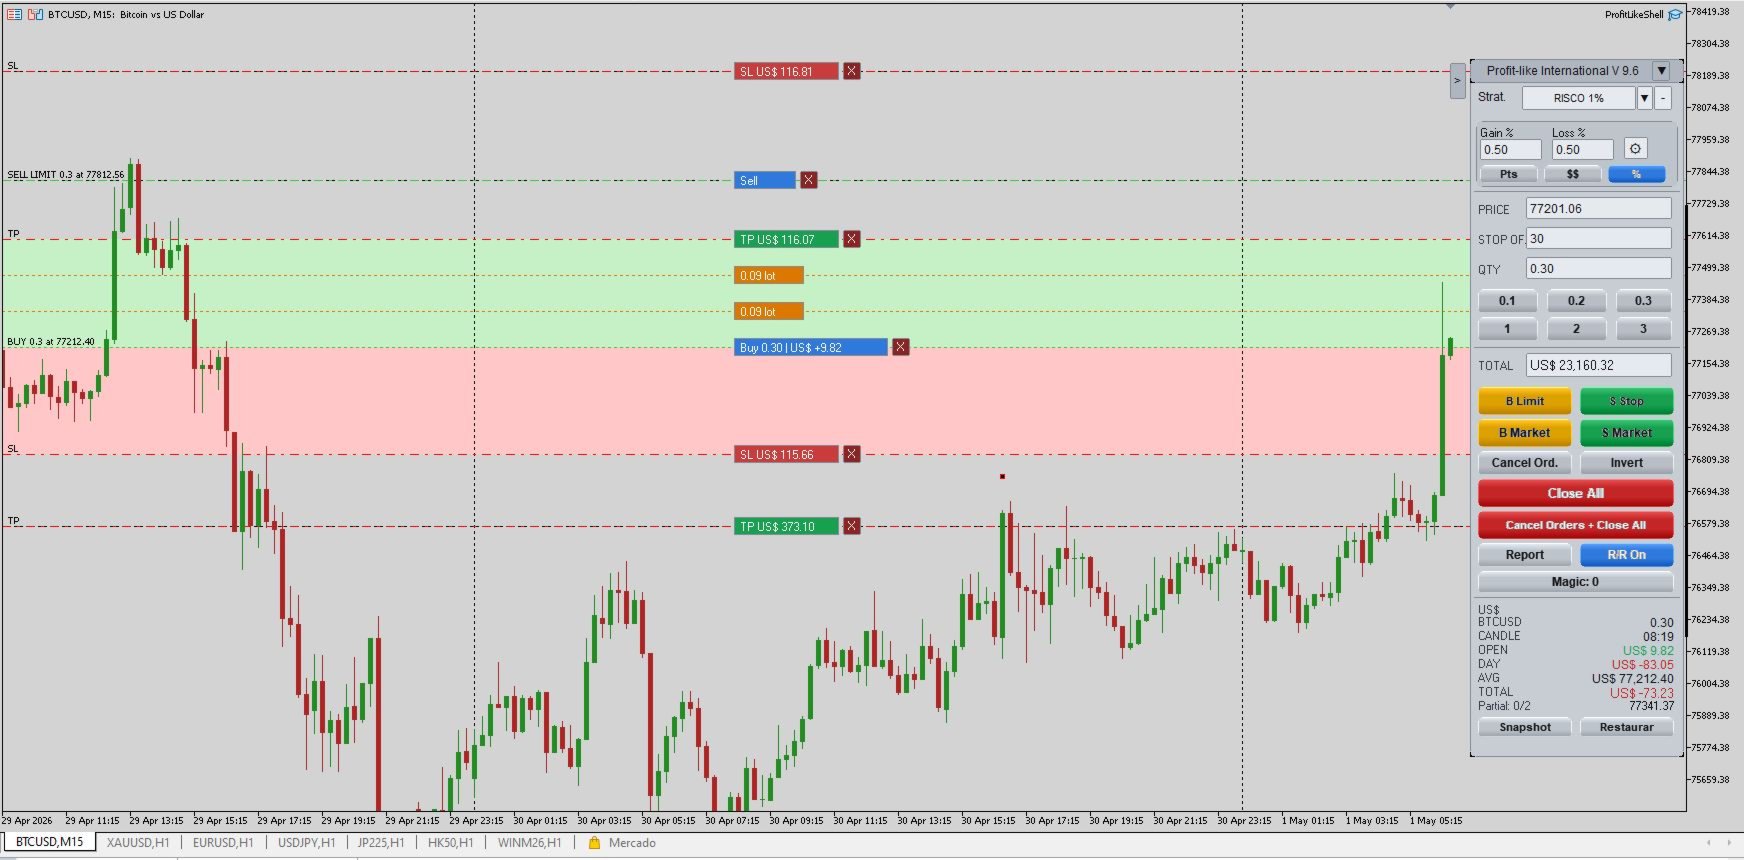
Side trading panel

  • Practical and objective side panel with quick access to the main trading commands.
  • Visual layout inspired by professional platforms, offering easy reading and a faster workflow.
  • Organizes the most important functions in one place, reducing clicks and saving time during execution.

Fast order execution

  • Buy and sell buttons with direct access from the panel.
  • Makes trade entries faster, especially for short-term operations and timing decisions.
  • Helps traders operate with more agility and less terminal navigation.

Position size control

  • Quick quantity/lot selection directly from the panel.
  • Preset buttons designed to speed up position sizing.
  • More convenience for traders who frequently switch between different order sizes during the session.

Market modes: B3 and International

  • Easy switching between B3 and International directly from the panel.
  • Each mode preserves the same visual concept while adapting the display to the selected market.
  • Allows the same operational structure to be used in different environments with a consistent user experience.

Market-specific visual adaptation

  • In B3 mode, monetary fields follow the Brazilian real (R$) convention.
  • In International mode, fields follow the US dollar (US$) standard.
  • Improves result reading and reduces visual confusion during live trading.

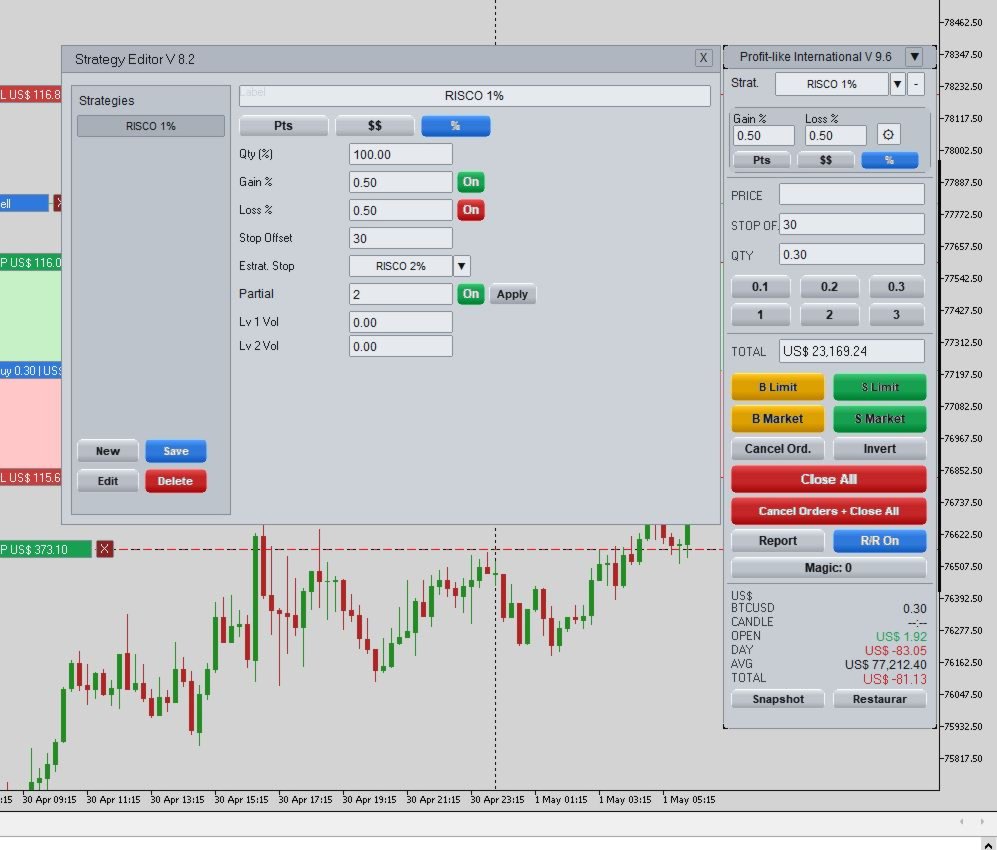
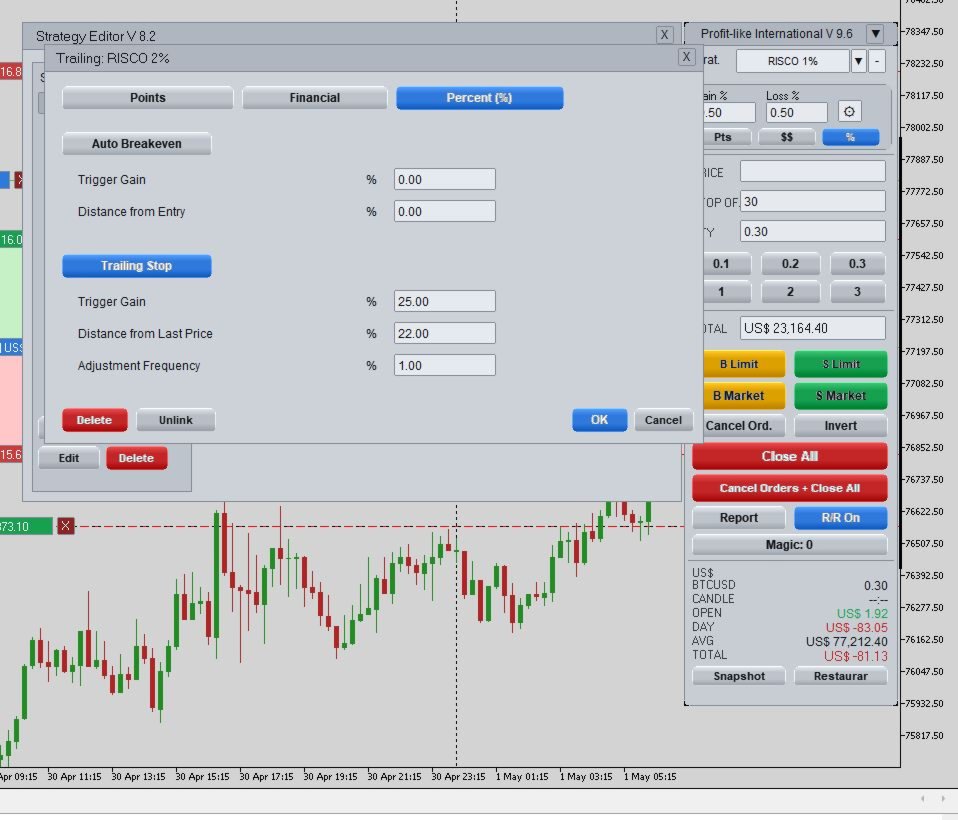
Built-in strategy editor

  • Dedicated area to configure and adjust strategies within the application workflow itself.
  • Centralizes operational management without relying on multiple scattered windows.
  • A better experience for users who need to review parameters quickly.

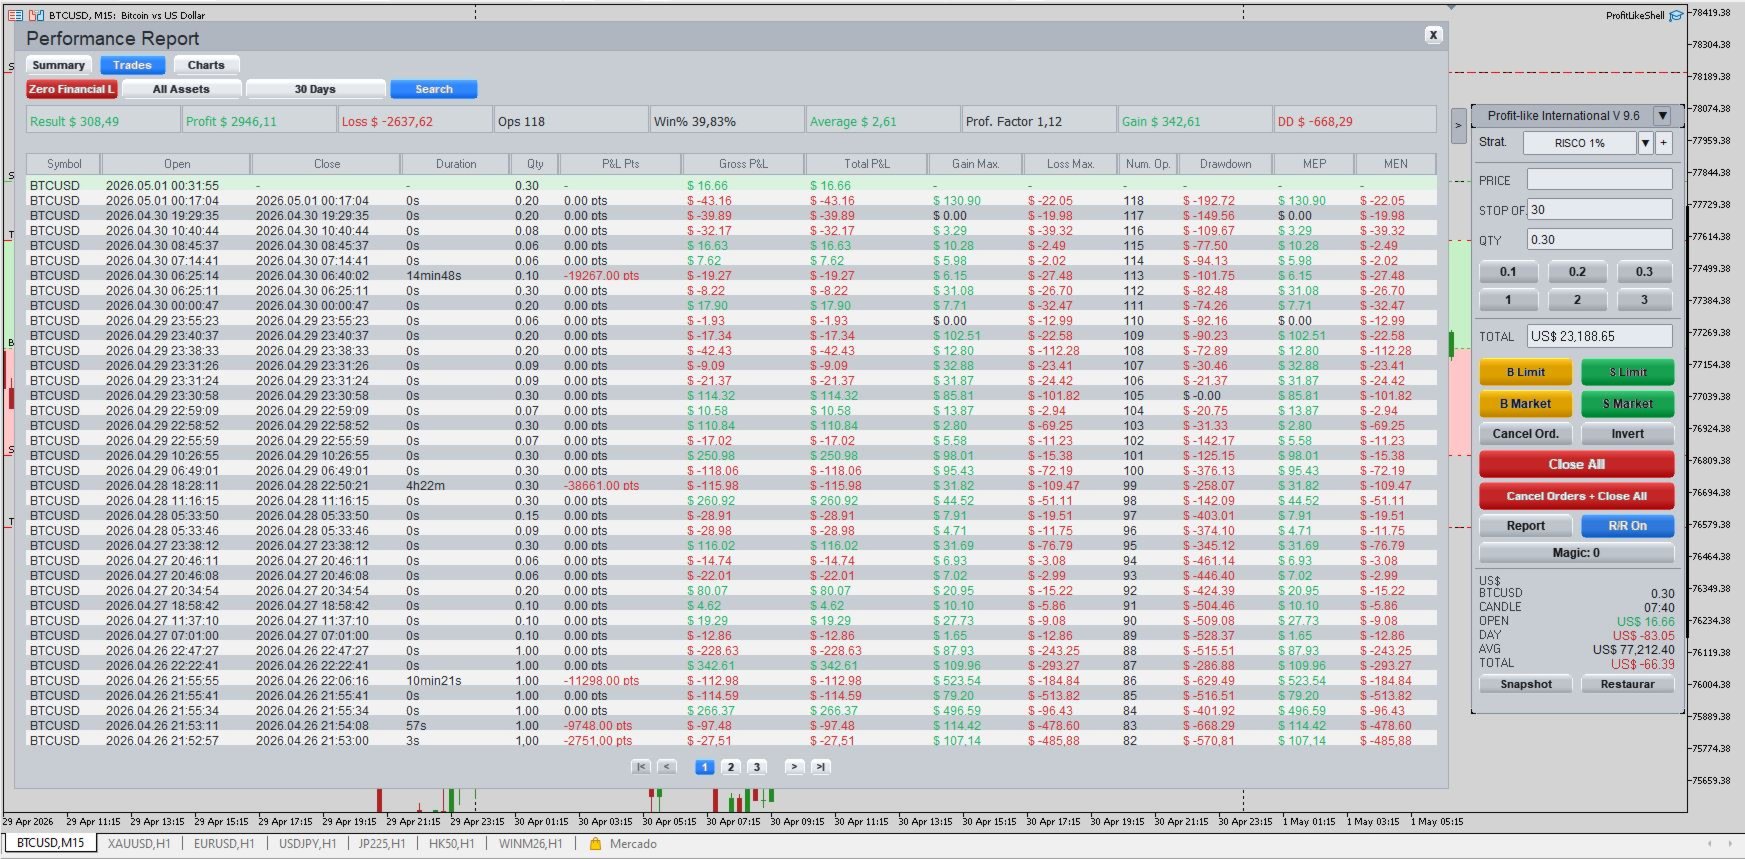
Integrated performance report

  • The application includes a built-in report module accessible from inside the EA.
  • Displays relevant performance information in a clear and organized format.
  • Ideal for monitoring trading performance without leaving the main screen.

Detailed operations tab

  • Structured display of executed trades, focused on readability and follow-up.
  • Useful fields for operational analysis and performance review.
  • Helps the user better understand strategy behavior over the selected interval.

Relevant performance metrics

The report includes useful metrics such as:

  • Symbol
  • Entry
  • Exit
  • Trade Duration
  • Quantity
  • Interval Result (Pts)
  • Gross Interval Result
  • Total Interval Result
  • Maximum Gain
  • Maximum Loss
  • Number of Trades
  • Drawdown
  • MEP
  • MEN

Cleaner, more professional visual experience

  • Visual refinements designed to make the panel more organized and appealing.
  • Numeric fields aligned for easier reading of results.
  • Better use of panel space, avoiding a cramped appearance.

Financial indicators on the panel

  • Displays fields such as:
    • Open Result
    • Day Result
    • Average
    • Total
  • Information shown directly on the panel for quick reading during trading.
  • Excellent for continuous monitoring without opening extra screens.

Reading in points, monetary value, or percentage

  • The structure is designed to present performance in different viewing formats.
  • Users can monitor results in the format that best fits their analysis style.
  • More flexibility for different trading profiles.

Overlay interface on the chart

  • The panel works directly over the chart, creating an integrated visual experience.
  • Reduces constant window switching and improves workflow.
  • Keeps the trader focused on execution and essential data.

Organized tabs and menus

  • Access to internal tabs and menus for navigating system functions.
  • Designed to concentrate information without cluttering the main screen.
  • Makes day-to-day use more intuitive.

Professional platform-inspired experience

  • Design created to deliver the feel of a complete trading environment.
  • Strong commercial visual appeal, ideal for a marketable product.
  • Conveys the perception of a premium tool focused on productivity.

More practical operational monitoring

  • Less screen switching.
  • Less need to open multiple parallel tools.
  • More speed to monitor, adjust, and execute.

Productivity-focused design

  • Centralizes execution, result tracking, and strategy monitoring.
  • Helps reduce operational friction during use.
  • Built to improve flow, speed, and the daily user experience.

Önerilen ürünler
Do you use volume in your reading of the market? Certainly many traders use it, and do not imagine operating without it. The Color Histogram Volume Set indicator allows the user to choose the value that he considers interesting to monitor. When you pass this you will have visual confirmation and if you want you will also have the audible alert that is given by the indicator. Of course, there are other ways to try to find a high volume, such as assessing whether the volume is above av
Volume Profile VFX
Thanutchaya Phatsathit
Volume Profile VFX:  Why Choose Volume Profile VFX?  Volume Profile VFX is engineered for traders who demand precision, reliability, and a decisive edge in modern markets — and every future Dynamic Visual Effects (VFX) update is included free for the lifetime of your license.                                     Feature Volume Profile VFX Volume Logic Advanced Data Validation Engine. Verified data accuracy, overriding common broker feed inconsistencies. Data Integrity Non-Repainting & Non-Lagg
White Weis Volume Ticks
Ricardo Almeida Branco
5 (4)
White Weis Volume This indicator shows the sum of the volume in each wave, bulish or bearish, as idealized by David Weis , but it brings an important addition , which is the marking of the bar with the highest volume of the wave (White Bar)! In coding the indicator, it was sought to optimize the code to require minimal processing during use and not to overload mt5. The indicator can be used for pre-trading analysis and study, where the trader analyzes possible points of support and resistance
Value Chart Candlesticks
Flavio Javier Jarabeck
4.69 (13)
The idea of a Value Chart indicator was presented in the very good book I read back in 2020 , " Dynamic Trading Indicators: Winning with Value Charts and Price Action Profile ", from the authors Mark Helweg and David Stendahl. The idea is simple and the result is pure genius: Present candlestick Price analysis in a detrended way! HOW TO READ THIS INDICATOR Look for Overbought and Oversold levels. Of course, you will need to test the settings a lot to find the "correct" one for your approach. It
FREE
WAPV Weis Wave Chart Forex
Eduardo Da Costa Custodio Santos
MT5 için Weis Wave Chart Forex bir Fiyat ve Hacim göstergesidir. Fiyat ve Hacim okuması, Richard Demille Wyckoff tarafından oluşturulan üç yasaya dayalı olarak geniş çapta dağıtıldı: Arz ve Talep, Neden ve Etki ve Çabaya Karşı Sonuç. 1900'de R.Wyckoff, analizlerinde dalga grafiğini zaten kullanmıştı. Yıllar sonra, 1990 civarında, David Weis Otomatikleştirilmiş R. Wyckoff'un dalga grafiği ve bugün size David Weis'in dalga grafiğinin evrimini sunuyoruz. Varlıkta üretilen dalga ile ilgili Hacim mik
Breakout Boxes with Volume Pressure This indicator automates the identification of key consolidation zones (Supply and Demand) based on Market Pivots and Volatility (ATR). Unlike standard support/resistance tools, this indicator provides a unique   Volume Pressure Analysis   inside every box, giving you insight into the battle between Buyers and Sellers before a breakout occurs. Key Features Automated Supply & Demand Zones:   Automatically detects significant Pivot Highs and Lows to draw dyna
HTF Candles Nika, herhangi bir üst zaman dilimindeki tam boyutlu mumları doğrudan MetaTrader 5'teki mevcut grafiğinize yerleştirir. Grafik değiştirmeden net bir çoklu zaman dilimi görünümü sağlar. Temel Ozellikler - Üst zaman dilimi mumlarını mevcut grafikte fitil içeren dolgulu dikdörtgenler olarak çizer - Standart mum ve Heiken Ashi görüntüleme modlarını destekler - Mevcut HTF mumunun kapanışına kadar gerçek zamanlı geri sayım sayacı - Yükselen ve düşen mumlar için özelleştirilebilir renkler
FREE
Weis Waves
Flavio Javier Jarabeck
2.83 (18)
The original author is David Weis, an expert in the Wyckoff Method. The Weis Wave is a modern adaptation of the 1930's Wyckoff Method, another expert in Tape Reading techniques and Chart Analysis. Weis Waves takes market volume and stacks it into waves according to price conditions giving the trader valuable insights about the market conditions. If you want to learn more about this subject you can find tons of videos in YouTube. Just look for "The Wickoff Method", "Weis Wave" and "Volume Spread
FREE
Time and Sales Tick
Pablo Filipe Soares De Almeida
Time & Sales Tick Indicator, MetaTrader 5 için geliştirilen bir göstergedir ve gerçek zamanlı tick verilerini gösterir. Fiyat, tick hacmi ve zamanı doğrudan grafikte görüntüler. Özellikler Fiyat, hacim ve zaman bilgilerini içeren tick verilerini grafik üzerindeki bir panelde gösterir. Tick verilerini kullanıcı tarafından belirlenen aralıklara göre gruplandırır, yükselişler yeşil, düşüşler kırmızı renkle gösterilir. Panel, grafiğin istenilen köşesine yerleştirilebilir.
VP-MTF PRO - Institutional Volume Profile Multi-Timeframe                               OVERVIEW VP-MTF PRO is a professional-grade Volume Profile indicator designed for serious traders who want institutional-level analysis. It combines multi-timeframe volume profiling with automated signal generation, VPOC migration tracking, and HVN/
FREE
Volume Profile For MT5
Abdelkhabir Yassine Alaoui
Volume Profile is a very useful indicator . it allows you to spot the price levels where important price action took place. It is similar to support and resistance levels but with a different logic. ( Check Out  Fixed Range Volume Profile MT5  ) One of the first thing that traders mark up when analyzing a chart is support and resistance. Volume Profile can be used for doing that too. The indicator scans the defined number of previous bars and calculates the volume of activity at each price le
FREE
Volume Profile V6
Andrey Kolesnik
4.67 (3)
Piyasa Hacim Profili Göstergesi + Akıllı Osilatör. Döviz çiftleri, hisse senetleri, vadeli işlemler, kripto paralar gibi hemen hemen tüm enstrümanlarda hem gerçek hacimler hem de tick hacimleri üzerinde çalışır. Profil oluşturma aralığını otomatik olarak (örneğin bir haftalık veya bir aylık vb.) belirleyebileceğiniz gibi, sınırları (kırmızı ve mavi iki dikey çizgi) hareket ettirerek aralığı manuel olarak da ayarlayabilirsiniz. Histogram şeklinde görüntülenir. Belirli bir seviyedeki histogram gen
The indicator highlights the points that a professional trader sees in ordinary indicators. VisualVol visually displays different volatility indicators on a single scale and a common align. Highlights the excess of volume indicators in color. At the same time, Tick and Real Volume, Actual range, ATR, candle size and return (open-close difference) can be displayed. Thanks to VisualVol, you will see the market periods and the right time for different trading operations. This version is intended f
FREE
Volume Candle Indicator
Pablo Filipe Soares De Almeida
MetaTrader 5 için Renkli Hacim Histogramı Bu gösterge, hacmi ayrı bir pencerede histogram olarak gösterir. Çubuklar mum yönüne göre renklendirilir: yeşil yükseliş (kapanış > açılış), kırmızı düşüş (kapanış < açılış) için. Ana Özellikler Hacim kaynağı: Tick hacmi veya gerçek hacim (kullanıcı seçimi). Opsiyonel hareketli ortalama çizgisi eklenebilir. Desteklenen ortalama türleri: SMA, EMA, SMMA, LWMA. Ortalama periyodu ayarlanabilir. MetaTrader 5’te tüm semboller ve zaman dilimleriyle uyumludur.
CVD SmoothFlow Pro
Thalles Nascimento De Carvalho
CVD SmoothFlow Pro - Her Varlık İçin Sınırsız Hacim Analizi! CVD SmoothFlow Pro , hassas ve sınırsız bir hacim analizi arayan trader'lar için nihai çözümüdür. Cumulative Volume Delta (CVD) hesaplamasını ve gelişmiş gürültü filtrelemesini kullanarak, Pro sürümü herhangi bir finansal varlık için gereken esneklik ve doğruluğu sağlar. CVD SmoothFlow Pro Neler Sunar? Açık Analiz : Pazar gürültüsünü filtreler ve her finansal varlıkta önemli hacim hareketlerini vurgular. ️ Kesin Hesaplama : Alım
Volume Weighted Average Price or VWAP is an indicator wich shows different average prices on chart. This is very useful to find strong negotiation price areas and as trend following. Configurations: Day, Week and Month - Show different VWAPs according to the period. You can change each line style on "colors" tab. Any doubt or suggestion please contact us. Enjoy! This is a free indicator, but it took hours to develop. If you want to pay me a coffee, I appreciate a lot   <3 PayPal, Skrill, Nete
FREE
VWAP Indicator
LUC JACOBUS A VERHEECKE
4.08 (26)
Volume Weighted Average Price (VWAP) The volume weighted average price (VWAP) is a  trading   benchmark  used by traders that gives the average price a security has traded at throughout the day, based on both volume and price. It is important because it provides traders with insight into both the trend and value of a security. This indicator VWAP V2 is free and is the manual version of the extended Easy VWAP indicator (30 Euro), where the date and time properties are automatically entered. With
FREE
Statistical Arbitrage Spread Generator for Cointegration [MT5] What is Pair Trading? Pair trading is a market-neutral strategy that looks to exploit the relative price movement between two correlated assets — instead of betting on the direction of the market. The idea? When two assets that usually move together diverge beyond a statistically significant threshold, one is likely mispriced. You sell the expensive one, buy the cheap one , and profit when they converge again. It’s a statistica
FREE
Waves Sizer
Flavio Javier Jarabeck
3.86 (7)
Wyckoff fans, enjoy! Ideally to be used with the Weis Waves indicator, but it can be easily used alone, the Waves Sizer puts the range (in resulting Price movement) done by the Price on its market swings. You can control how accurate or loose will be the swings. This tool is very helpful for visually know how much the Price has traveled in your Timeframe. This way you can confront this level of effort with the resulting Volume, etc... Weis Waves indicator: https://www.mql5.com/en/market/produc
FREE
Stackable VWAP
Flavio Javier Jarabeck
3.5 (4)
Volume Weighted Average Price (VWAP) is a trading benchmark commonly used by Big Players that gives the average price a Symbol has traded throughout the day. It is based on both Volume and price. Additionally we put in this indicator the MVWAP (Moving Volume Weighted Average Price). For those who do not know the usage and the importance od this indicator I recommend a great article about this subject at Investopedia ( https://www.investopedia.com/articles/trading/11/trading-with-vwap-mvwap.asp
FREE
Market Profile 3 ForexArby com
Hussien Abdeltwab Hussien Ryad
4 (15)
Market Profile 3 MetaTrader 5 indicator  version 4.70— is a classic Market Profile implementation that can show the price density over time, outlining the most important price levels, value area, and control value of a given trading session. This indicator can be attached to timeframes between M1 and D1 and will show the Market Profile for daily, weekly, monthly, or even intraday sessions. Lower timeframes offer higher precision. Higher timeframes are recommended for better visibility. It is als
FREE
Advanced Volume Profile Liquidity Analysis via Custom Area Selection The Advanced Manual Volume Profile is a precision tool for MetaTrader 5 designed to deconstruct market structure through price-level volume analysis. Unlike static profiles, this indicator exclusively processes the price and time range defined by the user via a rectangle object, offering a surgical view of the market auction. Elite Technical Specifications Dynamic Algorithm: Real-time calculation (400ms refresh rate) based on t
VectorPrime EA MT5
Maxim Kurochkin
4.2 (15)
VectorPrime — Çok Katmanlı Vektör Mantığına Sahip Algoritmik Sistem VectorPrime, çoklu zaman dilimi piyasa koşullarında yapılandırılmış işlem yürütmesi için tasarlanmış otonom bir ticaret sistemidir. Çekirdeğinde fiyat dinamiklerini yönlü impulslar ve matris yapıları şeklinde ayrıştıran vektör analizi kavramı bulunur. Sistem, piyasa akışını izole edilmiş sinyaller olarak değil, bütünsel bir piyasa haritası oluşturan birbirine bağlı vektörler olarak yorumlar. VectorPrime’ın ana modülleri: Vector
ABQ Visual Risk Sizer
Cristian David Castillo Arrieta
ABQ Visual Risk Sizer - Kurumsal Risk ve Islem Uygulama Kategori: Araclar / Risk Yonetimi Manuel lot hesaplamasi zaman ve para kaybina neden olur. Modern islem dunyasinda, ozellikle fon hesaplari (Prop Firms) yonetirken, lot boyutu hesaplama hatasi veya emir girerken yasanan 5 saniyelik bir gecikme, Gunluk Kayip (Drawdown) kuralinin ihlal edilmesine veya mukemmel giris fiyatinin kacirilmasina neden olabilir. ABQ Visual Risk Sizer , bu sorunu kesin olarak cozmek icin tasarlanmis kurumsal duzeyde
Read This : Please provide comments and reviews for future improvements. WaveTrendPro_Indi v1.05 WaveTrend indicator with enhanced histogram visualization : Histogram is now scaled higher (adjustable via  HistScale ). Different colors for positive & negative bars, making trend direction clearer. Lightweight & responsive across pairs and timeframes. Perfect for scalpers, swing traders, and trend-following strategies. WaveTrendPro_Indi v1.05 Indikator WaveTrend dengan tampilan histogram yang le
FREE
Weis Wave Scouter
Jean Carlos Martins Roso
MetaTrader 5 için geliştirilen Weis Wave Scouter ile gelişmiş hacim analizinin gücünü keşfedin! Bu devrim niteliğindeki gösterge, Wyckoff yönteminin ve Hacim Yayılımı Analizinin (VSA) kanıtlanmış ilkelerini birleştiriyor. Operasyonlarında doğruluk ve derinlik arayan yatırımcılar için tasarlanmıştır ve kümülatif hacim dalgası analizi yoluyla piyasanın taktiksel bir okumasını sunar. Weis Wave Scouter, Classic, NightVision ve OceanBreeze gibi özelleştirilebilir renk temaları ile renkli histogramlar
1.       Overview The Volume Pressure Histogram (VPH) is a custom indicator for MetaTrader 5 (MT5) that measures buying and selling pressure based on tick or real volume. It highlights extreme buying/selling moments and provides a smoothed signal line for trend detection. 2.       Indicator Components ·          Volume Pressure Histogram (Colored): o    Green: Extreme buying pressure o    Lime: Buying pressure o    Red: Extreme selling pressure o    Yellow: Selling pressure ·          Signal Li
The   Real Flow Defense Levels   indicator is a proprietary tool designed to identify and plot   significant, high-conviction price zones   directly onto your main trading chart. It uses a dynamic, volume-based analysis to determine where the market has previously demonstrated the   strongest defense or concentration of activity . These plotted lines serve as   dynamic support and resistance levels , highlighting the prices where major participants are most likely to enter or defend their positi
Cumulative Volume Delta CVD
Jerome Stephane Eric Brivet
JB Cumulative Volume Delta — See Who Is Buying and Who Is Selling Price tells you WHAT happened. Volume tells you WHO did it. But standard volume indicators (OBV, Volume Profile) treat all volume the same — they cannot distinguish buying pressure from selling pressure. CVD (Cumulative Volume Delta) solves this by decomposing each candle's volume into buy volume and sell volume using body/wick analysis. A bullish candle with a large body = mostly buy volume. A bearish candle with long wicks =
Features 3 types of waves: bullish, bearish and unknown. The unknown tower comes when prices move in opposite the direction of the current tower. Label that shows the percentage remaining for the next tower. Allows you set the type of volume that will be accumulated in the towers, either real or tick volumes. Thus, the indicator works in any market, for example: stocks, futures, forex, commodities, etc. Allows you to set the required score for the tower exchange. Allows you to set the font size
Bu ürünün alıcıları ayrıca şunları da satın alıyor
The core idea: using the user interface, you configure the parameters the chart must meet before entering a position (or positions), choose which entry models to use, and set the rules for when trading and planning should end. Lazy Trader  handles the rest: it  takes over all the routine chart watching and execution! full description  :: 3 key videos [1] ->  [2]   ->  [3] What can it do? - Understands Larry Williams market structure - Understands swing market structure by Michael Huddleston
EA price is reduced to 50% discount for limited time period. Spot vs Future Arbitrage EA for MT5 Spot vs Future Arbitrage EA is an automated Expert Advisor designed for MetaTrader 5 that operates using price differences between Gold spot and Gold futures instruments. The strategy opens positions on both instruments simultaneously to take advantage of temporary differences between spot and futures prices. Requirements The trading account must provide both Gold spot and Gold futures instruments
Gold instrument scanner is the chart pattern scanner to detect the triangle pattern, falling wedge pattern, rising wedge pattern, channel pattern and so on. Gold instrument scanner uses highly sophisticated pattern detection algorithm. However, we have designed it in the easy to use and intuitive manner. Advanced Price Pattern Scanner will show all the patterns in your chart in the most efficient format for your trading. You do not have to do tedious manual pattern detection any more. Plus you
FiboPlusWave Series products Ready-made trading system based on Elliott waves and Fibonacci retracement levels . It is simple and affordable. Display of the marking of Elliott waves (main or alternative option) on the chart. Construction of horizontal levels, support and resistance lines, a channel. Superposition of Fibonacci levels on waves 1, 3, 5, A Alert system (on-screen, E-Mail, Push notifications).    Features: without delving into the Elliott wave theory, you can immediately open one of
I automated its commercial strategies for use of binary in MT5 and with our Mt5BridgeBinary I sent the orders to its Binary account and I list: begin to operate this way of easy! The expert advisers are easy to form, to optimize and to realize hardiness tests; also in the test we can project its long-term profitability, that's why we have created Mt5BridgeBinary to connect its best strategies to Binary. Characteristics: - It can use so many strategies as I wished. (Expert Advisor). - He does
Xrade EA is an expert advisor as technical indicator. For short period trade it's the best for next previsions of the trend of the market. +--------------------------------------------------------------------------------------- Very Important Our robot(data anylizer) does'nt take a trade procedure. If using only our robot you must take positions by yoursels +--------------------------------------------------------------------------------------- The technical indiator provide for a given sma
News: IDEA 2.0 is out with lot of features, like telegram bot notifications and Limits order! Check the changelog at bottom of page (*). Hi all, here you can find my Expert Advisor, called IDEA  (Intelligent Detection & managEr Algorithm) . In short, with this software you can: Have   a clear view of market status , with an indication of current trend. Simply add symbols you want to monitor to your market watch, and IDEA will notify you if some of them are in trend; Have an   automatic lots ca
PROMOTION!! $499 until 1 Mar. After that, EA will be $1,050 Developed and tested for over 3 years, this is one of the safest EAs on the planet for trading the New York Open. Trading could never be easier.  Trade On NASDAQ US30 (Dow Jones Industrial Average) S&P 500  What Does The EA do? The EA will open a Buy Stop Order and a Sell Stop Order(With SL and TP) on either side of the market just a few seconds before the NY Open.  As soon as 1 of the 2 trades is triggered, the EA automatically delete
Saving data from the order book. Data replay utility: https://www.mql5.com/en/market/product/71640 Library for use in the strategy tester: https://www.mql5.com/en/market/product/81409 Perhaps, then a library will appear for using the saved data in the strategy tester, depending on the interest in this development. Now there are developments of this kind using shared memory, when only one copy of the data is in RAM. This not only solves the memory issue, but gives faster initialization on each
Instead of sticking to the Charts,let's use ALL IN ONE KEYLEVEL Announcement: We are pleased to announce the latest version 14.02 of the One In One Keylevel product. This is a reliable product that has been upgraded with many new features and improvements to make your work easier and more efficient. Currently, we have a special promotion for this new version. The current discounted price is $500, and there are only 32 units left. After that, the price will increase to $1000, and will continue to
The EA Protection Filter ( MT4 version here ) provides a news filter as well as a stock market crash filter, which can be used in combination with other EAs. Therefore, it serves as an additional protective layer for other EAs that do provide such filters.  During backtest analysis of my own night scalpers, which already use a stock market crash filter, I noticed that the historic drawdown,  especially during stock market crash phases like 2007-2008, was reduced significantly by using such a fil
Hedge Ninja
Robert Mathias Bernt Larsson
3 (2)
Make sure to join our Discord community over at www.Robertsfx.com , you can also buy the EA at robertsfx.com WIN NO MATTER IN WHICH DIRECTION THE PRICE MOVES This robot wins no matter in which direction the price moves by following changing direction depending on in which direction price moves. This is the most free way of trading to this date. So you win no matter which direction it moves (when price moves to either of the red lines as seen on the screenshot, it wins with the profit target you
Best for Technical Analysis You can set from one key shortcut for graphical tool or chart control for technical analysis. Graphic design software / CAD-like smooth drawing experience. Best for price action traders. Sync Drawing Objects You don’t need to repeat drawing the same trend line on the other charts. Shortcuts do that for you automatically. Of course, any additional modifications of the object immediately apply to the other charts too. Colors depend on Timeframe Organize drawings with
Gold Wire Trader MT5 trades using the RSI Indicator. It offers many customizable RSI trading scenarios and flexible position management settings, plus many useful features like customizable trading sessions, a martingale and inverse martingale mode. The EA implements the following entry strategies, that can be enabled or disabled at will: Trade when the RSI Indicator is oversold or overbought Trade when the RSI comes back from an oversold or overbought condition Four different trading behavio
Gold trend scanner MT5 a multi symbol multi timeframe dashboard that monitors and analyzes Average True Range indicator value in up to 28 symbols and 9 timeframes  in 3 modes :  It shows the ATR indicator value in all pairs and timeframes and signals when the ATR value reaches a maximum or minimum in a given duration. Short term ATR/Long term ATR ratio: It shows ratio of 2 ATRs with different periods. It's useful in detecting short term volatility and explosive moves. ATR Value/Spread ratio: S
Attention: this is a multicurrency EA, which trades by several pairs from one chart!  Therefore, in order to avoid duplicate trades, it is necessary to attach EA only to one chart, ---> all trading in all pairs is conducted only from one chart! we can trade simultaneously in three different pairs, as by default (EURUSD + GBPUSD + AUDUSD), which take into account the correlation when entering the market for all three; we can trade only EURUSD (or any currency pair) and at the same time take into
A triangular arbitrage strategy exploits inefficiencies between three related currency pairs, placing offsetting transactions which cancel each other for a net profit when the inefficiency is resolved. A deal involves three trades, exchanging the initial currency for a second, the second currency for a third, and the third currency for the initial. With the third trade, the arbitrageur locks in a zero-risk profit from the discrepancy that exists when the market cross exchange rate is not aligned
Gold index expert MT5 Wizard uses Multi-timeframe analysis. In simpler terms, the indicator monitors 2 timeframes. A higher timeframe and a lower timeframe. The indicator determines the trend by analyzing order flow and structure on the higher timeframe(4 hour for instance). Once the trend and order flow have been determined the indicator then uses previous market structure and price action to accurately determine high probability reversal zones. Once the high probability reversal zone has bee
Golden Route home MT5 calculates the average prices of BUY (LONG) and SELL (SHORT) open positions, taking into account the size of open positions, commissions and swaps. The indicator builds the average line of LONG open positions, after crossing which, from the bottom up, the total profit for all LONG positions for the current instrument becomes greater than 0. The indicator builds the average line of SHORT open positions, after crossing which, from top to bottom, the total profit for all SH
Do you want an EA with small stoploss? Do you want an EA that is just in and out of market? Gold looks at several MT5 It is ONLY buying when the market opens and with a window of 10 minutes or less. It uses pre-market price so be sure your broker has that.   This strategies (yes, it is 2 different strategies that can be used with 3 different charts) have tight stoplosses and a takeprofit that often will be reached within seconds! The strategies are well proven. I have used them manually for
Bionic Forex
Pablo Maruk Jaguanharo Carvalho Pinheiro
Bionic Forex - Humans and Robots for profit. Patience is the key. The strategies are based on: - Tendency - Momentum + High Volatility - Dawn Scalper + Support Resistence. Again, patience is the key. No bot is flawless, sometimes it will work seamlessly, sometimes it simply won't.  it's up to you manage its risk and make it a great friend to trade automatically with fantastic strategies. Best regards, Good luck., Pablo Maruk.
ABOUT THE PRODUCT Your all-in-one licensing software is now available. End users are typically granted the right to make one or more copies of software without infringing on third-party rights. The license also specifies the obligations of the parties to the license agreement and may impose limitations on how the software can be used. AIM OF THE SOFTWARE The purpose of this system is to provide you with a one-of-a-kind piece of software that will help you license and securely track your MT4/MT5
The purpose of this service is to warn you when the percentage of the margin level exceeds either a threshold up or down. Notification is done by email and/or message on mobile in the metatrader app. The frequency of notifications is either at regular time intervals or by step of variation of the margin. The parameters are: - Smartphone (true or false): if true, enables mobile notifications. The default value is false. The terminal options must be configured accordingly. - email (true or false)
基于Goodtrade/GoodX 券商推出的黄金双仓对冲套利的交易模型/策略/系统,在日常的操作遇到的问题: 1、B账户跟随A账户即刻下单。 2:A账户 下单后  B账户 自动抄写止损止盈。 3:A账户平仓B账户同时平仓。 4:B账户平仓A账户也平仓。 5:不利点差下拒绝下单。 6:增加有利点值因子。 通过解决以上问题,改变了熬夜、手工出错、长期盯盘、紧张、恐慌、担心、睡眠不足、饮食不规律、精力不足等问题 目前解决这些问题后,有效提升了工作效率和盈利比例,由原来月10%盈利率提升到月45%的最佳盈利率。 原来的一名交易员只能管理操作两组账户,通过此EA提高到操作管理高达16组交易账户,或许你可以超越我们的记录,期待你的经验交流。 此EA分为: GoodtradeGoodX Tradercropy A       GoodtradeGoodX Tradercropy B     是一个组合EA,假设您购买的额  GoodtradeGoodX Tradercropy   A  必须同时购买 GoodtradeGoodX Tradercropy   B  两个组合使用会到最佳效果。   
El EA Boton pone botones de Buy y Sell en la pantalla Ideal para usuarios que habren muchas ordenes y diferentes pares 9 botones buy desde 0.01 al 0.09 y 9 botones sell de 0.01 al 0.09 9 botones buy desde 0.1 al 0.9 y 9 botones sell de 0.1 al 0.9 Boton Close buy y sell Boton Close buy positivos y Boton Sell positivos Boton Close buy negativos y Boton Sell negativos un boton close all y botones buy de 1, 5 y 10 y botones de sell 1,5, 10
Отличный помощник для тех кто грамотно распоряжается своими рисками. Данный помощник просто не заменим если у вас всегда должен быть фиксированный риск на сделку. Помогает автоматически высчитывать лот в зависимости от вашего риска. Теперь можно не беспокоиться о том каким будет ваш Stoploss, риск всегда будет одинаковый. Считает объем сделок как для рыночных ордеров так и для отложенных. Удобный и интуитивно понятный интерфейс, так же есть некоторые дополнительные функции для упрощения вашей то
Dedicated for FTMO and other Prop Firms Challenges 2020-2024 Trade only GOOD and checked PROP FIRMS  Default parameters for Challenge $100,000 Best results on GOLD and US100  Use any Time Frame Close all deals and Auto-trading  before  US HIGH NEWS, reopen 2 minutes after Close all deals and Auto-trading  before Weekend at 12:00 GMT+3  Friday Recommended time to trade 09:00-21:00 GMT+3 For Prop Firms MUST use special  Protector  https://www.mql5.com/en/market/product/94362 --------------------
Introducing TEAB Builder - The Ultimate MT5 Expert Advisor for Profoundly Profitable and Customizable Trading!     Are you ready to take your trading to the next level? Meet TEAB Builder, an advanced MT5 Expert Advisor designed to provide unparalleled flexibility, high-profit potential, and an array of powerful features to enhance your trading experience. With TEAB Builder, you can effortlessly trade with any indicator signal, allowing you to capitalize on a wide range of trading strategies.  
Chart Walker X Engine | Machine-led instincts Powerful MT5 chart analysis engine equipped with a sophisticated neural network algorithm. This cutting-edge technology enables traders to perform comprehensive chart analysis effortlessly on any financial chart. With its advanced capabilities, Chart Walker streamlines the trading process by providing highly accurate trading entries based on the neural network's insights. Its high-speed calculations ensure swift and efficient analysis, empowering tra
The Wall Street Player (Master version). This EA tailored as a Discipline, Money and Risk Management tool is a powerful Trade Station utility designed for Forex, Cryptos, Commodities, Shares, Deriv synthetic pairs and any CFDs Market. It is designed to fit your strategy as a winner, and take your Edge of the market to the NEXT-LEVEL. The only thing to do is to get It on your chart and appreciate the possibilities and chart management abilities it has to offer for realizing that discipline and a
Filtrele:
Değerlendirme yok
Değerlendirmeye yanıt