ChartTradingPRO

ChartTradingPRO

Features and Benefits

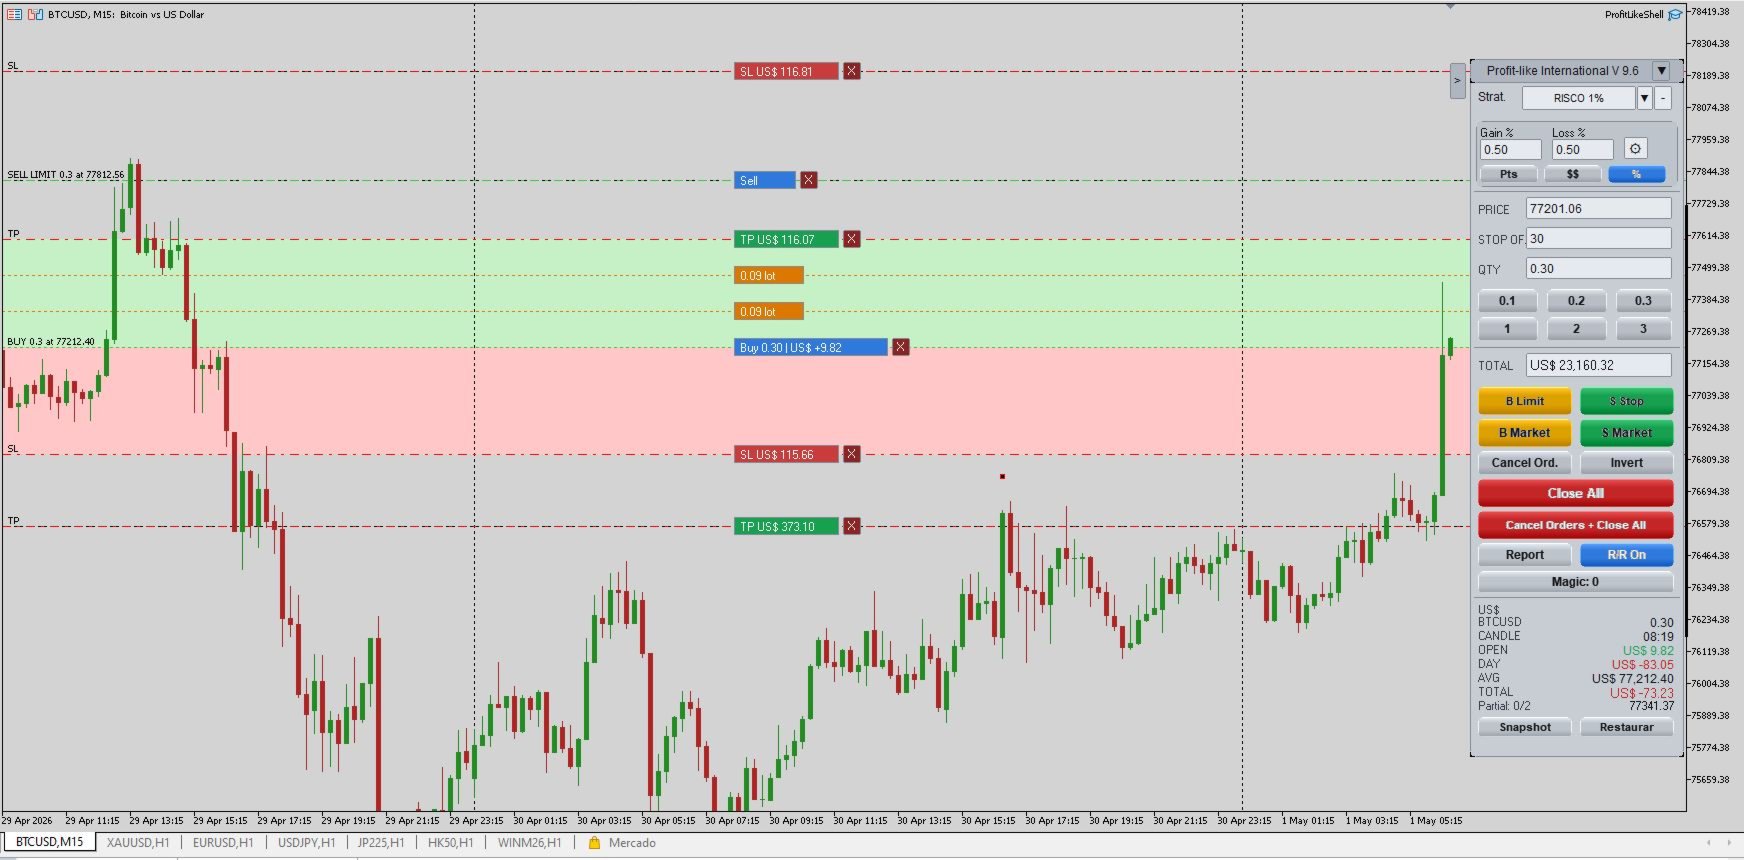
Side trading panel

  • Practical and objective side panel with quick access to the main trading commands.
  • Visual layout inspired by professional platforms, offering easy reading and a faster workflow.
  • Organizes the most important functions in one place, reducing clicks and saving time during execution.

Fast order execution

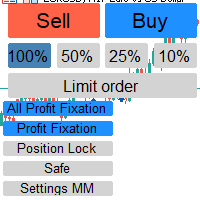
  • Buy and sell buttons with direct access from the panel.
  • Makes trade entries faster, especially for short-term operations and timing decisions.
  • Helps traders operate with more agility and less terminal navigation.

Position size control

  • Quick quantity/lot selection directly from the panel.
  • Preset buttons designed to speed up position sizing.
  • More convenience for traders who frequently switch between different order sizes during the session.

Market modes: B3 and International

  • Easy switching between B3 and International directly from the panel.
  • Each mode preserves the same visual concept while adapting the display to the selected market.
  • Allows the same operational structure to be used in different environments with a consistent user experience.

Market-specific visual adaptation

  • In B3 mode, monetary fields follow the Brazilian real (R$) convention.
  • In International mode, fields follow the US dollar (US$) standard.
  • Improves result reading and reduces visual confusion during live trading.

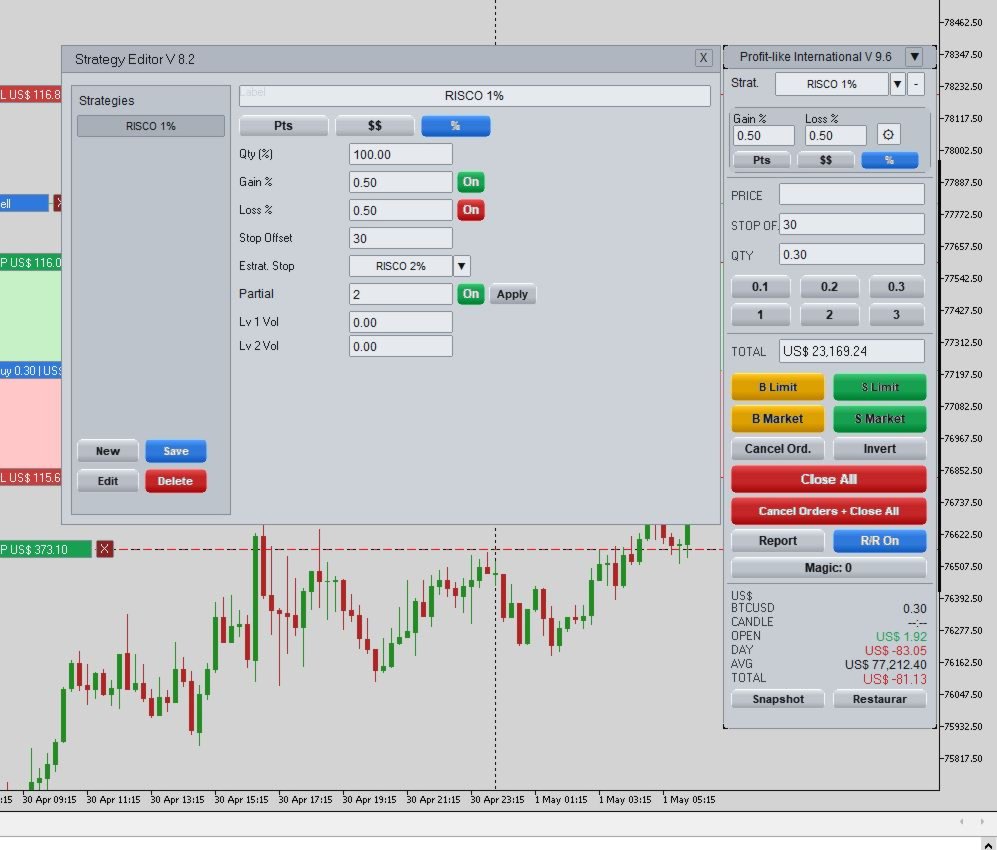
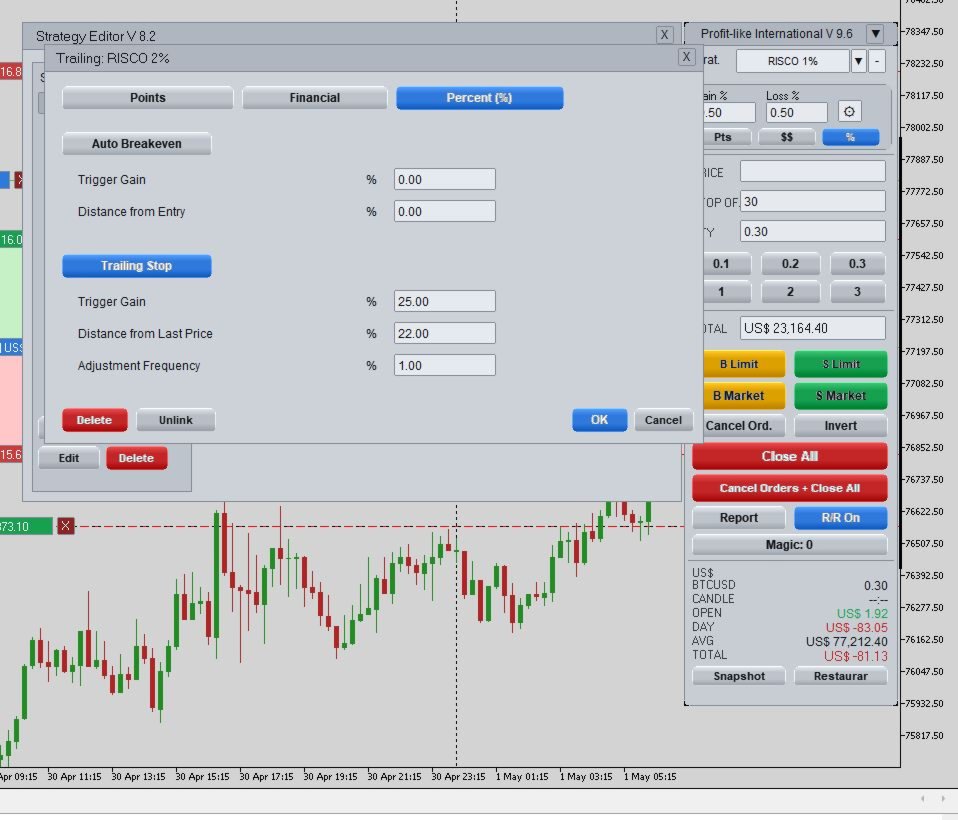
Built-in strategy editor

  • Dedicated area to configure and adjust strategies within the application workflow itself.
  • Centralizes operational management without relying on multiple scattered windows.
  • A better experience for users who need to review parameters quickly.

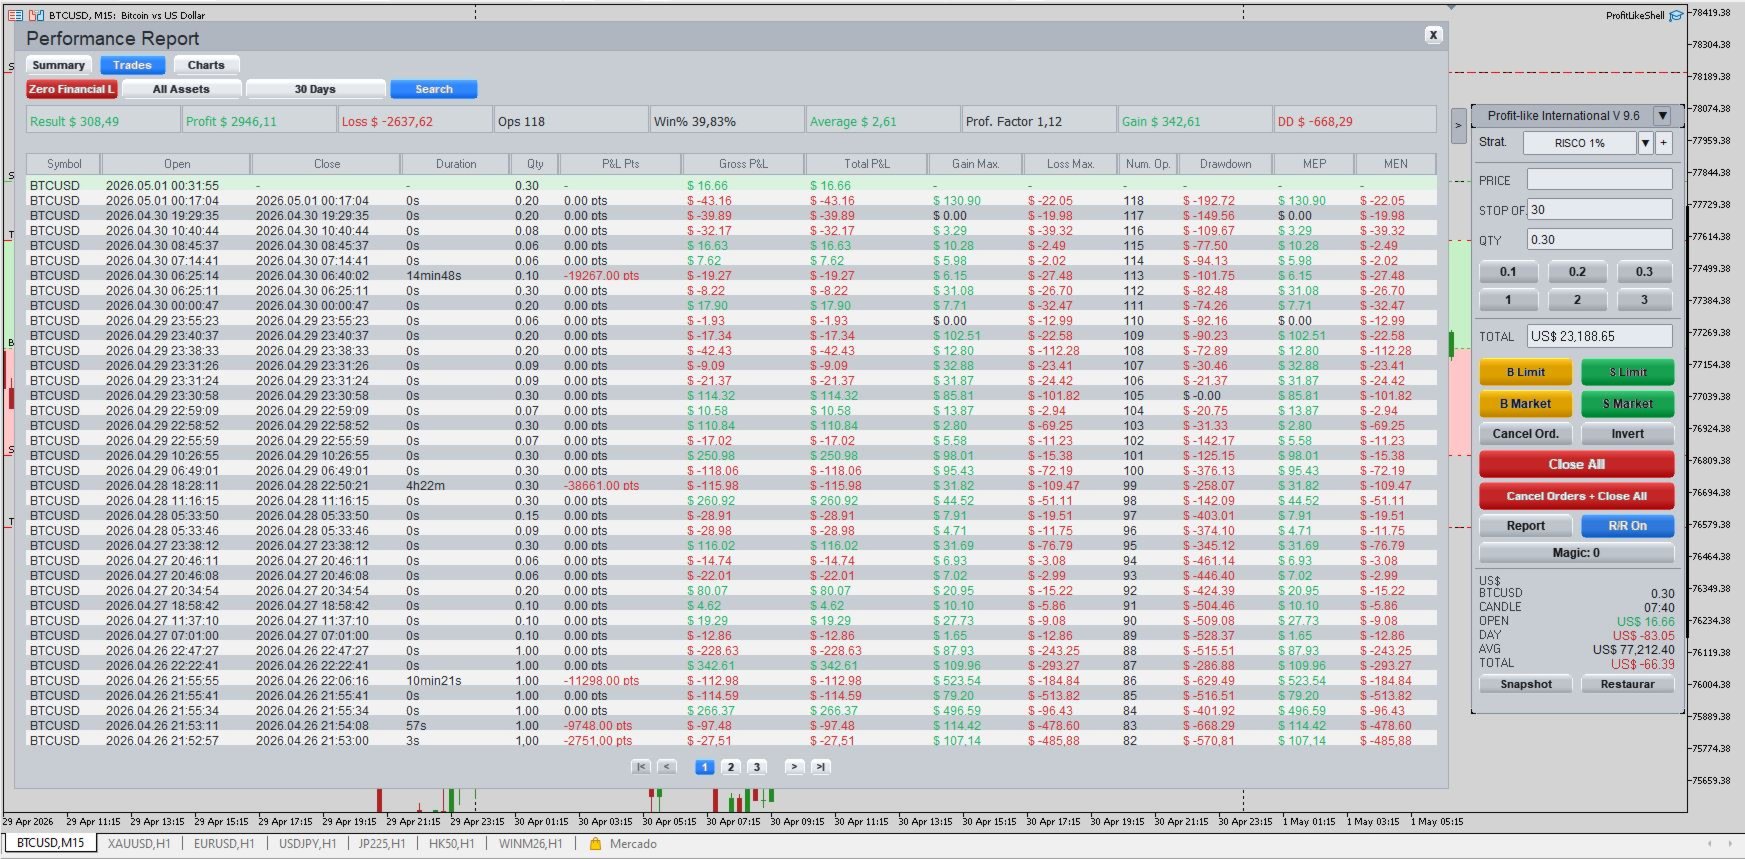
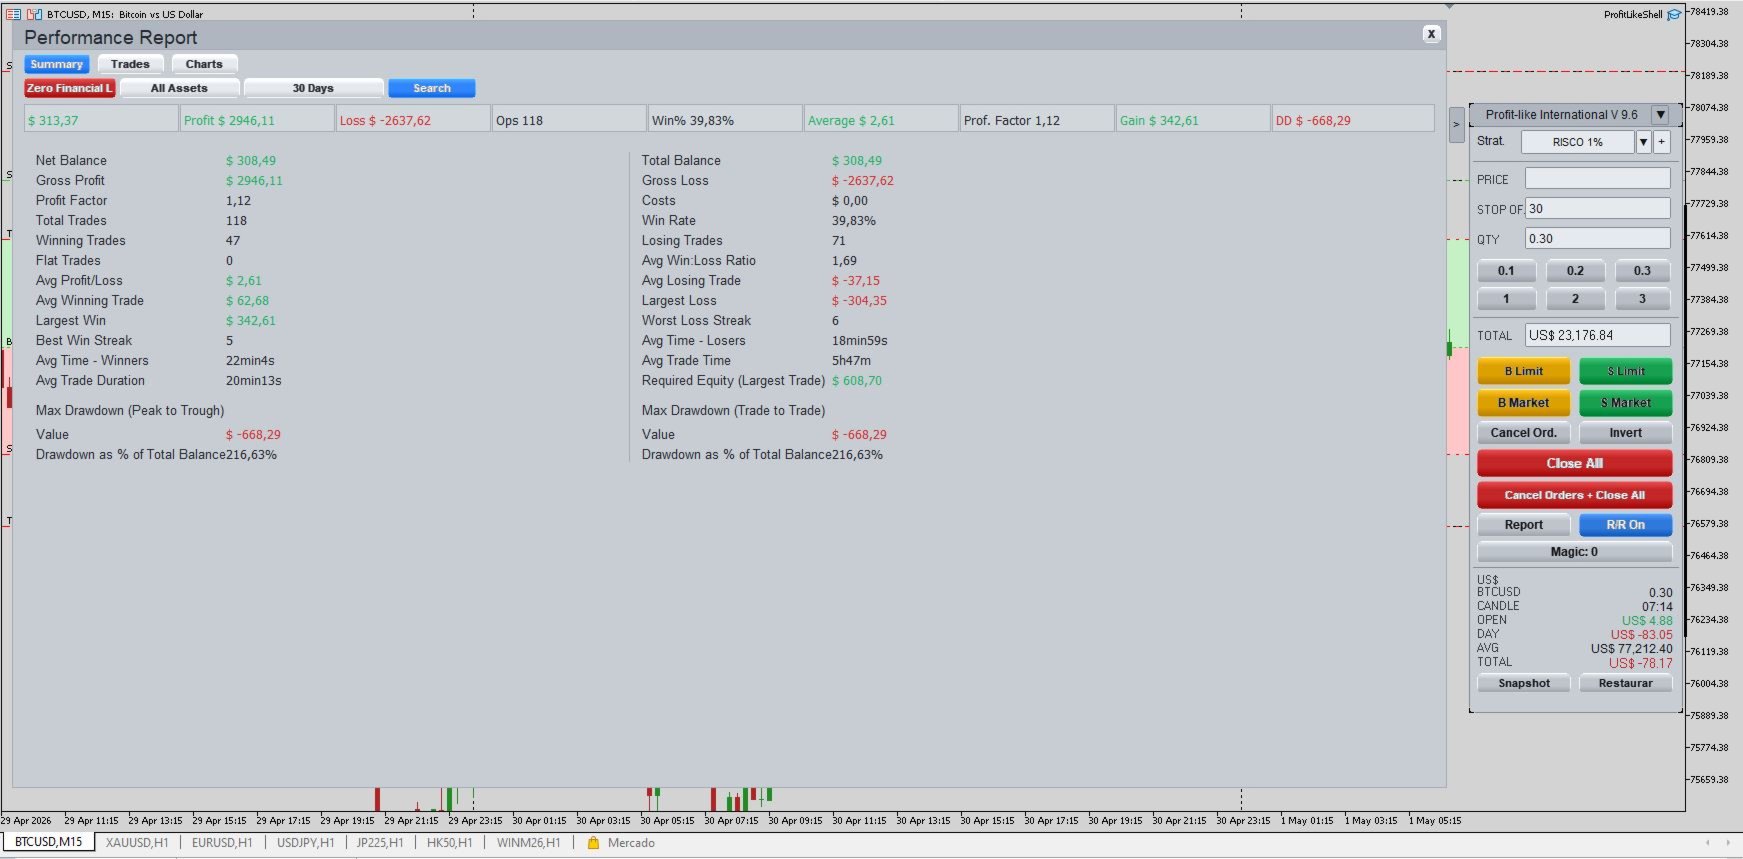
Integrated performance report

  • The application includes a built-in report module accessible from inside the EA.
  • Displays relevant performance information in a clear and organized format.
  • Ideal for monitoring trading performance without leaving the main screen.

Detailed operations tab

  • Structured display of executed trades, focused on readability and follow-up.
  • Useful fields for operational analysis and performance review.
  • Helps the user better understand strategy behavior over the selected interval.

Relevant performance metrics

The report includes useful metrics such as:

  • Symbol
  • Entry
  • Exit
  • Trade Duration
  • Quantity
  • Interval Result (Pts)
  • Gross Interval Result
  • Total Interval Result
  • Maximum Gain
  • Maximum Loss
  • Number of Trades
  • Drawdown
  • MEP
  • MEN

Cleaner, more professional visual experience

  • Visual refinements designed to make the panel more organized and appealing.
  • Numeric fields aligned for easier reading of results.
  • Better use of panel space, avoiding a cramped appearance.

Financial indicators on the panel

  • Displays fields such as:
    • Open Result
    • Day Result
    • Average
    • Total
  • Information shown directly on the panel for quick reading during trading.
  • Excellent for continuous monitoring without opening extra screens.

Reading in points, monetary value, or percentage

  • The structure is designed to present performance in different viewing formats.
  • Users can monitor results in the format that best fits their analysis style.
  • More flexibility for different trading profiles.

Overlay interface on the chart

  • The panel works directly over the chart, creating an integrated visual experience.
  • Reduces constant window switching and improves workflow.
  • Keeps the trader focused on execution and essential data.

Organized tabs and menus

  • Access to internal tabs and menus for navigating system functions.
  • Designed to concentrate information without cluttering the main screen.
  • Makes day-to-day use more intuitive.

Professional platform-inspired experience

  • Design created to deliver the feel of a complete trading environment.
  • Strong commercial visual appeal, ideal for a marketable product.
  • Conveys the perception of a premium tool focused on productivity.

More practical operational monitoring

  • Less screen switching.
  • Less need to open multiple parallel tools.
  • More speed to monitor, adjust, and execute.

Productivity-focused design

  • Centralizes execution, result tracking, and strategy monitoring.
  • Helps reduce operational friction during use.
  • Built to improve flow, speed, and the daily user experience.
推荐产品
Heiken Ashi Stacked Pro is a chart overlay indicator that combines smooth Heiken Ashi visual trend candles, a real-time bar completion timer, and an on-hover crosshair HUD for instant price and wick-to-body ratio diagnostics. Marketplace Description Overview Heiken Ashi Stacked Pro upgrades standard Heiken Ashi candle visuals with an interactive HUD. Designed for trend followers and price action traders, it filters out market noise using colored candles while supplying precise candle metric read
Clock Et Mt5
Andrew Tsujiguchi
在图表上显示简洁的美国东部时间(ET)时钟,自动与美股交易时间同步。每秒更新。 Full description: ClockET — 轻量级指标,直接在图表上显示当前的美国东部时间(ET)日期和时间,让您始终准确掌握美股交易时段的进度 — 无需手动计算时区。 图表显示内容 • 实时时钟 — 显示星期、月份、日期和ET时间,每秒更新(例如 "Thu Jul 24  07:36:45 ET") • 居中标签 — 显示在图表底部,图表调整大小时自动重新居中 • 自动夏令时检测 — 根据美国官方夏令时规则(3月第二个星期日至11月第一个星期日)自动在EDT(UTC-4)和EST(UTC-5)之间切换 — 无需每年手动调整两次 设置 • 字体大小、字体颜色、字体名称 — 自定义时钟外观 • Y轴偏移 — 距图表底部的垂直位置 • Auto DST — 启用/禁用自动EDT/EST检测 • 手动ET偏移 — 可选的固定UTC偏移量,仅在禁用Auto DST时使用 支持平台 • MetaTrader 5 (ClockET.mq5) • MetaTrader 4 (ClockET.m
FREE
VolumaxProfile
Alexandre Vincent Traber
概述 VolumaxProfile 直接在图表上构建真实的成交量分布图,显示所选周期内各价格水平的成交量集中位置。自 动标出成交量控制点(POC)和价值区域(VAH/VAL)。 工作原理 扫描最近N根K线(Lookback_Bars),将价格区间划分为若干 行 将每根K线的成交量分配到其触及的价格行 为每行绘制与成交量成比例的水平直方图 识别POC(成交量最高的行)并计算覆盖设定百分比的价值区域 每根新K线自动重建 输入参数 Lookback_Bars: 用于构建分布图的K线数量 Row_Count: 价格行数量 Value_Area_Pct: 价值区域覆盖的成交量百分比 Max_Bar_Width_Px: 直方图最大宽度 Show_POC: 显示POC线 Show_Value _Area: 显示VAH/VAL线 Use_Tick_Volume: 使用tick成交量或真实成交量 Color_Profile: 直方图颜色 Color_ValueArea: 价值区域颜色 Color_POC: POC线颜色 Color_VAH_VAL: VAH/VAL线颜色 推荐设置 适用于任何品种和
FREE
TECHNICAL SPECIFICATION — PRICE CONTEXT, VOLUME AND MARKET INTEREST REGIONS INDICATOR Develop an indicator based on the analysis of price context, volume, and market structure , with the purpose of identifying and visually representing areas of market interest on the chart. The system should use lines, zones, and arrow markers to highlight relevant areas of the market, including situations where a significant buying or selling effort has occurred, providing the user with a clear visual represent
Color Histogram Volume Set
Ricardo Almeida Branco
Do you use volume in your reading of the market? Certainly many traders use it, and do not imagine operating without it. The Color Histogram Volume Set indicator allows the user to choose the value that he considers interesting to monitor. When you pass this you will have visual confirmation and if you want you will also have the audible alert that is given by the indicator. Of course, there are other ways to try to find a high volume, such as assessing whether the volume is above av
Breakout Boxes with Volume Pressure This indicator automates the identification of key consolidation zones (Supply and Demand) based on Market Pivots and Volatility (ATR). Unlike standard support/resistance tools, this indicator provides a unique   Volume Pressure Analysis   inside every box, giving you insight into the battle between Buyers and Sellers before a breakout occurs. Key Features Automated Supply & Demand Zones:   Automatically detects significant Pivot Highs and Lows to draw dyna
White Weis Volume Ticks
Ricardo Almeida Branco
5 (4)
White Weis Volume This indicator shows the sum of the volume in each wave, bulish or bearish, as idealized by David Weis , but it brings an important addition , which is the marking of the bar with the highest volume of the wave (White Bar)! In coding the indicator, it was sought to optimize the code to require minimal processing during use and not to overload mt5. The indicator can be used for pre-trading analysis and study, where the trader analyzes possible points of support and resistance
Value Chart Candlesticks
Flavio Javier Jarabeck
4.57 (14)
The idea of a Value Chart indicator was presented in the very good book I read back in 2020 , " Dynamic Trading Indicators: Winning with Value Charts and Price Action Profile ", from the authors Mark Helweg and David Stendahl. The idea is simple and the result is pure genius: Present candlestick Price analysis in a detrended way! HOW TO READ THIS INDICATOR Look for Overbought and Oversold levels. Of course, you will need to test the settings a lot to find the "correct" one for your approach. It
FREE
Here   our more valuable tools SMC Trend Trading   ,  Easy SMC Trading  ,  Institutional SMC Architect Volume Analysis Tools  ,  Volume flow Profile  ,  Market volume profile  , FVG with Volume  , Liquidity Heatmap Profile  ,  Volume Spread Analysis A professional spike pattern indicator built for synthetic traders who scalp and swing Crash 500/300/1000 with precision.  This indicator: Detects powerful 3-candle spike formations (Spike → Pullback → Spike) Automatically draws a clean box a
FREE
WAPV Weis Wave Chart Forex
Eduardo Da Costa Custodio Santos
The Weis Wave Chart Forex for MT5 is a Price and Volume indicator. The Price and Volume reading was widely disseminated through Richard Demille Wyckoff based on the three laws created by him: Supply and Demand, Cause and Effect and Effort vs. Result. In 1900 R.Wyckoff already used the wave chart in his analyses. Many years later, around 1990, David Weis Automated R. Wyckoff's wave chart and today we bring you the evolution of David Weis' wave chart. It shows the amount of Volume and the amount o
HTF Candles Nika 可将任意更高时间框架的完整K线直接叠加显示在MetaTrader 5的当前图表上,无需切换图表即可获得多时间框架视角。 主要功能 - 在当前图表上以矩形加影线的形式绘制高时间框架K线 - 支持标准K线和平均K线(Heiken Ashi)两种显示模式 - 实时倒计时,显示当前高时间框架K线距关闭的剩余时间 - 多头和空头K线颜色可自定义 - 自动或手动控制K线宽度 - 可配置影线宽度、字体、字号及文字位置偏移 - 适用于任何品种和时间框架组合 - 自动检测交易时段间隙并调整渲染 - 轻量级 — 仅使用图表对象,无指标缓冲区 输入参数 显示设置 - Max Lookback — 绘制的高时间框架K线数量(默认:500) - Timeframe — 要显示的高时间框架(默认:H1) - Bars Mode — K线或平均K线模式 颜色设置 - Up Color — 多头K线颜色(默认:DodgerBlue) - Down Color — 空头K线颜色(默认:Red) - Frame Color — 时间框架标签颜色(默认:Red) - Count
FREE
Weis Waves
Flavio Javier Jarabeck
2.83 (18)
The original author is David Weis, an expert in the Wyckoff Method. The Weis Wave is a modern adaptation of the 1930's Wyckoff Method, another expert in Tape Reading techniques and Chart Analysis. Weis Waves takes market volume and stacks it into waves according to price conditions giving the trader valuable insights about the market conditions. If you want to learn more about this subject you can find tons of videos in YouTube. Just look for "The Wickoff Method", "Weis Wave" and "Volume Spread
FREE
PropGuardian Risk Manager
Cristian Andre Amigo Martinez
PropGuardian Risk Manager is a utility that watches your account in real time and enforces the hard risk rules that disqualify traders from prop-firm challenges and funded accounts. It does not open trades of its own. It sits on one chart and guards the entire account, whatever you or your other Expert Advisors are doing. One bad day, one oversized lot, or one forgotten position is enough to fail an objective. PropGuardian acts the instant a limit is reached: it closes every position, deletes p
Time and Sales Tick
Pablo Filipe Soares De Almeida
Time & Sales Tick Indicator 是一款专为 MetaTrader 5 平台设计的实时报价与成交监控指标。 该工具能够在图表上实时显示每笔交易的价格、成交量与时间信息,帮助交易者观察市场的细微波动与订单流动。 功能说明 在图表中的独立面板上实时展示价格、成交量与成交时间,便于跟踪市场动态。 可根据用户自定义的时间或数量间隔对成交数据进行分组。 系统自动对价格变动进行颜色区分:上涨以绿色显示,下跌以红色显示,使趋势变化一目了然。 面板可自由放置在图表的任意角落,支持调整大小、字体、透明度和刷新速度。 与所有交易品种和时间周期兼容,可在 MetaTrader 5 平台上稳定运行,不影响主图性能。 适用于分析市场活跃度、监控流动性以及辅助短线或高频交易策略。 此指标为交易者提供了更直观的市场视图,使其能够在高波动市场中更好地识别短期机会并改进决策效率。
VP-MTF PRO - Institutional Volume Profile Multi-Timeframe                               OVERVIEW VP-MTF PRO is a professional-grade Volume Profile indicator designed for serious traders who want institutional-level analysis. It combines multi-timeframe volume profiling with automated signal generation, VPOC migration tracking, and HVN/
FREE
Angus Orderflow Heatmap
Mr Monthon Chaipreechapat
Volume Footprint & Heatmap Indicator This indicator combines Volume Footprint and Heatmap visualization, inspired by the Order Flow and Heatmap concepts found in Bookmap. Unlike futures markets, the Forex market does not provide real exchange-traded volume data. Instead, it only offers Tick Volume . This indicator is designed to simulate Bookmap-style market visualization as closely as possible using the available Tick Volume data. Because the indicator relies on Tick Volume, the quality and acc
VisualVol EURUSD
Maxim Kuznetsov
The indicator highlights the points that a professional trader sees in ordinary indicators. VisualVol visually displays different volatility indicators on a single scale and a common align. Highlights the excess of volume indicators in color. At the same time, Tick and Real Volume, Actual range, ATR, candle size and return (open-close difference) can be displayed. Thanks to VisualVol, you will see the market periods and the right time for different trading operations. This version is intended f
FREE
Volume Candle Indicator
Pablo Filipe Soares De Almeida
MetaTrader 5 的彩色成交量直方图指标 此指标在单独的窗口中以直方图的形式显示市场成交量。每根柱子的颜色根据价格蜡烛的方向自动变化:当收盘价高于开盘价时显示绿色,表示多头力量;当收盘价低于开盘价时显示红色,表示空头主导。通过颜色区分,可以让交易者更清楚地看到价格运动与成交量之间的关系。 主要功能 成交量来源:可选择“Tick 成交量”或“真实成交量”。 可选在成交量直方图上添加一条移动平均线,用于平滑成交量变化趋势。 支持的移动平均类型包括:SMA(简单平均)、EMA(指数平均)、SMMA(平滑平均)、LWMA(线性加权平均)。 用户可以自由设定平均周期。 兼容所有交易品种和时间周期,在 MetaTrader 5 平台上运行稳定。 通过颜色与平均线的结合,帮助分析成交量背后的动能变化,从而辅助判断价格反转或趋势延续。
Check EA performance  https://www.mql5.com/en/signals/2376164?source=Site +Profile+Seller Spot vs Future Arbitrage EA for MT5 Spot vs Future Arbitrage EA is an automated Expert Advisor designed for MetaTrader 5 that operates using price differences between Gold spot and Gold futures instruments. The strategy opens positions on both instruments simultaneously to take advantage of temporary differences between spot and futures prices. Requirements The trading account must provide both Gold spot
CVD SmoothFlow Pro
Thalles Nascimento De Carvalho
CVD SmoothFlow Pro - 适用于任何资产的无限量分析! CVD SmoothFlow Pro 是寻求精确和无限量分析的交易者的终极解决方案。该专业版利用累计成交量 delta (CVD) 并结合高级噪声过滤,为交易任何金融资产提供所需的灵活性和精确度。 CVD SmoothFlow Pro 提供了什么? 清晰分析 :过滤市场噪声,突显任何金融资产中的重要成交量变动。 ️ 精确计算 :监测买卖差异,提供外汇、指数、加密货币等资产的成交量行为的详细视图。 直观界面 :提供易于理解和高效的分析,数据呈现清晰明了。 趋势识别 :更自信地识别市场趋势,帮助做出明智决策。 实际应用: 实时监测任何资产中买卖双方的平衡。 基于成交量识别趋势反转。 精确过滤,关注外汇、指数、加密货币等资产中的重要变动。 无限制的专业版! 专业版提供无限制的所有功能访问权限,让您能够对任何金融资产进行详细和无限量的分析。
VWAP Indicator
LUC JACOBUS A VERHEECKE
4.11 (27)
Volume Weighted Average Price (VWAP) The volume weighted average price (VWAP) is a  trading   benchmark  used by traders that gives the average price a security has traded at throughout the day, based on both volume and price. It is important because it provides traders with insight into both the trend and value of a security. This indicator VWAP V2 is free and is the manual version of the extended Easy VWAP indicator (30 Euro), where the date and time properties are automatically entered. With
FREE
Frato Vwap Bands
Francisco Felipe Alves Da Silva Rocha
Frato VWAP 带——带标准差的成交量加权平均价格 Frato VWAP 带指标结合了传统的成交量加权平均价格 (VWAP) 和动态波动率带。它提供成交量加权平均价格的多周期视图。 主要功能: 该指标计算成交量加权平均价格 (VWAP),并根据标准差绘制最多 3 条上下波动率带。每次选择新的周期(小时、4 小时、日线、周线、月线)时,计算都会重置,从而支持日内和长期趋势分析。 标准差带的权重与 VWAP 的权重相同。这使得它们具有动态性,能够灵敏地反映市场活动,有助于识别异常的价格波动和潜在的反转区域。 解读指南:VWAP 线通常用作加权平均价格的参考线。高于 VWAP 线的交易表明买盘压力,而低于 VWAP 线的交易则表明卖盘压力。这些带状区域作为动态参考水平,外侧带状区域指示具有统计显著性的极值。 配置参数: 周期:定义 VWAP 重置频率。 - 1 小时 (H1) – 每 00:00 重置一次。 - 4 小时 (H4) – 每 4 小时重置一次(00:00、04:00、08:00 等)。 - 日线 – 在每个交易日开始时重置。 - 周线 – 在每个交
FREE
GOM Trade Manager
Wannapach Chinnaprapa
GOM Trade Manager helps you execute trades the way you want it. Works on all instruments Forex, Commodities, & Crypto. It helps you with lot calculations, spread addition and balance calculations so you can just focus on actual trading. For full automatic planned management, stackable triggers and spread widening protection >> check out GOM Trade Manager Pro . ------------------------------------------NOTABLE FEATURES------------------------------------------ You set everything based on bid
FREE
XAUUSD OrderFlow Structure AutoPOC Pro is an advanced MetaTrader 5 indicator designed to analyze market structure, order flow, buying and selling pressure, liquidity, and volume distribution directly on the chart. The indicator is especially focused on XAUUSD (Gold) analysis, although it can also be used with other instruments available in MetaTrader 5. Its objective is to bring together several analytical tools that would normally require multiple indicators: market structure, BOS and CHOCH, Or
Waves Sizer
Flavio Javier Jarabeck
3.86 (7)
Wyckoff fans, enjoy! Ideally to be used with the Weis Waves indicator, but it can be easily used alone, the Waves Sizer puts the range (in resulting Price movement) done by the Price on its market swings. You can control how accurate or loose will be the swings. This tool is very helpful for visually know how much the Price has traveled in your Timeframe. This way you can confront this level of effort with the resulting Volume, etc... Weis Waves indicator: https://www.mql5.com/en/market/produc
FREE
Here   our more valuable tools SMC Trend Trading   ,  Easy SMC Trading  ,  Institutional SMC Architect Volume Analysis Tools  ,  Volume flow Profile  ,  Market volume profile  , FVG with Volume  , Liquidity Heatmap Profile  ,  Volume Spread Analysis Transform Your Trading with Intelligent Market Insights! The 2025 Spike Killer Dashboard is a powerful MQL5 indicator that combines cutting-edge signal generation with an intuitive crystal dashboard for real-time market analysis. Designed for tra
Volume Profile Delta
Juan Eduardo Verdala
Volume Profile Delta — Indicator for MetaTrader 5 Volume Profile Delta is an indicator that displays the difference between buying volume and selling volume recorded on each bar, represented as a histogram at the bottom of the chart. What this indicator does On each bar it calculates the difference between the volume associated with upward movements and the volume associated with downward movements. The result is shown as a bar in the lower histogram, making it possible to observe whether buying
FREE
Auto Analysis
Israr Hussain Shah
Here   our more valuable tools SMC Trend Trading   ,  Easy SMC Trading  ,  Institutional SMC Architect Volume Analysis Tools  ,  Volume flow Profile  ,  Market volume profile  , FVG with Volume  , Liquidity Heatmap Profile  ,  Volume Spread Analysis This powerful indicator combines Fibonacci pivot point analysis with automatic trend line detection, providing traders with a complete technical analysis toolkit in a single tool. Key Features : - Fibonacci Pivot Points: Automatically calculat
Smart Trade Manager Pro Live Smart Trade Manager Pro is a manual trade management Expert Advisor for MetaTrader 5. It does not open trades automatically. It is designed for traders who enter positions manually and want structured risk-based exit management after the trade is open. The EA manages manual trades using the initial stop loss as the risk reference. Once a position has a valid stop loss, the EA can calculate R-multiple progress and manage partial closes, break-even, stop-loss locking,
Indicador 3 Vela do movimento
Vagner Ferreira Da Silva
专业多时间周期监控指标 产品描述 Scanner 3 do Movimento 是一款适用于 MetaTrader 5 的专业指标,可同时监控 11 个时间周期,并自动识别特定的三根K线反转形态。 使用该指标后,您无需再手动切换图表。所有信息都会直接显示在 MT5 屏幕上的单一面板中。 工作原理 K线形态 该指标会寻找由连续 3 根K线组成的特定形态。 BUY(买入)信号: K线 颜色 条件 第1根K线(最早) 红色 反转基础 第2根K线(中间) 绿色 最低点低于第1根K线 第3根K线(最新) 绿色 最高点高于第2根K线 SELL(卖出)信号: K线 颜色 条件 第1根K线(最早) 绿色 反转基础 第2根K线(中间) 红色 最高点高于第1根K线 第3根K线(最新) 红色 最低点低于第2根K线 实际运行方式 该指标会同时分析所有时间周期: (M1、M2、M3、M4、M5、M6、M10、M12、M15、M20、M30)。 当任意时间周期形成该形态时: 面板颜色会发生变化 自动触发声音警报 交易者能够立即知道哪个时间周期出现了有效形态 提前预警
该产品的买家也购买
HINN Lazy Trader
ALGOFLOW OÜ
5 (1)
The core idea: using the user interface, you configure the parameters the chart must meet before entering a position (or positions), choose which entry models to use, and set the rules for when trading and planning should end. Lazy Trader  handles the rest: it  takes over all the routine chart watching and execution! full description  :: 3 key videos [1] ->  [2]   ->  [3] What can it do? - Understands Larry Williams market structure - Understands swing market structure by Michael Huddleston
Adam FTMO MT5
Vyacheslav Izvarin
5 (2)
ADAM EA Special Version for FTMO Please use ShowInfo= false for backtesting ! Our 1st EA created using ChatGPT technology Trade only GOOD and checked PROP FIRMS  Default parameters for Challenge $100,000 Tested on EURUSD and GBPUSD only  Use 15MIN Time Frame Close all deals and Auto-trading  before Weekend at 12:00 GMT+3  Friday For Prop Firms MUST use special Protector  https://www.mql5.com/en/market/product/94362 --------------------------------------------------------------------------------
使用 FRATO Smart GEX,将您的交易提升至机构级别。它并非仅仅是基于移动平均线或滞后震荡指标的又一技术指标,而是一款量化智能工具,通过实时 GEX(Gamma 敞口)和未平仓合约 (OI) 分析,解读主要做市商的仓位。 了解大玩家如何推动价格走势,并识别普通 K 线图无法显示的支撑位和阻力位! 主要功能: 实时 GEX 分析:可视化看涨期权墙、看跌期权墙和 Gamma 翻转位,这些水平线如同磁石或障碍,有效吸引或阻碍价格上涨。 专属 0DTE 模块:专注于当日到期期权 (0DTE),完美适用于日内波动性较高的日内交易者。 交易商情绪:了解做市商的多空关系,并预测加速行情(Gamma 挤压)。 高级极简仪表盘:优雅的悬浮式仪表盘,可根据您的屏幕分辨率自动调整,并提供浅色和深色主题。 高级量化指标:可访问最大痛点、净 GEX 和成交量集中度数据。 原生多语言:全面支持英语、俄语、西班牙语和中文。 为什么选择 GEX 进行交易?在现代市场中,期权市场决定着现货市场(股票和指数)的走势。通过监控 Gamma 敞口 (GEX),您无需根据过去的图表模式
Mt5BridgeBinary
Leandro Sanchez Marino
我自动其商业策略的使用二进制 MT5 和我们 Mt5BridgeBinary 我发送的命令其二进制账户和我名单: 开始使用这种方式容易! 专家顾问也容易形成、优化和实现抗寒试验; 还在测试中我们可以预测其长期盈利能力,所以我们创造了 Mt5BridgeBinary 连接其最佳战略二进制文件。 特点: 它可以使用很多战略如我所愿。 (专家顾问)。 他不需要额外的程序。 随函附上我方- EA 没有导入的时限。 它可以想象所有的公开行动。 他只需要执行我们 EA 只在一个图形采取所有的订单。 -它不需要复杂的配置,以使我们的就业工作。 输入参数: 电子邮件: 有关其电子邮件帐户的二进制文件。 -标记: 代码访问它生成的二进制来操作。 -数量操作: 该合同价值。 位置警报: 会启用/禁用警报作业时开放。 -小组菲尔斯滕: 它显示所有打开的行动。 注: -期限的合同: 请参阅《资产指数来了解这笔总额中,最小和最大期限的合同。 - Volatile 性质指标不能在德国、法国、西班牙、新加坡、澳大利亚、意大利和卢森堡。
FiboPlusWaves MT5
Sergey Malysh
5 (1)
FiboPlusWave Series products Ready-made trading system based on Elliott waves and Fibonacci retracement levels . It is simple and affordable. Display of the marking of Elliott waves (main or alternative option) on the chart. Construction of horizontal levels, support and resistance lines, a channel. Superposition of Fibonacci levels on waves 1, 3, 5, A Alert system (on-screen, E-Mail, Push notifications).    Features: without delving into the Elliott wave theory, you can immediately open one of
Xrade EA
Yao Maxime Kayi
Xrade EA is an expert advisor as technical indicator. For short period trade it's the best for next previsions of the trend of the market. +--------------------------------------------------------------------------------------- Very Important Our robot(data anylizer) does'nt take a trade procedure. If using only our robot you must take positions by yoursels +--------------------------------------------------------------------------------------- The technical indiator provide for a given sma
News: IDEA 2.0 is out with lot of features, like telegram bot notifications and Limits order! Check the changelog at bottom of page (*). Hi all, here you can find my Expert Advisor, called IDEA  (Intelligent Detection & managEr Algorithm) . In short, with this software you can: Have   a clear view of market status , with an indication of current trend. Simply add symbols you want to monitor to your market watch, and IDEA will notify you if some of them are in trend; Have an   automatic lots ca
PROMOTION!! $499 until 1 Mar. After that, EA will be $1,050 Developed and tested for over 3 years, this is one of the safest EAs on the planet for trading the New York Open. Trading could never be easier.  Trade On NASDAQ US30 (Dow Jones Industrial Average) S&P 500  What Does The EA do? The EA will open a Buy Stop Order and a Sell Stop Order(With SL and TP) on either side of the market just a few seconds before the NY Open.  As soon as 1 of the 2 trades is triggered, the EA automatically delete
Saving data from the order book. Data replay utility: https://www.mql5.com/en/market/product/71640 Library for use in the strategy tester: https://www.mql5.com/en/market/product/81409 Perhaps, then a library will appear for using the saved data in the strategy tester, depending on the interest in this development. Now there are developments of this kind using shared memory, when only one copy of the data is in RAM. This not only solves the memory issue, but gives faster initialization on each
All in one Keylevel
Trinh Minh Tung
5 (1)
Instead of sticking to the Charts,let's use ALL IN ONE KEYLEVEL Announcement: We are pleased to announce the latest version 14.02 of the One In One Keylevel product. This is a reliable product that has been upgraded with many new features and improvements to make your work easier and more efficient. Currently, we have a special promotion for this new version. The current discounted price is $500, and there are only 32 units left. After that, the price will increase to $1000, and will continue to
The EA Protection Filter ( MT4 version here ) provides a news filter as well as a stock market crash filter, which can be used in combination with other EAs. Therefore, it serves as an additional protective layer for other EAs that do provide such filters.  During backtest analysis of my own night scalpers, which already use a stock market crash filter, I noticed that the historic drawdown,  especially during stock market crash phases like 2007-2008, was reduced significantly by using such a fil
Hedge Ninja
Robert Mathias Bernt Larsson
3 (2)
請務必在 www.Robertsfx.com 加入我們的 Discord 社區,您也可以在 robertsfx.com 購買 EA 無論價格向哪個方向移動,都能贏得勝利 無論價格向哪個方向移動,該機器人都會根據價格的移動方向改變方向,從而獲勝。這是迄今為止最自由的交易方式。 因此,無論它向哪個方向移動,您都會贏(當價格移動到屏幕截圖中的任何一條紅線時,它會以您設置的利潤目標獲勝)。 您面臨的唯一風險是價格是否正在整合(停留在一個地方)。 對沖忍者是一種半自動交易工具,您可以使用下面的對沖設置進行設置。當您告訴它進行交易時,購買或出售它,然後為您處理一切。 每次機器人改變方向時,它都會彌補你之前的損失,所以當你到達任何一條紅線時,你的利潤將是你決定的。 一個好的經驗法則是使用相當高的風險來獲得回報,但是你在這個鏈接上知道如何交易這個機器人的交易秘密。你想要的是價格移動,一旦它開始移動,你就直接走向你的利潤資金:) 設置 ADR / 平均點差 ADR 是平均每日範圍,顯示該工具在一天內通常平均移動多少點。很高興知道這一點,因為您不希望該機器人在點差變得更高的市場展期中運行
Best for Technical Analysis You can set from one key shortcut for graphical tool or chart control for technical analysis. Graphic design software / CAD-like smooth drawing experience. Best for price action traders. Sync Drawing Objects You don’t need to repeat drawing the same trend line on the other charts. Shortcuts do that for you automatically. Of course, any additional modifications of the object immediately apply to the other charts too. Colors depend on Timeframe Organize drawings with
Gold instrument scanner is the chart pattern scanner to detect the triangle pattern, falling wedge pattern, rising wedge pattern, channel pattern and so on. Gold instrument scanner uses highly sophisticated pattern detection algorithm. However, we have designed it in the easy to use and intuitive manner. Advanced Price Pattern Scanner will show all the patterns in your chart in the most efficient format for your trading. You do not have to do tedious manual pattern detection any more. Plus you
Gold Wire Trader MT5 trades using the RSI Indicator. It offers many customizable RSI trading scenarios and flexible position management settings, plus many useful features like customizable trading sessions, a martingale and inverse martingale mode. The EA implements the following entry strategies, that can be enabled or disabled at will: Trade when the RSI Indicator is oversold or overbought Trade when the RSI comes back from an oversold or overbought condition Four different trading behavio
Gold trend scanner MT5 a multi symbol multi timeframe dashboard that monitors and analyzes Average True Range indicator value in up to 28 symbols and 9 timeframes  in 3 modes :  It shows the ATR indicator value in all pairs and timeframes and signals when the ATR value reaches a maximum or minimum in a given duration. Short term ATR/Long term ATR ratio: It shows ratio of 2 ATRs with different periods. It's useful in detecting short term volatility and explosive moves. ATR Value/Spread ratio: S
Attention: this is a multicurrency EA, which trades by several pairs from one chart!  Therefore, in order to avoid duplicate trades, it is necessary to attach EA only to one chart, ---> all trading in all pairs is conducted only from one chart! we can trade simultaneously in three different pairs, as by default (EURUSD + GBPUSD + AUDUSD), which take into account the correlation when entering the market for all three; we can trade only EURUSD (or any currency pair) and at the same time take into
A triangular arbitrage strategy exploits inefficiencies between three related currency pairs, placing offsetting transactions which cancel each other for a net profit when the inefficiency is resolved. A deal involves three trades, exchanging the initial currency for a second, the second currency for a third, and the third currency for the initial. With the third trade, the arbitrageur locks in a zero-risk profit from the discrepancy that exists when the market cross exchange rate is not aligned
Gold index expert MT5 Wizard uses Multi-timeframe analysis. In simpler terms, the indicator monitors 2 timeframes. A higher timeframe and a lower timeframe. The indicator determines the trend by analyzing order flow and structure on the higher timeframe(4 hour for instance). Once the trend and order flow have been determined the indicator then uses previous market structure and price action to accurately determine high probability reversal zones. Once the high probability reversal zone has bee
Golden Route home MT5 calculates the average prices of BUY (LONG) and SELL (SHORT) open positions, taking into account the size of open positions, commissions and swaps. The indicator builds the average line of LONG open positions, after crossing which, from the bottom up, the total profit for all LONG positions for the current instrument becomes greater than 0. The indicator builds the average line of SHORT open positions, after crossing which, from top to bottom, the total profit for all SH
Do you want an EA with small stoploss? Do you want an EA that is just in and out of market? Gold looks at several MT5 It is ONLY buying when the market opens and with a window of 10 minutes or less. It uses pre-market price so be sure your broker has that.   This strategies (yes, it is 2 different strategies that can be used with 3 different charts) have tight stoplosses and a takeprofit that often will be reached within seconds! The strategies are well proven. I have used them manually for
Bionic Forex
Pablo Maruk Jaguanharo Carvalho Pinheiro
Bionic Forex - Humans and Robots for profit. Patience is the key. The strategies are based on: - Tendency - Momentum + High Volatility - Dawn Scalper + Support Resistence. Again, patience is the key. No bot is flawless, sometimes it will work seamlessly, sometimes it simply won't.  it's up to you manage its risk and make it a great friend to trade automatically with fantastic strategies. Best regards, Good luck., Pablo Maruk.
ABOUT THE PRODUCT Your all-in-one licensing software is now available. End users are typically granted the right to make one or more copies of software without infringing on third-party rights. The license also specifies the obligations of the parties to the license agreement and may impose limitations on how the software can be used. AIM OF THE SOFTWARE The purpose of this system is to provide you with a one-of-a-kind piece of software that will help you license and securely track your MT4/MT5
The purpose of this service is to warn you when the percentage of the margin level exceeds either a threshold up or down. Notification is done by email and/or message on mobile in the metatrader app. The frequency of notifications is either at regular time intervals or by step of variation of the margin. The parameters are: - Smartphone (true or false): if true, enables mobile notifications. The default value is false. The terminal options must be configured accordingly. - email (true or false)
基于Goodtrade/GoodX 券商推出的黄金双仓对冲套利的交易模型/策略/系统,在日常的操作遇到的问题: 1、B账户跟随A账户即刻下单。 2:A账户 下单后  B账户 自动抄写止损止盈。 3:A账户平仓B账户同时平仓。 4:B账户平仓A账户也平仓。 5:不利点差下拒绝下单。 6:增加有利点值因子。 通过解决以上问题,改变了熬夜、手工出错、长期盯盘、紧张、恐慌、担心、睡眠不足、饮食不规律、精力不足等问题 目前解决这些问题后,有效提升了工作效率和盈利比例,由原来月10%盈利率提升到月45%的最佳盈利率。 原来的一名交易员只能管理操作两组账户,通过此EA提高到操作管理高达16组交易账户,或许你可以超越我们的记录,期待你的经验交流。 此EA分为: GoodtradeGoodX Tradercropy A       GoodtradeGoodX Tradercropy B     是一个组合EA,假设您购买的额  GoodtradeGoodX Tradercropy   A  必须同时购买 GoodtradeGoodX Tradercropy   B  两个组合使用会到最佳效果。   
BOTON para trading manual
Cesar Juan Flores Navarro
El EA Boton pone botones de Buy y Sell en la pantalla Ideal para usuarios que habren muchas ordenes y diferentes pares 9 botones buy desde 0.01 al 0.09 y 9 botones sell de 0.01 al 0.09 9 botones buy desde 0.1 al 0.9 y 9 botones sell de 0.1 al 0.9 Boton Close buy y sell Boton Close buy positivos y Boton Sell positivos Boton Close buy negativos y Boton Sell negativos un boton close all y botones buy de 1, 5 y 10 y botones de sell 1,5, 10
Отличный помощник для тех кто грамотно распоряжается своими рисками. Данный помощник просто не заменим если у вас всегда должен быть фиксированный риск на сделку. Помогает автоматически высчитывать лот в зависимости от вашего риска. Теперь можно не беспокоиться о том каким будет ваш Stoploss, риск всегда будет одинаковый. Считает объем сделок как для рыночных ордеров так и для отложенных. Удобный и интуитивно понятный интерфейс, так же есть некоторые дополнительные функции для упрощения вашей то
FTMO Sniper 7
Vyacheslav Izvarin
Dedicated for FTMO and other Prop Firms Challenges 2020-2024 Trade only GOOD and checked PROP FIRMS  Default parameters for Challenge $100,000 Best results on GOLD and US100  Use any Time Frame Close all deals and Auto-trading  before  US HIGH NEWS, reopen 2 minutes after Close all deals and Auto-trading  before Weekend at 12:00 GMT+3  Friday Recommended time to trade 09:00-21:00 GMT+3 For Prop Firms MUST use special  Protector  https://www.mql5.com/en/market/product/94362 --------------------
Chart Walker Analysis Engine
Dushshantha Rajkumar Jayaraman
Chart Walker Analysis Engine | Machine-led instincts Recommended Time Frames M30, H1 TRADING INTEGRITY: CHART WALKER NEVER REPAINTS ITS SIGNALS. What you see is EXACTLY what you get. Unlike standard indicators that alter past data to look profitable, the Chart Walker Analysis Engine locks its signals into market history the exact millisecond a candle closes.  ONCE PRINTED, IT STAYS FOREVER.  No vanishing Signals. No shifted entries. No historical manipulation. Every buy and sell alert remains
The Wall Street Player (Master version). This EA tailored as a Discipline, Money and Risk Management tool is a powerful Trade Station utility designed for Forex, Cryptos, Commodities, Shares, Deriv synthetic pairs and any CFDs Market. It is designed to fit your strategy as a winner, and take your Edge of the market to the NEXT-LEVEL. The only thing to do is to get It on your chart and appreciate the possibilities and chart management abilities it has to offer for realizing that discipline and a
筛选:
无评论
回复评论