XAMD and MDX Indicator ICT for MT5
- Göstergeler
- Mehnoosh Karimi
- Sürüm: 3.1
- Etkinleştirmeler: 10
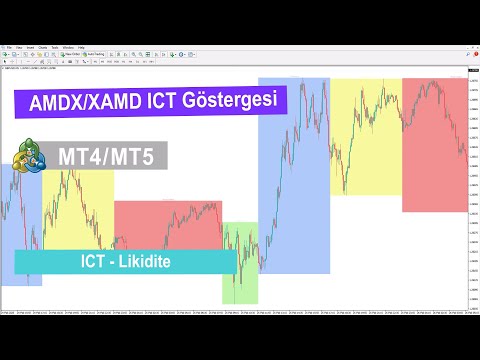
XAMD/AMDX Indicator ICT MT5
The XAMD/AMDX Indicator, built on the ICT trading framework, helps traders identify potential market trend shifts. This liquidity-based MetaTrader 5 tool organizes price action into three primary stages: Accumulation, Manipulation, and Distribution, each visually represented with distinct color-coded boxes.
A unique fourth stage, Continuation or Reversal (X), sets the XAMD/AMDX Cycle Indicator apart from the standard AMD ICT Indicator on MT5, offering traders an additional layer of market insight.
Indicator Specifications
| Category | ICT - Smart Money - Liquidity |
| Platform | MetaTrader 5 |
| Skill Level | Advanced |
| Indicator Type | Continuation - Reversal |
| Timeframe | Multi-Timeframe |
| Trading Style | Scalping - Intraday |
| Market | Crypto - Forex - Stocks - Commodities |
Indicator Overview
The XAMD/AMDX Cycle Indicator highlights the Continuation or Reversal (X) phase with a yellow box. This phase may appear at the start or end of a market cycle and can signal either a trend continuation or an upcoming reversal.
The interpretation of this zone depends on current market conditions, making it a vital element in ICT-based trading strategies.
Uptrend Example
On a 5-minute GBP/USD chart, the Accumulation and Manipulation stages generally push prices lower. The Distribution phase then drives prices upward, with the X phase continuing this momentum. This illustrates how the X phase reinforces the AMDX structure during an uptrend.
Downtrend Example
On a 15-minute XAG/USD chart, prices rise during the Manipulation (green box) and Distribution (blue box) phases. In this example, the X phase acts as a strong reversal signal, highlighting its importance in spotting key turning points during a downtrend.
XAMD/AMDX Indicator Settings
The indicator settings are divided into two main sections:
- Session Type – Choose between "XAMD" and "AMDX"
- Days to Start Looking Back – Specify the number of days for historical data calculation
Conclusion
The XAMD/AMDX Cycle Indicator is an advanced ICT-based tool for MetaTrader 5 that provides a structured approach to market analysis. By segmenting price action into clear, color-coded zones, it enhances traders’ ability to anticipate market movements.
This indicator includes three core phases:
- Accumulation (Red Zone)
- Manipulation (Green Zone)
- Distribution (Blue Zone)
Additionally, unlike the standard AMD ICT Indicator, it introduces a fourth phase: Continuation or Reversal (X), giving traders deeper insights into potential trend shifts.