 MetaTrader 5
 Uzmanlar
 Göstergeler
 Kütüphaneler
 Yardımcı programlar
 Widgetlar
 Kurallar
YouTube'dan Mağaza ile ilgili öğretici videoları izleyin
Bir alım-satım robotu veya gösterge nasıl satın alınır?
Uzman Danışmanınızı
sanal sunucuda çalıştırın
sanal sunucuda çalıştırın
Satın almadan önce göstergeyi/alım-satım robotunu test edin
Mağazada kazanç sağlamak ister misiniz?
Satış için bir ürün nasıl sunulur?
MetaTrader 5 için Uzman Danışmanlar ve Göstergeler - 381
 Forex alım-satımını daha karlı hale getirmek için alım-satım robotları ve göstergeler kullanın. Alım-satım robotları, işlem açma ve kapatma sürecini otomatikleştirmenize olanak tanırken, göstergeler piyasa davranışını daha doğru bir şekilde tahmin etmenize yardımcı olur.
Bu sayfa, MetaTrader 5 uygulamalarının kataloğunu içermektedir.
Forex alım-satımını daha karlı hale getirmek için alım-satım robotları ve göstergeler kullanın. Alım-satım robotları, işlem açma ve kapatma sürecini otomatikleştirmenize olanak tanırken, göstergeler piyasa davranışını daha doğru bir şekilde tahmin etmenize yardımcı olur.
Bu sayfa, MetaTrader 5 uygulamalarının kataloğunu içermektedir. 
Improved version of the free HMA Trend indicator (for MetaTrader 4) with statistical analysis. HMA Trend is a trend indicator based on the Hull Moving Average (HMA) with two periods. HMA with a slow period identifies the trend, while HMA with a fast period determines the short-term movements and signals in the trend direction.
The main differences from the free version: Ability to predict the probability of a trend reversal using analysis of history data. Plotting statistical charts for analyzi
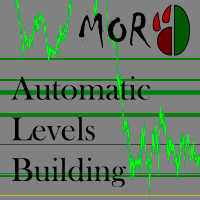
This indicator is designed to automatically build support/resistance levels. The indicator calculates the density of the price distribution in the specified time range and creates a table of volumes for each price. Levels are constructed from the minimum to the maximum volumes specified by the user. Some input parameters can be changed using hot keys without opening the settings window.
Inputs StartPoint - start bar number Range - length of the level in bars (time range) VolumeMin - minimum vol

The on-balance volume indicator (OBV) is a momentum indicator and was developed in 1963 by Joseph E. Granville. The OBV shows the importance of a volume and its relationship with the price. It compares the positive and negative volume flows against its price over a time period. To provide further confirmation that a trend may be weakening, Granville recommended using a 20-period moving average in conjunction with the OBV. As a result, OBV users could then observe such events more easily by notin

Göreceli Güç Endeksi (RSI) göstergesinin çoklu para birimi ve çoklu zaman çerçeveli modifikasyonu. Parametrelerde istediğiniz para birimini ve zaman dilimlerini belirtebilirsiniz. Ayrıca panel aşırı alım ve aşırı satım seviyelerini geçerken bildirim gönderebilir. Noktalı bir hücreye tıkladığınızda bu sembol ve nokta açılacaktır. Bu MTF Tarayıcıdır.
Kontrol panelini grafikten gizlemenin anahtarı varsayılan olarak "D"dir
Para Birimi Gücü Ölçer'e benzer şekilde, Kontrol Paneli belirli bir para b

The Bollinger R (Bollinger Reversals) is designed to recognize short term high profitable counter trend patterns from the chart. This system combines both Bollinger Bands and mean reversion to define positions where the market could potentially reverse direction. This is the MT5 version of Bollinger R Description Bollinger Bands are well known in the trading community. I have added the concepts mean reversion and "distance between Price and a Moving Average" to help confirm and trade the “bounce

This tool allows you to better analyze your chart. With "Crosshair Percent", you can calculate distances in the chart in a percentage way (in a very simple way, when the pointer is attached in the form of a crosshair: CRTL + F). The utility allows to measure and/or calculate the movements of the price NOT only in points, use a measure in professional terms as it is the percentage. The result is shown in two parts of the screen, one of them, next to the position of the pointer and the other in a
In today’s market, an objective counter trend technique might be a trader’s most valuable asset. Most of the traders in the financial market must be familiar with the name "TD Sequential" and "Range Exhaustion". The Sequential R is a Counter-Trend Trading with Simple Range Exhaustion System. Sequential R is useful to identify trend exhaustion points and keep you one step ahead of the trend-following crowd. The "Sequential R" is designed to recognize profitable counter trend patterns from your ch

This long-term trading system works on 9 pairs and timeframe. The Expert Advisor uses various trading systems, such as trend trading, counter-trend trading and others. The EA has the built-in smart adaptive profit taking filter. The robot has been optimized for each currency and timeframe simultaneously. EA uses economic news. No martingale, grid and other risky strategies. EA uses timeframes:
MetaTrader 4 MetaTrader 5 M5, M15, M30, H1 M2, M3, M4, M5, M6, M10, M12 , M15, M20, M3

The BuySellArrows is an indicator without any input parameters. This makes it an easy-to-use trend trading indicator for beginners, advanced and professional traders. The main purpose of this indicator is to detect and mark (with arrows) a local trend, which is one of the most important problem for a trader regardless of their trading style. The main coding algorithm inside the indicator is calculating the speed and direction of the price change. This indicator will show Buy (color Aqua) or Sell
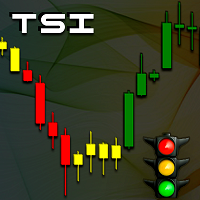
TSI - Trend Semaphore Indicator
Work tool developed to display the force of movement. This tool was developed for Trend Following strategies. Recommended for all types of traders. Can be used in any instrument and market. Can be used in any period of time. Trend indication using multicolored candles.
New trend A new trend is signaled by the changing colors on the chart's candles. The indicator indicates the upward trend with the green color, the downward trend by the red color and weak movement
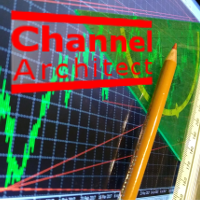
This indicator calculates and draws lines over the chart. There are two types of channels: Channel A: the mainline is drawn using local lows for uptrends and local highs for downtrends Channel B: the mainline is drawn using local highs for uptrends and local lows for downtrends The parallel lines of both types are built using the max. fractal between the base points of the mainline. There are a few conditions, which have to be fullfilled and can be changed by the parameters (see also picture 4):
Displays multiple indicators, across multiple timeframes and symbols to give a comprehensive overview of the market. Uniquely, the indicators are configurable and can include custom indicators, even those where you just have the ex4 file or those purchased from Market. Standard indicators can also be selected, the default being ADX, CCI, market price above/below Moving Average (MA), Moving Average Cross (MAX), MACD, Momentum (MOM), OsMA, RSI, Parabolic SAR, William's Percentage Range (WPR). Use
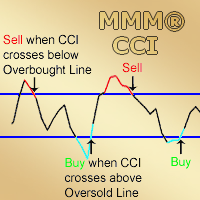
MMM Commodity Channel Index Strategy: The robot uses its two built-in improved and tested CCI indicators to determine the prices trends and calculates the signal for buying or selling. It sends an order, closes or moves the Trailing Stop loss position as the indicator works. Perfect for scalping. It will not send an order unless the calculations determine a good trend of profit. Like all MMM products, it is also programmed to minimize your losses and protect your money from the hostile market. W
When using CCI (Commodity Channel Index) oscillator, the waiting time till the next signal can be long enough depending on a timeframe. CCI Alerts indicator prevents you from missing the indicator signals. It is a good alternative for the standard CCI indicator. Once there appears a CCI signal on the required level, the indicator will notify you with a sound or push, so you will never miss an entry. This is especially significant if you follow the indicator in different timeframes and currency p

Operation principles For the Expert Advisor operation, it is necessary to configure three parameters in accordance with recommendations. The EA works on any timeframe and symbol. The EA analyzes the movement of price beyond a set formed price range, the movement speed and the trend. A position is opened when necessary conditions occur.
Parameters Сurrency pair . Recommended values for symbols: five-digit EURUSD in the format 1.00001 – 1, four-digit EURUSD in the format 1.0001 – 2; five-digit GB

The Expert Advisor has been created for trading on accounts with the deposit of more than $1,000. Uses M1 timeframe. Simultaneously on the recommended pairs: EURUSD, USDJPY, GBPUSD, USDCHF, AUDUSD, USDCAD, NZDUSD, EURAUD, CHFJPY, EURGBP, EURJPY, GBPJPY. Check if your broker supports hedging, since the EA uses hedging based on MACD and RSI. The Expert Advisor enters a position based on MACD and RSI signals. If the price goes in the opposite direction, the EA will open a hedging order and will clo
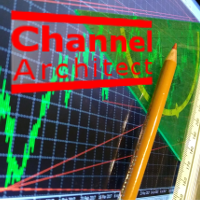
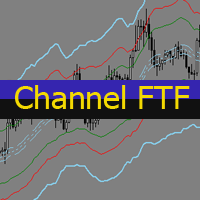
This utility calculates and draws lines over the chart. There are two types of channels: Channel A: the mainline is drawn using local lows for uptrends and local highs for downtrends Channel B: the mainline is drawn using local highs for uptrends and local lows for downtrends The parallel lines of both types are built using the max. fractal between the base points of the mainline. There are a few conditions, which have to be fullfilled and can be changed by the parameters (see also picture 3):
t

The indicator shows the trend of 3 timeframes: higher timeframe; medium timeframe; smaller (current) timeframe, where the indicator is running. The indicator should be launched on a chart with a timeframe smaller than the higher and medium ones. The idea is to use the trend strength when opening positions. Combination of 3 timeframes (smaller, medium, higher) allows the trend to be followed at all levels of the instrument. The higher timeframes are used for calculations. Therefore, sudden change
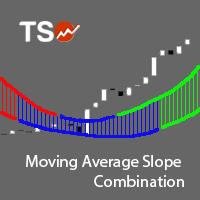
The Moving Average Slope (MAS) is calculated by detecting the moving average level n-periods ago and comparing it with the current moving average level. This way, the trend of the moving average can be drawn on the moving average line. This indicator allows to compare the slopes of two moving averages (fast and slow) to cancel out noise and provide better quality entry and exit signals SCANNER is included . Now with Scanner you can find trading opportunities and setups easily and faster.
Featur

The indicator measures the frequency of incoming ticks to analyze the market activity. Bullish and bearish ticks are analyzed separately, informing about the currently predominant market sentiment. According to observations, an increase in the frequency of ticks (panic) indicates the beginning of strong price changes, and an increase in the frequency of ticks in a particular direction not only accompanies a price change in this direction, but also often anticipates it. The indicator is indispens

This indicator is a multitimeframe trading strategy. It has the levels for stop loss, take profit and entry point. The order level can also be set manually. The indicator uses the regularity of the market, which manifests itself on all instruments, and does not require adjustment of the parameters. The strategy uses a proprietary approach to determining: trend, volatility, hierarchy of timeframe significance, the size of the history period (the number of candles), which is important for making a
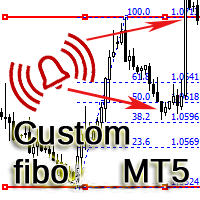
The indicator is designed for building horizontal channels and signal zones, detecting breakouts of extremes, bounces and targets based on custom Fibonacci levels (with or without sound alerts). It automatically applies your chosen Fibonacci levels to those extremes. When price breaks the Fibonacci levels enabled in the settings, the indicator can play a sound, show a message, send a push notification to your mobile terminal or an email (if enabled). Features:
automatic channel building by time
This script will show you information about the execution speed of market orders. Instruction 1. Press " File/Open Data Folder " 2. Copy the log-files from ../Logs to ../MQL5/Files 3. Run the CheckExec script on EURUSD chart, for example 4. Select parameters: AllOrders - check execution time of all market orders for EURUSD, OpenOrders - check execution time of market orders which where used to open positions on EURUSD, CloseOrders - check execution time of market orders which where used to
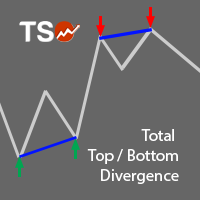
A must-have tool for any strategy based on divergence detection. 10 different oscillators can be used to detect divergences and can be combined with Double Top/Bottom patterns to confirm reversal signals. SCANNER is included . Now with Scanner you can find trading opportunities and setups easily and faster.
Features Easily detect strong reversal signals. 10 different oscillators are available for divergence detection. Divergence & Top/Bottom detection can operate independently or combined. Get
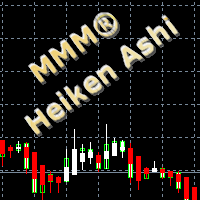
MMM Heiken Ashi strategy: The robot uses its built-in Heiken Ashi improved and tested indicator all the time and does a calculation to determine the prices trends. It sends an order, closes or moves the Trailing Stop loss position as the indicator works. Perfect for Scalping; It will not send an order unless the calculations determine a good trend of profit; Like all MMM products, it is also programmed to minimize your losses and protect your money from the hostile market. We have protections li

The advisor is designed for autonomous automatic round-the-clock trading on the EUR/USD pair, timeframe M15. There is a protection of the deposit from significant drawdown and a mode for saving a profitable transaction. Trades one deal. With the set parameters, it turns out to be one per day on average. How it works Uses the author's algorithm for analyzing three indicators and the direction of market movement to make a decision to open a deal. RSI Stochastic Bands market direction Opens an orde

A comprehensive tool for determining the levels of support, resistance, reversals in relation to trading sessions. The indicator's thesis can be expressed as follows: "Support and resistance levels are undoubtedly formed by the psychological barriers of market participants, and influence the further behavior of the price. But these barriers are different for different groups of traders ( One man's meat is another man's poison ) and can be grouped by territory or by the trading time ". Follo

Ilanis is an Expert Advisor for stock trading, it can be used for trading on Forex and other markets, including commodities, metals and index markets. To determine the market entry, the EA uses the modern and ultra-light adaptive indicator FourAverage. Principle of position maintaining is similar to that of the popular Forex robot Ilan, using averaging. But unlike Ilan, Ilanis uses an accurate entry into the market. The robot pays a lot of attention to position control, if the price goes in the

For any trader, the result of market analysis is the correct identification of the market entry and exit points. The more correctly they are selected, the more profitable the trading. The SmartArrows indicator does not display any excessive information that may distract or confuse the trader, but only the mot important things. The indicator is very simple to use. When a down arrow appears, open a SELL trade, with an up arrow open BUY. Despite its seeming simplicity, the SmartArrows indicator con

FFF Forts is a fully automated trading robot designed to trade on futures on the Russian derivatives market FORTS (RTS, Sberbank, Gazprom, the Ruble, etc.). The robot trades only with the trend. Trade entry occurs on roll-backs. The size of the roll-back is determined manually (in points) or automatically based on the volatility of the instrument.
Settings Type of trade - trade direction Topping up on a trend - enable/disable adding a trend Use Times Filters - enable/disable time limit for trad
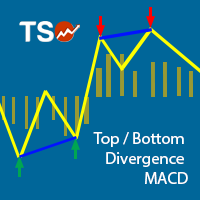
This indicator combines double bottom and double top reversal chart patterns together with detection of divergences between the price chart and the MACD oscillator.
Features Easily detect strong reversal signals Allows to use double top/bottom and MACD divergence signals combined or independently Get email and/or push notification alerts when a signal is detected Custom colors can be used The indicator is not repainting Can easily be used in an EA (see below)
Inputs ENABLE Double Top - Bottom:
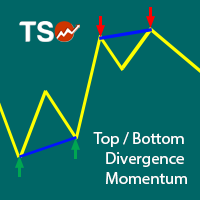
This indicator combines double bottom and double top reversal chart patterns together with detection of divergences between the price chart and the Momentum oscillator.
Features Easily detect strong reversal signals Allows to use double top/bottom and Momentum divergence signals combined or independently Get email and/or push notification alerts when a signal is detected Custom colors can be used The indicator is not repainting Can easily be used in an EA (see below)
Inputs ENABLE Double Top -
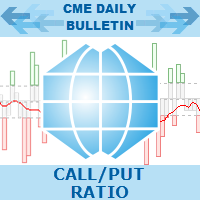
Call/Put Ratio is one of the most well-known indicators of the market sentiment. The indicator has been developed by Martin Zweig. It is based on real volumes of the CBOE option market. As we know, a Call option gives its owner the right to buy the underlying asset at a predetermined price. A Put option gives the right to sell it. Thus, increasing volumes for Call options indicate the increasing demand. The growth of Put option volumes shows that supply starts exceeding demand. If we divide the

If you are using horizontal levels, trend lines or equidistant channels, then this indicator will help you. You do not have to watch charts all the time. Just draw channels and lines and when the price will come close to it, the alert will notify you. You can use as many horizontal levels, trend lines, equidistant channels as you need. There is an option to alert only certain levels on the chart. The indicator is really easy to use. It has a switch button to turn it on and off any time. For bett
TSO Signal Builder MT5 is a MetaTrader 5 Expert Advisor that provides a solid platform to quickly build test and develop automated trading strategies based on indicator signals. Contains 29 indicators, including trend and volume indicators, oscillators as well as many indicators described by Bill Williams. Basic as well as advanced order management features. All indicators are configurable and can be combined to create strategies with different entry and exit signals as well as reverse orders.
Purpose DG Trend+Signs is an indicator that paints candles with trend colors and clearly shows consolidations, using both DoGMA Trend and DoGMA Channel indicators. It was created to help users in their trades, showing trends, consolidations and marking entry and exit points. The indicator also takes consolidations in consideration to identify breakouts.
Key features Designed to be simple to use, with a few parameters Does NOT repaint Does NOT recalculate Signals on entries Works in ALL pairs Wo

Alpha Trend MT5 is a trend indicator for the MetaTrader 5 platform; it has been developed by a group of professional traders. The Alpha Trend MT5 indicator finds the most probable tendency reversal points, which allows making trades at the very beginning of a trend. This indicator features notifications, which are generated whenever a new signal appears (alert, email, push-notification). This allows you to open a position in a timely manner. Alpha Trend does not redraw, which makes it possible t
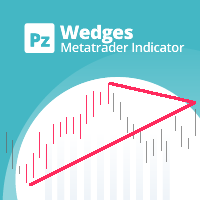
Boost your trading precision with the versatile wedges tool
The PZ Wedges Indicator is a technical analysis tool that helps traders identify potential continuation patterns in the market. These patterns, known as wedges, are formed when the price of an asset consolidates within a narrowing range, bounded by upward or downward converging trendlines. Wedges are considered to be continuation patterns because they often precede a breakout in the direction of the preceding trend. When a wedge pattern

This indicator sends a message (notification), an email, and plays a custom sound when a Limit (Buy/Sell) or Limit Stop (Buy/Sell) or Take Profit, Stop Loss, Stop Out is executed. A user can change the sound file name, and select if they receive notifications/emails. It runs as an indicator, and only one indicator is locked (used) by a user account/login.
Parameters soundFile - sound file
Save your file at the terminal folder, for example: " C:\Program Files\MetaTrader 5\Sounds\Order Executed.

Bu gösterge, basit bir doğrusal yumuşatma işlemi uygular.
Üstel yumuşatmanın dezavantajlarından biri, sinyalin hızlı bozulmasıdır. Bu, fiyat aralığındaki uzun vadeli eğilimleri tam olarak takip etmeyi imkansız hale getirir. Doğrusal yumuşatma, sinyal filtrelemeyi daha doğru ve ince bir şekilde ayarlamanıza olanak tanır.
Gösterge, parametreler seçilerek yapılandırılır:
LP - bu parametre, yumuşatma süresini seçmenize olanak tanır. Değeri ne kadar büyük olursa, gösterge o kadar uzun vadeli eğil

A ticker that shows the average bitcoin price of the selected currency and keeps updating it at regular intervals. PRO version updates more often and displays details about the price change! Make sure you have added the API address http://metakod.com/mk/api in the list of allowed URLs on tab Tools → Options → Expert Advisors. All of the supported currencies and the API address are listed in the screenshots below.
Inputs Logging level - Controls the amount of details written to the log (default:

Think of the rarest pair you can think of. And I assure you that this indicator can compute it is strength. This Currency Meter will literally calculate any currency pairs, either it is a major pair, metal, CFD, commodity, cryptocurrency like Bitcoin/BTC or Ethereum/ETH and even stocks. Just name it and you will get it! There is no currency pair this Currency Meter cannot solve. No matter how rare or exotic is that currency, it will always be solved by this Currency meter on a real-time basis. S

Exclusive Bollinger is a professional indicator based on the popular Bollinger Bands indicator and provided with an advanced algorithm. Unlike the standard Bollinger , my Exclusive Bollinger provides better signals and is equipped with flexible settings allowing traders to adjust this indicator to their trading style. In the indicator, you can set up alerts (alert, email, push), so that you won't miss a single trading signal. Exclusive Bollinger for the MetaTrader 4 terminal : https://www.mql5.
The EA identifies divergences in two correlated currency pairs and trades in the direction where they converge back. Working timeframe: M30
Input parameters MagicNumber - identification number for the EA. OrdersComment - comment to order, automatic if an empty value is set. Lots - lot size. DepoPer001Lot - automatic lot calculation (specify the balance per 0.01 lot) (if 0, the value from 'Lots' parameter is used). TimeFrame - working timeframe. Symbol #2 - correlated currency. Symbol #2 reverse

The indicator displays useful trading information on the chart for futures contracts such as: Average daily volatility with adjustable period of time. Optimal volume to trade depending on percentage of account balance you use. The percentage can be adjusted. Optimal stop loss depending on your maximum risk per trade considering percentage of account balance you use. Initial margin for the contract. Tick value for the contract. The indicator has an ability to display dynamic daily volatility leve
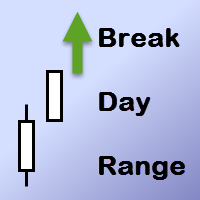
A signal indicator. It implements the tactics described in Larry Williams' book "Long-Term Secrets to Short-Term Trading", Chapter 4, "Volatility Breakouts - The Momentum Breakthrough". The indicator displays entry points on the chart using arrows. Input parameters are not used.
Example of use in a working trading system It is used on a live account as part of the portfolio of strategies on the GMKN futures. Signal monitoring: https://www.mql5.com/en/signals/204344 . Screenshots were created ba

The indicator shows and highlights the chart candles, which are formed as a result of large players entering the market in large volumes. Such candles can also be formed after achieving a certainty on the market, when most of the participants hold positions in the same direction. The movement is likely to continue in that direction after such candles. The indicator highlights the significant candles from the existing ones on the chart; The indicator allows identifying the trends based on candles

Instrument: works with forex currency pairs, futures and stocks. Type: Scalper, Short Trade, Swing Trade, Day Trade, Buy and Hold.
Description Gekko Jade series are EAs designed to be versatile providing more than 50 input parameters to be combined in different ways; Allows Day and Position Trading; Allows control of trading time windows; Allows different types parameters and strategies for entering and exiting the market; Suitable for beginners and experts; Adapts to any timeframe; Allows conf
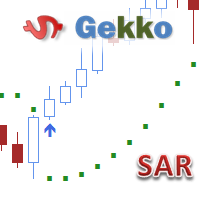
Type: Trend This is Gekko's Customized Parabolic SAR, a customized version of the famous Parabolic SAR indicator. Use the regular SAR and take advantage of different ways of being alerted whenever there is potential entry or exit point.
Inputs Step: Acceleration Factor (AF), default is 0.02. It means it increases by 0.02 each time the extreme point makes a new high or low. AF can reach a maximum of "x" based on the second parameter below, no matter how long the trend extends; Maximum: Extreme P
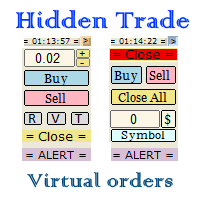
Small trading panel for managing orders and positions in 1 click for MetaTrader 5 The version for MetaTrader 4 is here , you can check it in the tester without restrictions Set hidden TakeProfit, StopLoss and pending orders at lines placed on the chart. Virtual breakeven. Virtual trailing stop. Close all positions. Close only Buy positions. Close only Sell positions. Work in the back testing mode (working in the tester is limited). Place up to 20 virtual orders. News trading and operation by tim

This is Gekko's Cutomized Cutomized Average Directional Index (ADX), a customized version of the famous ADX indicator. Use the regular ADX and take advantage two entry signals calculations and different ways of being alerted whenever there is potential entry or exit point.
Inputs Period: Period for the ADX calculation; PlotSignalType: How will the indicator calculate entry (swing) signals: 1- ShowSwingsOnTrendLevel : Show Signals for Trend Confirmation Swings; 2- ShowSwingsOnTrendLevelDirection

This is Gekko's Cutomized Relative Strength Index (RSI), a customized version of the famous RSI indicator. Use the regular RSI and take advantage two entry signals calculations and different ways of being alerted whenever there is potential entry or exit point.
Inputs Period: Period for the RSI calculation; How will the indicator calculate entry (swing) signals: 1- Produces Exit Signals for Swings based on RSI entering and leaving Upper and Lower Levels Zones; 2- Produces Entry/Exit Signals for

It is an analogue of the indicator of levels at https://www.mql5.com/en/market/product/24273 for the MetaTrader 5 platform. The indicator shows the levels of the past month, week and day. In addition, it draws a level in percentage relative to the difference between the High and Low of the past month and week. For the daily levels of the past day, the Close levels are additionally displayed. All you need to do is to configure the display parameters of the levels to your liking. In some cases, af

PowerSignal is a complete trading system based on the ATR technical indicator. This indicator will record the current status of each POWERTREND in every time frame and currency pair analyzed. The PowerSignal creates a trend strength and entry point signal list display by evaluating these data. If there is a full coincidence on any pair an alert will pop up indicating such case. List data includes Symbol, M5-MN1, BuyPercent, SellPercent, LastEntry. The LastEntry shows entry points (periods, price
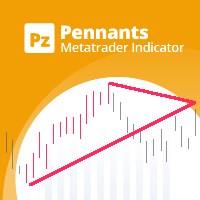
Unlock market continuations with the accurate pennants indicator
This indicator finds pennants , which are continuation patterns identified by converging trendlines surrounding a price consolidation period. Trades are signaled using a breakout period alongside the formation breakout. [ Installation Guide | Update Guide | Troubleshooting | FAQ | All Products ] Easy to use Customizable colors and sizes It implements breakout signals It implements alerts of all kinds
Optimal Usage To see pennants

This tool adds alerts to your Fibo Retracement and Fibo Expansion objects on the chart. It also features a handy menu to change Fibo settings easily and quickly! Please note the product is not working as a demo. Please watch the video.
Features Alert for Fibo Retracement and Fibo Expansion levels. Sound, Mobile and Email alert. Up to 15 Fibo Levels. Continuous sound alert every few seconds till a user clicks on the chart to turn it OFF. Single sound alert with pop-up window. Keeping all user se

The TimeFilter indicator allows visually selecting the bitmaks (GoodHourOfDay, BadHoursOfDay, GoodDayOfWeek, BadDaysOfWeek), which correspond to the Standard Library's Intraday Time Filter module for trading signals. Additionally, it is possible to enable and disable the trading intervals in a string form. It is also possible to use the trade volume multiplier when using the indicator as a part of an EA. String format: [week day]:[first hour]-[last hour]. See the screenshots and the video for us
The Envelopes indicator determines the presence of a trend or flat. It has 3 types of signals, shows the probable retracement levels and levels of the possible targets. The Fibonacci coefficients are used in the indicator's calculations. Signals (generated when touching the lines or rebounding from lines): Trend - the middle line of the Envelopes has a distinct inclination; the lines below the channel's middle line are used for buy trades, the lines above the middle line and the middle line
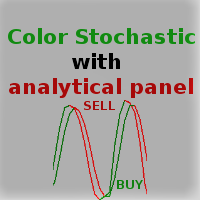
The main advantage of this indicator is filtering of buy and sell signals in the direction of the market impulse and ranking them by strength. Configuration of the indicator is simple and intuitive. All you need to do is to react only to strong signals. Adhere to the money management rules.
Description The Color Stochastic with an analytical panel indicator consists of the Stochastic indicator itself and the information/analytics panel. The indicator provides options for configuring the paramet
The Expert Advisor trades only Forex currencies on hedge accounts. The strategy depends on the selected trading mode. Trade mode - Weekly/Daily. This means that the trading cycle is limited by a week or a day. Lot size - fixed lot size. Set manually. The bar number of open positions - bar index from the start of the selected trading period for opening Limit or Stop orders. In case of Weekly mode, Н4 bars are considered. In case of Daily, Н1 bars are considered. The closing hour of trade - keep i
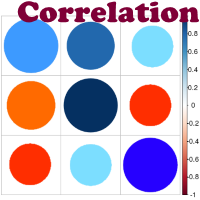
Advantage The analyzer provides an opportunity to examine correlation in history, for example, for the previous month excluding the current one, thus allowing you to evaluate symbol movement in history. It can be conveniently used in conjunction with the LineSyncMirrorCharts analyzer. Charts are synchronized by a market type: Forex, CFD, Futures, and Indices. The analyzer calculates the distance covered by the price on a specified period in points. The tool fits pairs and portfolio traders.
Des
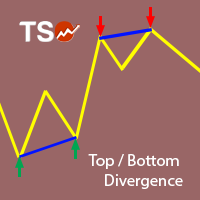
This indicator combines double bottom and double top reversal chart patterns together with RSI divergence detection.
Features Easily detect strong reversal signals. Allows to use double top/bottom and RSI divergence signals combined or independently. Get email and/or push notification alerts when a signal is detected. Custom colors can be used. The indicator is not repainting. Can easily be used in an EA. (see below)
Inputs ENABLE Double Top - Bottom: Enable the double top - bottom indicator.

Strongest and Weakest Currency Analysis This product shows the strength of the main currencies in FOREX based on average pip gain/loss in different time-frames! Depending on the strength of the currency, the indicator colors changes from blue to red also the orders may also be changed, allowing you to find the strongest and weakest currency at a glance!
Advantages Whatever your trading method and strategy are, it is always important to choose the correct pairs, so this indicator will help you a

i-Orders is a simple indicator to monitor your own trade/analyze others' trades. I use it for a long time and do not imagine a chart without these arrows, lines and trade result numbers.
Features
disable display of opened and closed positions ( Show OPENED , Show CLOSED , Show PENDING ), change colors of arrows and lines for profitable and loss-making buy and sell positions separately ( Color for profitable/ losing BUYs/SELLs ), change style and width of the lines connecting deal open and
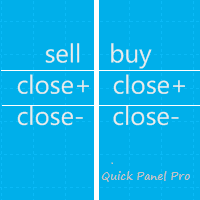
saat. Bu ipucu yalnızca hesap kapsamı içindir. Meta Trader 4 sürümü Quick Panel Pro özellikler Toplu hesaplamalar hızlı ve basittir. Durdurma çizgisini hareket ettirdiğinizde hesaplamalar anında gerçekleştirilir. Çoğu ticari işlem bu panele tıklanarak hızlı bir şekilde tamamlanabilir. Yeşil düğmelere tıklayarak paneller arasında hızlı bir şekilde geçiş yapabilirsiniz. Tek bir fare tıklamasıyla zararı durdurmayı değiştirin ve kar alın (geriye dönük test yok) Ortalama fiyatı sarı arka plana
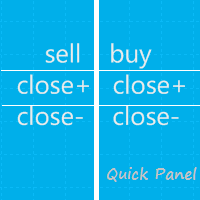
Not: Bu EA yalnızca risksiz hesaplarda çalışır. Metatrader sürüm 4 hızlı panel Bu panel, bir müzakere panelini oluşturan altı uzman danışmandan oluşan bir gruptur.
özellikler Çoğu alım satım görevi bu panellerdeki düğmelere tıklanarak hızlı bir şekilde tamamlanabilir. Paneller arasında geçiş yapmak yeşil düğmeye tıklamak kadar kolaydır. EA, Strateji Test Cihazının görsel grafikleri üzerinde çalıştırılabilir ve geçmiş verileri kullanarak ticaret pratiği yapmak için kolay bir yol sağlar. T
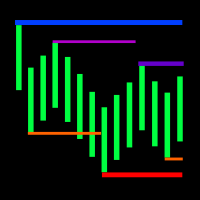
The indicator displays the fractal levels of one, two or three different higher timeframes starting beginning with the current one. When a new fractal appears, a new level is plotted. The indicator can be used for visual analysis of the current chart and applied in an EA. If more levels are needed, start a new instance of the indicator.
Features The indicator works on any timeframe and symbol. If a timeframe smaller than the current one is selected in the settings, the level of the current time
This is a further development of the Expert Advisor based on the two moving averages https://www.mql5.com/en/market/product/1693 . The EA implements a self-training mode allowing it to immediately start trading. However, it is also possible to conduct a preliminary EA training for more efficient trading. By default, the EA is configured to work on EURUSD H1. The robot is based on the modified probabilistic neural network. Initially, the neural network does not contain neurons. In this mode, the
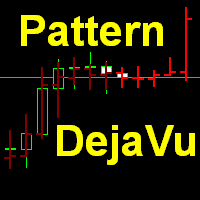
This indicator predicts the nearest bars of the chart based on the search of up to three best coincided patterns (a sequence of bars of a given length) in the history of the current instrument of the current timeframe. The found patterns are aligned with the current pattern at the opening price of the current (last) bar. The predicted bars are bars following immediately for patterns found in history. Pattern search is performed once every time a new bar of the current timeframe opens. The i

This StrongCurrency is a complete trading system based on a variety of technical indicators, moving averages and pivots. Each of those elements can be assessed in defined rules and coefficients (depending on the indicator) providing limitless optimization scenarios for the StrongCurrency. In order to work the StrongCurrency creates a trend strength and entry point signal list display by evaluating these data, that takes data from all symbols. It extrapolates all the information in order to get t
MetaTrader Mağazası - yatırımcılar için alım-satım robotları ve teknik göstergeler doğrudan işlem terminalinde mevcuttur.
MQL5.community ödeme sistemi, MetaTrader Hizmetlerindeki işlemler için MQL5.com sitesinin tüm kayıtlı kullanıcıları tarafından kullanılabilir. WebMoney, PayPal veya banka kartı kullanarak para yatırabilir ve çekebilirsiniz.

Alım-satım fırsatlarını kaçırıyorsunuz:
- Ücretsiz alım-satım uygulamaları
- İşlem kopyalama için 8.000'den fazla sinyal
- Finansal piyasaları keşfetmek için ekonomik haberler
Kayıt
Giriş yap
Web sitesi politikasını ve kullanım şartlarını kabul edersiniz
Hesabınız yoksa, lütfen kaydolun