 MetaTrader 5
 Uzmanlar
 Göstergeler
 Kütüphaneler
 Yardımcı programlar
 Widget'lar
 Kurallar
YouTube'dan Mağaza ile ilgili öğretici videoları izleyin
Bir alım-satım robotu veya gösterge nasıl satın alınır?
Uzman Danışmanınızı
sanal sunucuda çalıştırın
sanal sunucuda çalıştırın
Satın almadan önce göstergeyi/alım-satım robotunu test edin
Mağazada kazanç sağlamak ister misiniz?
Satış için bir ürün nasıl sunulur?
MetaTrader 5 için Teknik Göstergeler - 198
 Teknik göstergelerden gelen sinyaller, borsa ve Forex piyasalarında işlemler açılması ve kapatılmasında çok önemli bir rol oynar. Göstergeler, fiyat değişikliklerini tahmin etmeyi amaçlayan, finansal sembol fiyatının matematiksel dönüşümüdür.
Piyasa davranışını daha iyi tahmin etmek ve bundan kar elde etmek için teknik göstergeleri test edin.

Institutional Blueprint (MT5) — Market Structure, Order Blocks & Risk/Reward Zones
Institutional Blueprint reads the chart the way professional price-action traders do. On every closed bar it maps live market structure, marks the Order Block behind each move, and turns the most relevant block into a ready-to-read trade plan with a clear Entry, Stop Loss and three Take-Profit targets — drawn as a green reward zone and a red risk zone, so the trade geometry is obvious at a glance.
Based on Smar

SMC ENGULFING PATTERN DETECTOR PRO
Advanced Candlestick Pattern Recognition System for MetaTrader 5
OVERVIEW
The SMC Engulfing Pattern Detector is a professional-grade trading indicator designed to identify and analyze high-probability candlestick patterns in real-time. Built on Smart Money Concept (SMC) principles combined with classical candlestick pattern analysis, this indicator provides traders with precise entry signals based on proven market structure recognition.
Whether you are a s

Liquidity Trap Entry System — Ekle ve işlem yap Fiyat önemli bir seviyeyi kırıyor, giriş yapıyorsunuz — ve hemen geri dönüp stop-loss'unuzu alıyor mu? İşte bu bir likidite tuzağı (liquidity trap) : büyük oyuncular, dönüş yapmadan önce likidite toplamak için sahte bir kırılım yaratır. Bu gösterge tam olarak bu senaryoyu algılar ve hazır bir işlem planını doğrudan grafiğinize çizer. Çok basit — 3 adım Varsayılan ayarlarla göstergeyi grafiğe ekleyin. Sinyal anında belirir: Entry – SL – TP1→TP4 , he

ICT Institutional Zones Pro — Trade with Institutional Precision Stop wasting time manually drawing key ICT levels every day. ICT Institutional Zones Pro is a professional-grade MT5 indicator built for traders who use ICT (Inner Circle Trader) and Smart Money Concepts (SMC) to read market structure with precision. This indicator automatically maps the most important institutional levels directly on your chart, helping you instantly identify where smart money is likely accumulating, distributing

VibeFox Indicators — Çoklu Gösterge Sinyal Tarayıcısı VibeFox Indicators, klasik MetaTrader 5 araç kutusunu tek bir fareyle kullanılan kontrol merkezine dönüştürür. Bir düzine ayrı çalışmayı eklemek, yapılandırmak ve izlemek yerine, 14 iyi bilinen göstergeyi kompakt, tuval tabanlı tek bir panelden yönetir ve tarayıcının işlem sinyallerini grafiğinize gerçek zamanlı olarak doğrudan işaretlemesine izin verirsiniz. Çalışma alanını dağıtmadan temiz fiyat hareketi ve güvenilir göstergelerin teyidini
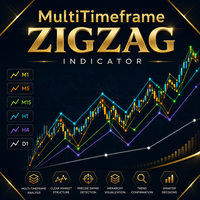
Fast view of market structure across multiple timeframes — always at hand.
Add it to your MT5 library and keep your chart clean. Simple, lightweight and practical — ideal as a supporting tool for daily price action analysis.
Track market structure with speed and clarity. MultiTF Fast Pivot ZigZag helps you identify HH, HL, LH, LL and key higher-timeframe levels without switching charts or cluttering your workspace.

MGH-MultiStoch — Multi-Timeframe Trend Detection and Wave Analysis (MT5) MGH-MultiStoch is a multi-timeframe trend indicator that displays up to 6 timeframes simultaneously in one window. It helps traders confirm trend direction across timeframes, count market waves visually, and build forward-looking wave scenarios based on higher-timeframe crosses. This is the MetaTrader 5 version. Because MT5 supports a wider range of timeframes, this version adds full per-line timeframe selection, so you ca

Most tools shout "BUY NOW" and hope you trust them. DeepTrade Intelligence Suite does the opposite — it hands you the evidence and lets YOU decide. For the current price pattern it answers, in real time, the only questions that matter: - How many times has this exact pattern appeared historically? - What was the success rate? - What was the average move — and the worst reversal? - How strong is this signal, really? - What are the probability scenarios up vs down? Example of what it shows in

Liquidity Order Blocks MT5 Liquidity Order Blocks MT5 is a professional visual indicator for MetaTrader 5 designed to help traders identify and monitor potential bullish and bearish liquidity areas directly on the chart. The indicator detects pivot-based order block zones and displays each zone with a structured visual breakdown of estimated bullish volume, bearish volume, relative strength and delta. Its purpose is to make liquidity areas easier to read, compare and monitor during market analys

Renko Flow Map MT5 Renko Flow Map MT5 is a non-repainting visual indicator that identifies confirmed directional opportunities and converts them into a structured trade map directly on the chart. Each confirmed setup displays its original entry, Stop Loss and three progressive target zones. Signals are generated only after candle close and historical entry arrows remain fixed. Main Features Confirmed BUY and SELL signals Non-repainting historical arrows Entry, Stop Loss, TP1, TP2 and TP3 levels

Dynamic Trend Moving Average for MT5 Dynamic Trend Moving Average is an intelligent moving average indicator designed to help traders instantly identify the current market trend through a simple and intuitive color-coding system. Unlike traditional moving averages, this indicator automatically changes color according to market conditions: Green – Bullish trend detected
Red – Bearish trend detected
Yellow – Neutral market or transition phase This visual approach allows traders to quickly

Spread Recorder — Multi-Symbol Max/Min Dashboard Spread Recorder is a real-time multi-symbol dashboard that continuously monitors live spreads across your entire watchlist and permanently records the maximum and minimum spread ever seen for each symbol — with timestamps. Key features: Monitor 10, 28, 50+ symbols simultaneously from a single customizable text file Auto-adaptive grid layout — the panel automatically resizes its rows and columns to fit however many symbols you load, from a handful

Swap Monitor — Multi-Symbol Buy/Sell Swap Dashboard with Alerts Swap Monitor is a real-time multi-symbol dashboard that displays live SELL and BUY swap rates for your entire watchlist in one compact, color-coded panel — and can alert you the instant any swap rate changes. Key features: Monitor 10, 28, 50+ symbols simultaneously from a single customizable text file Auto-adaptive grid layout — the panel automatically resizes to fit however many symbols you load Displays both SELL and BUY swap valu

Smart Reversal Bands – Professional Trading Indicator for MetaTrader 5
Smart Reversal Bands is a modern and user-friendly trading indicator designed for MetaTrader 5, helping traders identify potential market reversal opportunities through clear and easy-to-understand BUY and SELL signals.
Whether you are an experienced trader or just starting your trading journey, Smart Reversal Bands provides a clean visual trading experience that makes it easier to follow price movements and recognize poten

CyberTradeTHxAI Gold Sniper MT5 Professional Gold Trading Signal Indicator for MetaTrader 5 CyberTradeTHxAI Gold Sniper MT5 is a professional-grade Gold (XAUUSD) trading indicator developed to identify high-probability Buy and Sell opportunities using trend analysis, pullback confirmation, and intelligent market structure detection. Designed for both beginner and advanced traders, the indicator automatically calculates optimal Entry Zones, Stop Loss, and multiple Take Profit levels while provid

Apollo Pips Generator , trend yönünde sinyaller veren göstergedir. Gösterge, birden fazla giriş noktası sağlar, böylece her zaman kâr etmek için bir ticaret fırsatı bulabilirsiniz. Ekran görüntülerine dikkat edin. Ekran görüntüleri, Pips Generator aracını, kanal tarafından üstleri ve altları gösteren yıldız sinyalleriyle temsil edilen diğer aracımla birlikte gösterir. Bu kombinasyon, sistemi nasıl uygulayabileceğiniz konusunda size birçok yol sunar. Satın aldıktan sonra İKİNCİ GÖSTERGEMİ ÜCRETSİ

Xau scaper indicator - Advanced Gold Reversal & Trend Scalper Xau scaper indicator is an advanced technical analysis tool designed specifically for traders operating pure scalping strategies on Gold (XAU). Optimized for capturing rapid movements on lower timeframes, this indicator combines two powerful market logics into a single tool: identifying reversal points and clear reading of the underlying trend . Ideal for highly volatile assets like Gold, Xau scaper indicator offers timely signals for

Master Precision Trading with the ICT Macros Time Window Indicator (ICT Makro Zaman Penceresi Göstergesi ile Hassas İşlem Ustalığı) Zamanlama, finansal piyasalardaki nihai avantajdır. Inner Circle Trader metodolojisini takip eden yatırımcılar için, algoritmanın fiyatı tam olarak *ne zaman* hareket ettireceğini bilmek, *nereye* gideceğini bilmekten çok daha önemlidir. ICT Macros Time Window Indicator , bu algoritmik zaman segmentlerini doğrudan grafiklerinizde izlemeniz için vazgeçilmez aracınızd

SMC Smart Dashboard and Alerts MT5 is an advanced, lightweight, and non-repainting visual trading assistant designed for traders who follow Smart Money Concepts (SMC) and structural price action. Instead of guessing your next entry, this indicator automatically identifies structural shifts, calculates optimal entry/exit price targets based on your preferred Risk-to-Reward (RR) ratio, and displays everything on a clean, flicker-free real-time dashboard. Core Features & Analytical Logic SMC Struct

MT5 Liquidity Sweeps Indicator
MT5 Liquidity Sweeps Indicator detects buy-side and sell-side liquidity sweeps using swing-based market structure analysis. The indicator supports Wick-Based Sweeps, Break-and-Retest Sweeps, and Combined detection modes while tracking sweep lifecycle states including detected, touched, mitigated, and expired zones. Additional features include configurable mitigation logic, liquidity level visualization, event alerts, swing structure analysis, and historical sweep

Market Temperature Map Market Temperature Map is a visual indicator for MetaTrader 5 designed to show where the current price is positioned within its recent trading range. The indicator transforms this relative price position into a dynamic temperature scale. Cold colors represent prices near the lower part of the range, while hot colors represent prices near the upper part. This provides a fast and intuitive view of market pressure, momentum and potential exhaustion areas. How It Works The ind

Liquidity Magnet Map Liquidity Magnet Map is a visual liquidity analysis indicator for MetaTrader 5. It identifies unswept liquidity pools around confirmed swing highs and swing lows, evaluates their relative importance and highlights the zone currently showing the strongest attraction potential. The indicator combines market structure, proximity, pool maturity, tick volume and momentum alignment into a composite scoring model. Each active zone receives a relative probability percentage, making

ChronoSweep ChronoSweep is a professional market timing and liquidity indicator for MetaTrader 5. It combines key trading sessions, liquidity sweeps, displacement and Fair Value Gaps into a structured visual framework. The indicator focuses on specific intraday windows associated with increased market activity. Instead of filling the chart with unrelated signals, ChronoSweep highlights when price, liquidity and imbalance conditions align during the London and New York sessions. How It Works Chro

Directional Trend Cascade Directional Trend Cascade is a visual trend-following indicator for MetaTrader 5 designed to make market direction and potential trading opportunities easier to identify directly on the chart. The indicator analyzes the alignment of six exponential moving averages and displays them as a coordinated trend cascade. When a new directional alignment is confirmed, the system marks it with a BUY or SELL signal. How It Works A bullish trend is identified when the moving averag

Quarterly Theory Indicator: A Comprehensive Guide for SMC and ICT Traders (Üç Aylık Teori Göstergesi: SMC ve ICT Yatırımcıları İçin Kapsamlı Kılavuz) Quarterly Theory (Üç Aylık Teori) göstergesi , MetaTrader platformları için tasarlanmış gelişmiş bir zaman tabanlı analitik araçtır. Smart Money Concepts ve Inner Circle Trader metodolojisinin temel ilkelerine dayanan bu gösterge, finansal piyasalarda zamanın ve fiyat teslimatının fraktal doğasını görselleştirir. Gösterge, piyasaların rastgele hare

Session Volume Profile SMC , fiyatin sadece nereye gittigini degil, piyasanin gercekte nerede islem yaptigini gosterir. Her seans icin (Gun, Hafta veya Ay) dogrudan grafiginize yatay bir hacim profili kurar ve en cok aktivite ceken, fiyatin daha sonra saygi gosterme egiliminde oldugu fiyat seviyelerini ortaya cikarir.
Cogu grafik yalnizca fiyati gosterir. Volume Profile eksik boyutu ekler: her fiyatta ne kadar islem yapildigini . Bu gosterge bunu net, seans bazli bir okumaya donusturur ve uzeri

First Candle Sessions — LDN & NY MT5 Indicator | M1 to H1 | London and New York Sessions What It Does Automatically marks the High, Low and 50% midpoint of the first 5-minute candle at the opening of the London and New York sessions, creating a clear visual range to trade breakouts every day without any manual work. Buy signal: when a subsequent candle closes above the High of the first candle. Sell signal: when a subsequent candle closes below the Low of the first candle. No signal

Session Liquidity Mapper Session Liquidity Mapper is a professional analytical tool designed to map important liquidity zones in the market. The indicator was developed based on 18 years of observations, research, and practical experience, helping traders view price action from a different perspective. The indicator does not provide BUY or SELL signals. Its primary purpose is to identify important liquidity levels where market participants tend to focus their attention. With Session Liquidity Ma

Adaptive Trend Projection is a MetaTrader 5 indicator designed to help traders visualize the possible continuation of the current market structure. The indicator analyzes recent price behavior using two weighted regression windows: a longer lookback to understand the broader direction and a shorter lookback to capture the most recent movement. It then combines trend slope, recent acceleration, volatility, and ATR-based limits to draw a forward projection for the next candles. The central project

Gann Waves Smart Structure Pro (MT5) Tired of lagging, messy price action indicators that freeze your MetaTrader terminal? Welcome to Gann Waves Smart Structure Pro —the ultimate, high-performance market structure indicator for MetaTrader 5. Built upon authentic W.D. Gann wave-building mechanics, this tool seamlessly maps market swings and automatically flags institutional structural shifts ( CB, TN, GT ) in real-time. Whether you are a Smart Money Concepts (SMC) trader, a Gann enthusiast, or a

Upgrade your technical analysis with a professional, lag-free Pivot and Market Session indicator. Perfect for Day Traders, Scalpers, and Prop Firm users who need precise Support & Resistance zones without cluttering their MetaTrader 5 charts. Key Features: Clean Visuals: Uses exact-length trendlines instead of infinite rays to keep your chart clutter-free. Special Calculation: Uses special calculation to determine the pivot, resistance, and support zones. The accuracy is reliable. Smart Dynamic

ZoneSnap - Fixed Zones + M30 Momentum Confirmation
Stop guessing support and resistance. ZoneSnap automatically draws clean fixed price zones that institutions actually watch.
KEY FEATURES: 1. Fixed $50 / $100 Zones Auto-draws round psychological levels for XAUUSD, EURUSD, GBPUSD. No repaint. No lag. No candle scanning. Perfect for Gold traders who trade $2450, $2500, $2550 etc.
2. **M30 Stochastic Filter** Only get signals when M30 Stoch confirms. This filters out 40% of bad

Breakout Finder ATR detects high-probability breakout and breakdown zones built from repeatedly tested swing highs and lows, then projects ready-to-read Entry / Stop Loss / Take Profit levels calculated from market volatility (ATR). A compact on-chart dashboard keeps you informed of the current trend, the latest signal, and how that signal has played out so far. It works on any symbol and any timeframe and is designed as a clean visual decision-support tool — not a black box. Features Pivot-base

VectorFlow Signal VectorFlow Signal is a professional visual indicator for MetaTrader 5 designed to simplify trend analysis and highlight potential trading opportunities directly on the chart. The indicator uses an adaptive trend engine to detect directional changes and display clear Buy and Sell signals. Each signal is also classified by strength, helping traders quickly decide whether they want a more conservative, balanced or aggressive approach. Signal Strength Rating One of the key features

What if you could finally SEE where the market really wants to go?
Most traders watch price. Pros watch VOLUME — where the money was actually traded. Volume Profile Fibo Confluence puts that reading right in front of you, in plain language, no jargon.
WHAT YOU SEE ON YOUR CHART • The POC, the most-traded price: the market's natural magnet • The value area (VAH / VAL): the "house" where price spends its time • Automatic Fibonacci retracement + the golden pocket • Low-volume nodes

The market speaks a language. This tool translates it for you.
Behind the apparent chaos of candles lies a grammar: structure. Institutions read it, beginners suffer it. Market Structure makes it visible on your chart — and with NO REPAINT.
WHAT THE TOOL DRAWS • The structure zigzag: the real highs and lows, connected • BOS (Break of Structure) : the trend continues • CHoCH (Change of Character) : the structure TURNS, the alert that matters • SWEEP (fake breakout) : a wick tr

ICT Kill Zones marks the four main intraday sessions on your chart and the high and low of each session. It is an analytical tool for traders who follow the ICT and Smart Money approach. It does not place orders and does not give automatic buy or sell signals. It shows when the active sessions occur and where session liquidity rests, so you can make your own trading decisions. Session high and low levels and sweep events are confirmed on closed candles only. Past levels are not redrawn. The MT

MetaTrader stops at the minute. You'll see by the SECOND.
MT5 offers no chart below M1. That's a real gap for scalpers. Tick Candles fills it: from the real tick flow, it builds a mini candle chart of 1, 5 or 10 seconds, overlaid on your screen. The TradingView view, inside MT5.
️ WHAT YOU SEE • A seconds-candle frame, refreshed several times per second • The direction of the current candle (up / down / flat) • The delta of the last seconds + speed in ticks/s = the market's PULSE (

Not all hours are equal in trading.
The same setup isn't worth the same at 3am and at the New York open. Trading Sessions colors the three major market sessions right on your candles, so you know at a glance WHEN you're trading.
WHAT YOU SEE • Colored zones Asia / London / New York , laid over price • Asian High / Asian Low: the Asian range edges, so often hunted by London and New York before the real move • A clock panel: the active session, live
WHY IT MATTERS T

The trend, finally obvious. Even for a complete beginner.
Four moving averages, one instant reading. EMA Ribbon turns a complicated calculation into a color you understand in one second.
WHAT YOU SEE • A ribbon of 4 EMAs, fastest to slowest • Green = clear uptrend • Red = clear downtrend • Gray = no trend, the market hesitates → stand aside • A panel writes the verdict in plain words
THE IDEA When the averages are neatly stacked and spread, the trend is clear. When they tang

The Dynamic Market Profile allows you to analyze the volume of any specific chart region manually and instantly. No more being restricted to fixed daily or weekly profiles: you choose the exact move, consolidation, or trend leg you want to analyze . The indicator lets you draw up to 5 independent areas at the same time using interactive rectangles . How It Works on a Daily Basis Create the zone: Press keys 1, 2, 3, 4, or 5 on your keyboard (or use the on-screen buttons) to plot a rectangle . A

VibeFox Volume Profile — MetaTrader 5 için Volume Profile VibeFox Volume Profile, MetaTrader 5 için eksiksiz bir Volume Profile araç setidir. İşlem gören hacmin fiyat boyunca yatay dağılımını oluşturur, böylece piyasanın en çok nerede aktivite gösterdiğini, nerede ince işlem yaptığını ve hangi fiyat seviyelerinin mıknatıs veya bariyer gibi davranma olasılığı olduğunu anında görürsünüz. Her profil doğrudan grafiğin üzerine çizilir ve modern, fareyle kontrol edilen bir panelden yönetilir — eşelene

Candle Clock All Timeframes — Real-Time Countdown MT5 Indicator | M1 to Monthly | Updates every second What It Does Displays a real-time countdown timer next to the current candle showing exactly how many minutes and seconds remain before the candle closes. The timer updates every second automatically and works on all timeframes from M1 to Monthly without any manual intervention. Position: the timer always appears next to the active candle on the right side of the chart. Updates: ev

MQL5 Blogları: https://www.mql5.com/en/blogs/post/771791 MT4 Sürümü: https://www.mql5.com/en/market/product/182305 MT5 Sürümü: https://www.mql5.com/en/market/product/182306
WAVE FIBONACCI [tambangEA], yükseliş ve düşüş fiyat projeksiyonlarını doğrudan grafikten okumak isteyen yatırımcılar için tasarlanmış profesyonel bir piyasa yapısı ve Fibonacci dalga analizi göstergesidir.
Gösterge, dalga yapısını, Fibonacci projeksiyon bölgelerini, hedef seviyelerini, salınım noktalarını ve çok sembollü n

ATR-based trend signals, structured trade planning and higher-timeframe price-action context in one MetaTrader 5 indicator. LTYoshi_Pro is a decision-support indicator built around an ATR trailing-stop engine. It is designed to help traders organize trend signals, risk levels and market context without mixing every chart element into a single automatic decision.
The indicator separates its work into independent layers. The core engine produces raw Buy/Sell events when the selected price source

Short description (Market summary box) SMC Structure Pro is a Smart Money Concepts / ICT structure indicator for MetaTrader 5. It automatically marks HH/HL/LH/LL swing points, draws BOS and CHoCH breaks, detects Order Blocks and Fair Value Gaps, and supports multi-timeframe confirmation — all in one chart-window indicator with a live info panel and full alert support (popup, sound, push, email).
SMC Structure Pro — Smart Money Concepts Structure & Order Flow Indicator SMC Structure Pro is a com

Decision Guard Risk Panel MT5 MT5 position-size calculator and pre-trade risk panel with draggable Entry, Stop Loss and Take Profit levels, automatic lot sizing and live R:R. PLAN RISK BEFORE EXECUTION Decision Guard Risk Panel MT5 is a chart-based position-size calculator and pre-trade risk planning tool for MetaTrader 5. It helps you define Entry, Stop Loss and Take Profit, calculate the matching lot size and review the complete risk structure before a trade begins. The product does not genera

# SMC Suite Pro — Smart Money Concepts & Trend Analysis Workspace
**SMC Suite Pro** is an institutional-grade, all-in-one market structure and trend analysis toolkit for MetaTrader 5. By consolidating three powerful analytical methods into a single system, it provides a comprehensive view of market trends, key liquidity zones, and structural breakouts without cluttering your workspace.
Unlike traditional indicators that can severely lag your platform, **SMC Suite Pro** has been built from the

TDI Trend Filtered - Revived Classic with Trend Filter Description The Traders Dynamic Index (TDI) is a legendary indicator developed by trader Dean Malone, used by professionals in financial markets for decades. It is a powerful multi-functional tool that combines the elements of RSI, moving averages, and Bollinger Bands volatility. Unfairly forgotten in recent years, this indicator is getting a second wind in our modernized version. We have added a Trend Filter based on a Moving Average , whi

Order Block Pro — Institutional Order Blocks with Entry, SL & 3 Take-Profits (ICT / SMC)
See where smart money entered and trade the retest with a complete Entry, Stop-Loss and TP1/TP2/TP3 plan — automatically, on closed candles only. Non-repaint. FULL DESCRIPTION Order Block Pro maps the institutional Order Blocks that drive price in the ICT / Smart Money Concepts framework and turns every valid one into a clean, ready-to-trade plan. No more guessing where to draw your zones: it finds the last

Scanner di congestione Panoramica Vuoi padroneggiare il breakout trading e identificare con precisione i range di consolidamento? Congestion Scanner è un'utilità interattiva e ad alte prestazioni per MetaTrader 5, ispirata ai classici modelli di congestione descritti dal leggendario trader Joe Ross . Nella teoria del trading, i mercati trascorrono una parte significativa del tempo nelle fasi di consolidamento. Identificare questi range stretti è la chiave per catturare mosse di breakout ad alto

Pivot Breakout Map Pivot Breakout Map is a visual indicator for MetaTrader 5 that automatically connects confirmed pivot highs and lows to create dynamic support and resistance trendlines. When price closes beyond an active trendline, the indicator marks the breakout and generates a complete trade map with Entry, Stop Loss and three Take Profit levels. Main Features Automatic pivot-based trendlines Confirmed bullish and bearish breakout signals Entry, Stop Loss and TP1–TP3 projection ATR or perc

Adaptive Stochastic Exhaustion is not a normal Stochastic indicator. It does not say “buy” or “sell”. It is designed to help you understand whether an extreme Stochastic zone is still strong or whether it is starting to lose strength. The blue line is the smoothed Stochastic. When it is above 80, the market is in a high / overbought zone. When it is below 20, the market is in a low / oversold zone. The grey line is the signal line, which is a moving average of the blue line. It helps you see whe

Here is a detailed, professional English description of the "MiTH Master Zone" (referred to as Miss Master Zone on the chart dashboard) indicator system. You can copy and paste this directly into the MQL5 product description, documentation, or user guide. It is structured to explain the core philosophy, technical logic, and precise order execution strategy. MiTH Master Zone (v1.09) — Indicator Description & Trading Manual 1. Core Philosophy and Conception The MiTH Master Zone is an institutiona

ndicator Overview: MiTH Master Zone Vol (v2.29) MiTH Master Zone Vol is an advanced, professional-grade technical analysis indicator specifically optimized and engineered for the 1-Hour (H1) timeframe on the MetaTrader 5 (MT5) platform. It seamlessly integrates fixed structural price grids, a dynamic dual-partitioned Volume Profile, and an automated price action pattern-recognition system into a cohesive, single-chart interface. The indicator is designed to provide H1 swing traders and intraday

KS Volume Profile, MetaTrader 5 için kapsamlı ve çok özellikli bir hacim profili ve hacim analizi göstergesidir. Geleneksel hacim profili analizini; dinamik destek/direnç tespiti, tükeniş sinyalleri, volatilite filtreleri ve görsel iyileştirmelerle birleştirir.
Temel Konsept
Hacmin fiyat seviyeleri genelinde nasıl dağıldığını (Hacim Profili) görselleştirirken, aynı zamanda hacim davranışı, fiyat hareketi ve volatiliteye dayalı sinyaller sunan bir uygulamadır.
Ana Özellikler 1. Hacim Ağırlıklı

Liquidity Sweeps and Inverse FVGs RKADEV Transform your chart into a professional Smart Money Concepts (SMC) workspace. This is not just a standard indicator; it is a mechanical trading assistant designed to keep your execution structured, objective, and emotion-free. How to Use (Quick Start Guide): Step 1 (Setup): Attach the indicator and customize your Risk/Reward (RR) targets in the Inputs tab. Step 2 (Monitor): Keep an eye on the Dynamic Dashboard at the bottom-left corner. It tracks market

VibeFox AD — hacim tabanlı birikim ve dağıtım göstergesi giriş noktalarıyla VibeFox AD, MetaTrader 5 için gerçek zamanlı bir Accumulation/Distribution göstergesidir. Klasik A/D Çizgisini ayrı bir alt pencerede çizer, bir giriş sinyalinin oluştuğu anı doğrudan fiyat grafiğinde işaretler ve tüm kontrolleri modern bir etkileşimli panelde toplar. Hacmin nereye aktığını tahmin etmek için A/D eğrisini manuel olarak izlemek yerine, hacim baskısının yönünü ve giriş noktasını tam oluştukları anda görürsü

VibeFox Alligator — trend tespiti, piyasa fazları ve giriş noktaları VibeFox Alligator, MetaTrader 5 için gerçek zamanlı bir Bill Williams Alligator göstergesidir. Üç düzleştirilmiş hareketli ortalamayı — Jaw, Teeth ve Lips — doğrudan fiyat grafiğine çizer, bir giriş sinyali göründüğü anda bunu net bir ok ile işaretler ve tüm kontrolleri modern bir interaktif panelde toplar. Üç çizgiyi manuel olarak takip edip piyasanın ne zaman uyandığını tahmin etmek yerine, piyasanın durumunu ve giriş noktası

Cross Asset Strength Meter ranks a basket of instruments by normalized momentum strength, side by side, in a single sortable dashboard. Most strength meters only cover the 8 Forex majors. This one is built to compare anything you trade at the same time: indices, metals, crypto and FX together. It does not open trades, it does not predict, and it does not repaint. It is a clean ranking tool that answers one question: which of my instruments are strongest and which are weakest right now. How it wo

VibeFox ATR — volatilite, sıçramalar ve giriş noktaları VibeFox ATR, MetaTrader 5 için gerçek zamanlı bir Average True Range göstergesidir. ATR çizgisini ve onun yumuşatılmış taban çizgisini ayrı bir alt pencerede çizer, volatilitenin aniden yükseldiği anı doğrudan fiyat grafiği üzerinde işaretler ve tüm kontrolleri modern, etkileşimli tek bir panelde toplar. Piyasanın ne kadar geniş salındığını gözle tahmin etmek yerine, güncel volatiliteyi, ortalama seviyesini ve bir sıçramanın anını tam oluşt

VibeFox ADX — trend gücü, yön ve giriş noktaları VibeFox ADX, MetaTrader 5 için gerçek zamanlı bir Average Directional Index göstergesidir. Klasik ADX, +DI ve -DI üçlüsünü ayrı bir alt pencerede çizer, bir giriş sinyalinin ortaya çıktığı anı doğrudan fiyat grafiğinde işaretler ve tüm kontrolleri tek bir modern etkileşimli panelde toplar. Çizgileri elle karşılaştırıp trendin yeterince güçlü olup olmadığını tahmin etmek yerine, hareketin gücünü, yönünü ve giriş noktasını oluştukları anda görürsünü

VibeFox AMA — Giriş sinyalleri ve etkileşimli panel ile uyarlanabilir hareketli ortalama VibeFox AMA, MetaTrader 5 için gerçek zamanlı bir Kaufman Adaptive Moving Average göstergesidir. Klasik KAMA çizgisini doğrudan fiyat grafiğine çizer, giriş sinyallerini oluştuklarında işaretler ve tüm kontrolleri modern etkileşimli bir panelde toplar. Ayar pencereleri arasında geçiş yapmak ve yavaşça adapte olan bir çizgiyi izlemek yerine, ortalamanın fiyatı ne kadar hızlı takip ettiğini tam olarak görürsün

VibeFox Bollinger — volatilite, bantlar ve giriş noktaları VibeFox Bollinger, MetaTrader 5 için gerçek zamanlı bir Bollinger Bands göstergesidir. Klasik üçlü çizgiyi — bir orta çizgi ve her iki yanında birer bant — doğrudan fiyat grafiğinin üzerine çizer, bir Entry sinyalinin ortaya çıktığı anı işaretler ve tüm kontrolleri tek bir modern etkileşimli panelde toplar. Fiyatın bir banda doğru ne kadar uzadığını ve ne zaman geri dönmesinin beklendiğini elle izlemek yerine, volatiliteyi, hareketin sın

VibeFox Fractals — Bill Williams fraktalları ve fraktal kırılım girişleri VibeFox Fractals, MetaTrader 5 için gerçek zamanlı bir Bill Williams fraktal göstergesidir. Fiyat grafiğindeki her yerel tepe ve dibi işaretler, son onaylanmış fraktalı bir kırılım sinyali için hazır bir seviyeye dönüştürür ve tüm kontrolleri tek bir modern etkileşimli panelde toplar. Dönüşleri elle aramak ve son anlamlı yüksek ve düşük seviyeleri aklınızda tutmak yerine, piyasa yapısını ve fiyatın sınırını kırdığı anı anı

VibeFox Ichimoku — Giriş Sinyalleri ve Etkileşimli Panel ile Ichimoku Kinko Hyo VibeFox Ichimoku, MetaTrader 5 için klasik Ichimoku Kinko Hyo sisteminin eksiksiz bir uygulamasıdır. Gösterge, tüm beş bileşeni gerçek zamanlı olarak çizer, Kumo bulutunu piyasa duyarlılığına göre iki farklı renkte boyar, fiyat grafiği üzerinde giriş sinyallerini otomatik olarak işaretler ve tüm kontrolleri canvas tabanlı modern etkileşimli bir panelde toplar. Sekmeler ve diyaloglar arasında geçiş yapmaya gerek yoktu

VibeFox Parabolic SAR - takip eden stoplar, trend yönü ve stop-and-reverse girişleri VibeFox Parabolic SAR, klasik Parabolic Stop-And-Reverse'i net bir noktalı izle, otomatik dönüş girişleriyle, eksiksiz bir renk ve şeffaflık kaydırıcı setiyle ve Inputs penceresini bir daha hiç açmadan her ayarı düzenlemenizi sağlayan, grafik üzerinde sürüklenebilir bir panelle hayata geçirir. Tek bir bakışta tek bir soruyu yanıtlamak için tasarlandı - şu anda piyasada hangi taraf kontrolde ve el değiştirmeye ne

VibeFox Auto S/R — grafikte otomatik destek ve direnç bölgeleri VibeFox Auto S/R, MetaTrader 5 için gerçek zamanlı bir destek ve direnç katmanıdır. Gösterge seçilen bar sayısını tarar, swing pivot noktalarını tespit eder, yakın pivot noktalarını ATR yakınlığına göre fiyat bölgelerine gruplar, her bölgeyi dokunma sayısına göre sıralar ve elde edilen bölgeleri doğrudan grafik üzerine çizer. Tüm tespit parametreleri ve görsel seçenekler tek bir modern etkileşimli panelde toplanmıştır. Manuel çizim

VibeFox Chandelier — ATR takip stopu ve ters cevrim sinyalleri VibeFox Chandelier, MetaTrader 5 icin gercek zamanli bir Chandelier Exit overlayidir. Dogrudan fiyat grafigi uzerinde tek bir uyarlanabilir stop cizgisi cizer, fiyat gelistikce Long ve Short taraflari arasinda gecis yapar ve her ters cevrimde tam anda net bir BUY veya SELL sinyali isaret eder. Tum kontroller, dikkatinizi grafiklere degil piyasaya verebilmeniz icin tek bir akici etkilesimli panelde toplanmistir. Chandelier Exit nedir

VibeFox MA — Giriş sinyalleri ve etkileşimli panel ile Hareketli Ortalama VibeFox MA, MetaTrader 5 için tam özellikli bir Moving Average göstergesidir. Fiyat grafiği üzerinde doğrudan pürüzsüz bir MA çizgisi çizer, her giriş sinyalini koşulun oluştuğu tam çubukta renkli bir okla işaretler ve tüm kontrolü tek bir modern canvas tabanlı panelde toplar. Dört hesaplama yöntemi, yedi fiyat kaynağı, iki bağımsız giriş türü ve canlı ayarlanabilir görsel motor, onu hem bir dakikalık scalping grafiğinde h
MetaTrader Mağazası, geçmiş verileri kullanarak test ve optimizasyon için alım-satım robotunun ücretsiz demosunu indirebileceğiniz tek mağazadır.
Uygulamaya genel bakışı ve diğer müşterilerin değerlendirmelerini okuyun, doğrudan terminalinize indirin ve satın almadan önce alım-satım robotunu test edin. Yalnızca MetaTrader Mağazasında bir uygulamayı tamamen ücretsiz olarak test edebilirsiniz.

Alım-satım fırsatlarını kaçırıyorsunuz:
- Ücretsiz alım-satım uygulamaları
- İşlem kopyalama için 8.000'den fazla sinyal
- Finansal piyasaları keşfetmek için ekonomik haberler
Kayıt
Giriş yap
Web sitesi politikasını ve kullanım şartlarını kabul edersiniz
Hesabınız yoksa, lütfen kaydolun