 MetaTrader 5
 Experts
 지표
 라이브러리
 유틸리티
 위젯
 규칙
MetaTrader 5용 기술 지표 - 198
 기술 지표의 시그널은 주식 및 외환 시장에서 거래를 개시 및 종료하는 데 중요한 역할을 합니다. 지표의 본질은 미래의 가격 변화를 예측하기 위한 금융 시그널 값의 수학적 변형입니다.
기술 지표를 테스트하여 시장 행동과 그로 인한 이익을 더 잘 예측할 수 있습니다.

SMART EXIT Trend Exit Indicator is designed to help traders stay in profitable trends and identify when a trend has genuinely come to an end. Many traders enter good positions but exit too early due to fear, uncertainty or market noise. SMART EXIT helps reduce emotional decision-making by providing clear visual confirmation when market momentum changes and a trend reversal is taking place. The indicator is designed to keep traders focused on the trend while providing timely exit confirmation whe

What is AEMA Truth Trend? 1. AEMA Truth Trend is not just a moving average.
It is an adaptive trend indicator designed to identify the market’s “true price axis.” Instead of relying only on closing price like a standard EMA, AEMA uses a balanced price core that considers candle position, candle-cluster bias, opening gap, and ATR-based volatility. As a result, it reflects market behavior more deeply, rather than reacting mechanically to price. 2. How is AEMA different from Bollinger Bands?
Boll

CleanSMC Lite CleanSMC Lite is a MetaTrader 5 custom indicator designed to help traders analyze market structure using a clean Smart Money Concepts style workflow. The indicator focuses on visual structure mapping, demand and supply zones, fair value gap detection, equal highs and equal lows, and optional BUY/SELL signal arrows. The tool is built for discretionary technical analysis and is intended to support chart reading, not to replace a complete trading plan. It does not execute trades, open

VegaFlow Gap Pressure FAST — MQL5 Market Product Description
Short Description VegaFlow Gap Pressure FAST is a MetaTrader 5 custom indicator that measures opening gap pressure normalized by recent average absolute opening gap, then displays an oscillator, signal line, histogram, and optional closed-bar arrows.
Main Description VegaFlow Gap Pressure FAST is a professional MetaTrader 5 custom indicator designed for manual traders who want to evaluate how strongly the current bar opens above or

Trend Filter By HYPOLITE MAKER (v3.00) Trend Filter is a visual indicator for MetaTrader 5 designed to clean up your charts and display the market's true trend. It eliminates market noise and visual traps to help you stay on the right side of the market, with significantly less lag than standard moving averages. Visuals & Key Features The Central Line: It changes color to give you the market direction at a glance. Green for an uptrend, Red for a downtrend, and Yellow when the market is hesitatin

UT Bot Yoshi Trend ATR MT5 – Professional ATR Trailing Stop Trend Indicator for MetaTrader 5 UT Bot Yoshi Trend ATR MT5 is a professional trend-following indicator for MetaTrader 5, designed to help traders read market direction, follow volatility-based trailing stop behavior, and organize Buy/Sell trading ideas with a clean visual structure. The indicator is built around a practical and well-known trading concept: ATR trailing stop logic . Instead of trying to predict the market or identify per

“I don’t control the market – I too move with it.” - Printer dailyRun What if you could stop fighting the market? Most traders cling. They grip their P&L, their indicators, their hope.
The market flows – they resist. And the tighter they hold, the faster it slips away. I am Printer dailyRun! Like my younger sibling Printer intraday, I am not another strategy!
I'm a live market decoder that walks with price, not against it. No magic. No random lines. No recycled systems.
I don

MQL5 블로그: https://www.mql5.com/en/blogs/post/771566 MT4 버전: https://www.mql5.com/en/market/product/181554 MT5 버전: https://www.mql5.com/en/market/product/181555
듀얼 리그레션(DUAL REGRESSION) [tambangEA]은 트레이더가 이중 로그 회귀 채널, 거래량 패턴, 그리고 다중 통화쌍 대시보드 모니터링을 통해 가격 움직임을 분석할 수 있도록 설계된 전문 시장 구조 지표입니다.
이 지표는 광범위한 시장 방향을 위한 거시 회귀 채널과 활발한 거래 영역 분석을 위한 단기 회귀 채널을 결합했습니다. 또한, 기울어진 거래량 프로파일 시각화, POC(Point of Control) 참조, 매수/매도 틱 거래량 통계, 델타 압력, 방향 화살표, 그리고 빠른 차트 해석을 위한 간결한 대시보드 패널을 제공합니다.
이 도구는 자동 거래 로직을 사용하지 않고 시

“I don’t control the market – I too move with it.” - Printer weeklyRun What if you could stop fighting the market? Most traders cling. They grip their P&L, their indicators, their hope.
The market flows – they resist. And the tighter they hold, the faster it slips away. I am Printer weeklyRun! Like my younger siblings Printer intraday, and Printer dailyRun, I am not another strategy!
I'm a live market decoder that walks with price, not against it. No magic. No random lines. No re

ICONIC AI SIGNAL v2.0
MetaTrader 5 적응형 멀티 타임프레임 컨플루언스 인디케이터 전통적인 기술적 지표는 라이브 트레이딩으로 전환하는 바로 그 순간 실패합니다. 그 이유는 수학적으로 불가피합니다. 정적이기 때문입니다. 고정된 공식. 기억 없음. 시장이 현재 명확한 트렌드 속에 있는지 아니면 혼란스럽고 유동성 낮은 횡보장에서 소진되고 있는지를 인식할 능력이 없습니다. 백테스트에서 완벽해 보일 때, 이는 거의 항상 과거 노이즈에 무의식적으로 과적합되었기 때문입니다. 실제 조건에서는 가장 필요한 순간에 정확히 실패합니다. 국소 소진 구역, 가짜 브레이크아웃, 레짐 전환점에서 말입니다. ICONIC AI SIGNAL v2.0은 다르게 구축되었습니다. MetaTrader 5 내부에서 네이티브로 실행되는 완전히 투명한 자기학습형 멀티 타임프레임 컨플루언스 엔진입니다. 그 핵심에는 두 개의 병렬 AI 시스템이 있습니다. 각 시장 조건에서 어떤 진입 특징이 성공을 예측하

“I don’t control the market – I too move with it.” - Printer monthlyRun What if you could stop fighting the market? Most traders cling. They grip their P&L, their indicators, their hope.
The market flows – they resist. And the tighter they hold, the faster it slips away. I am Printer monthlyRun! Like my younger siblings Printer intraday, Printer dailyRun, and Printer weeklyRun, I am not another strategy!
I'm a live market decoder that walks with price, not against it. No magic.

SMC Structure Gap Monitor Pro 이 MetaTrader 5 인디케이터는 보다 완성도 높은 SMC 스타일 구조 분석 워크플로를 원하는 트레이더를 위해 설계되었습니다. 핵심 초점은 구조적 돌파, 인듀스먼트 흐름, 미체결 및 일부 체결된 Fair Value Gap, 유동성 스윕, 그리고 모멘텀 컨텍스트에 있습니다. 핵심 아이디어: 단순히 구조 라벨만 따로 보여주는 것이 아니라, 가격이 어떻게 압력을 쌓고 있는지, 인듀스먼트가 어디에서 형성되는지, 언제 스윕이 발생하는지, 그리고 그 주변에서 모멘텀이 어떻게 확장되거나 약해지는지를 읽을 수 있도록 돕는 데 목적이 있습니다. 출시 가격: 이 제품은 프로모션 출시 가격으로 제공됩니다. 가격은 향후 업데이트에서 조정될 수 있습니다. 빠른 요약 제품 유형 MetaTrader 5 인디케이터 주요 초점 구조 흐름, 인듀스먼트, Fair Value Gap, 스윕, 모멘텀 컨텍스트 사용 스타일 재량 차트 분석, 리뷰, EA 지향 버

VibeFox Candles — 캔들 패턴 스캐너 VibeFox Candles는 MetaTrader 5용 실시간 캔들 패턴 스캐너입니다. 가장 중요한 일본식 캔들 형태를 자동으로 인식하고, 현대적이고 인터랙티브한 패널을 통해 차트에 직접 표시해 줍니다. 모든 봉을 일일이 살펴보는 대신 한눈에 가격 움직임을 읽을 수 있습니다. 인식되는 패턴 스캐너는 단일 캔들, 두 개 캔들, 세 개 캔들 형태를 아우르는 14가지 고전 캔들 패턴 을 감지합니다. 단일 캔들: Doji, Marubozu, Hammer, Inverted Hammer. 두 개 캔들: Bullish Engulfing, Bearish Engulfing, Bullish Harami, Bearish Harami, Tweezer Bottom, Tweezer Top. 세 개 캔들: Morning Star, Evening Star, Three White Soldiers, Three Black Crows. 각 패턴은 새로 마감되는 봉마다

A professional MT5 trading panel designed for decision support, risk management, and trade planning — not automated execution.
Helps traders plan entries, manage positions, and control risk with clarity and consistency.
Overview Real-time trading decision panel that analyzes trend, momentum, and market quality directly on the chart. It provides ATR-based TP/SL levels and clear buy/sell conditions to support faster and more consistent trading decisions.
This is a decision support tool only —

VibeFox Levels — Support, Resistance 및 핵심 가격 수준 VibeFox Levels는 MetaTrader 5를 위한 올인원 가격 수준 도구 모음입니다. 가격 행동 트레이더에게 가장 중요한 구조——수평 Support와 Resistance, Supply 및 Demand 구역, Fibonacci 되돌림, Trend Lines, Round Numbers——를 자동으로 감지하고 그려, 모든 것을 단일의 현대적이고 인터랙티브한 패널을 통해 제시합니다. 모든 심볼과 시간 프레임에서 수준을 손으로 표시하는 대신, 지표가 그것들을 찾도록 맡기고 당신은 결정에 집중하게 됩니다. 하나의 지표에 다섯 가지 수준 도구 각 도구는 독립적으로 작동하며 클릭 한 번으로 켜거나 끌 수 있어, 전략에 맞는 것만 실행하거나 다섯 가지 모두를 결합해 차트의 완전한 지도를 만들 수 있습니다. Lines (Support / Resistance) ——확인된 가격 반응으로 구축된 수평 수준입니다.

DeepTrade SMC Tools automatically draws the key Smart Money Concepts on your chart so you can read institutional footprints at a glance — no manual marking, no clutter. It updates on every new bar and works on any symbol and timeframe. WHAT IT DRAWS - Order Blocks (bullish & bearish) — the last opposite candle before a strong displacement move - Fair Value Gaps (FVG) — 3-candle imbalances, with a minimum-size filter to hide noise - Liquidity zones — equal highs (EQH) and equal lows (EQL) wher

VibeFox Price Alert — 인터랙티브 가격 레벨 알림 VibeFox Price Alert는 MetaTrader 5를 위한 실시간 가격 알림 도구입니다. 차트에 직접 알림 레벨을 배치하면 인디케이터가 당신을 대신해 시장을 지켜보며, 가격이 레벨에 도달하는 순간 알림을 보냅니다. 화면을 응시하며 어떤 숫자를 기다리는 대신, 레벨을 한 번만 설정해 두면 인디케이터가 망을 보는 동안 당신은 거래를 계속할 수 있습니다. 모든 것은 차트 위에 바로 자리 잡은, 마우스 친화적인 현대적 패널에서 제어됩니다. 생각하는 방식대로 알림 설정 가격 알림을 추가하는 것은 빠르고 시각적입니다. 차트 오른쪽 가장자리의 가격 눈금 위에 마우스를 올리면 커서 옆에 녹색 + 가 나타나며, 한 번의 클릭으로 바로 그 가격에 알림이 놓입니다. 채워야 할 대화 상자도, 손으로 입력할 숫자도 없습니다. 각 알림에는 잡아서 움직일 수 있는 차트상의 슬라이더 도 함께 제공됩니다. 위아래로 끌어 트리거 가격을 변경

VibeFox SmartMoney — Smart Money Concepts 도구 모음 VibeFox SmartMoney는 MetaTrader 5를 위한 실시간 Smart Money Concepts 지표입니다. 기관 price action 트레이더가 하는 방식으로 시장 구조를 읽고, 중요한 모든 것을 현대적이고 인터랙티브한 패널을 통해 차트에 직접 그려줍니다. swing, 갭, 구역을 손으로 찾는 대신, 구조 돌파, order block, 불균형, 유동성, 그리고 관찰할 준비가 된 진입 구역을 그것들이 형성되는 순간에 보게 됩니다. 모든 것은 하나의 아이디어를 중심으로 만들어졌습니다. 완전한 SMC 워크플로를, 어떤 심볼과 어떤 시간프레임에서도 실시간 시장과 동기화를 유지하는 단일하고 구성 가능한 도구로 바꾸는 것입니다. 시장 구조 — BOS와 CHoCH 모든 Smart Money 해석의 핵심은 구조이며, VibeFox SmartMoney는 그것을 자동으로 매핑합니다. BOS (Bre

Market Maker Context Levels MT5 is a visual chart helper designed for traders who want important market context directly on the chart. The indicator combines trend structure, session timing, daily range information, and higher-timeframe reference levels into one clean MT5 overlay. It does not trade automatically and does not give buy/sell signals. Instead, it helps you read the chart environment more clearly before making your own trading decisions. Main features: - 5, 13, 50, 200, and 800 EMA s

Have patterns that drive your trading success or failure in MT5. The Equity Performance Analyzer breaks down your trade history by symbol, day of the week, and hour of entry to identify exactly when your strategies perform best and worst. It ranks every possible trading pattern (e.g., "EURUSD-BUY-Mon-14") by Net Profit, Win Rate, Return/Drawdown, and a Monte Carlo Proxy. More than just an analytics tool, it generates ready-to-use input parameters for your EAs and a crucial "Worst Patterns to Av

Overview NQ 20 Points Scalping Indicator With Alerts is a price-action based trading tool designed to identify high-probability scalping opportunities.
The indicator automatically detects specific market conditions based on a proprietary candle structure. When all conditions are met, a visual signal is displayed on the chart and an alert can be triggered. The objective of the indicator is to help traders identify precise entry opportunities while reducing chart analysis time.
Main Features Aut

SmartTrend AI Scalping Signal Pro
Is a MetaTrader 5 indicator designed to help traders read short-term market direction through smart candle coloring, signal arrows, exit alerts, and a right-side AI Score panel. The indicator uses a SmartTrend 21 baseline to classify market conditions. Candles above the SmartTrend line show bullish conditions, candles below the line show bearish conditions, and gray candles show neutral, touch, or possible exit conditions. The rule-based AI score panel provides

Tired of cluttered charts and moving averages that lag or change every time you switch timeframes? It is time to trade like the institutions. VWAP MT5 Clean Version brings you the ultimate Volume Weighted Average Price indicator, stripped of distracting bands to give you a crystal-clear view of the true market bias. VWAP is the exact tool used by "Big Boys" and institutional traders to detect heavy volume and market equilibrium. Why Choose VWAP Clean Version? 100% Non-Repaint & Multi-Timeframe C

Markov Prime Pro는 다중 심볼 스캐너를 사용하여 원시 신호를 신뢰도 점수가 매겨진 진입점으로 변환합니다. Markov Prime Pro는 단순히 화살표를 그리는 것 이상의 기능을 제공하는 MetaTrader 5용 분석 도구입니다. 모든 신호에 대해 대부분의 지표가 무시하는 질문에 답합니다. "지금 이 진입을 얼마나 신뢰할 수 있습니까?" 각 신호는 0에서 100 사이의 단일 신뢰도 점수(Confidence Score)로 평가되므로 한눈에 강력한 설정과 약한 설정을 구별할 수 있습니다. 이 도구는 6가지 신호 전략, 최근 가격 행동에서 학습하는 확률 모델, 시장 상태 필터 및 내장형 다중 심볼 스캐너를 깔끔하고 끌어서 이동할 수 있는 하나의 패널에 결합합니다. 주요 기능 신뢰도 점수 (0~100). 각 신호는 방향성 확률, 해당 확률의 과거 신뢰도, 시장 체제의 안정성 및 추세 품질을 혼합하여 평가됩니다. 하나의 숫자가 각 화살표 뒤에 숨겨진 무게감을 알려줍니다. 6가지

MT5용 Crypto_Forex 지표 "CCI 속도", 리페인트 없음. - 이 지표는 물리학 방정식을 기반으로 계산됩니다. CCI 속도는 CCI 자체의 1차 미분값입니다. - 상품 채널 지수(CCI)는 현재 가격과 과거 평균 가격의 차이를 측정합니다. - CCI 속도는 주요 추세 방향으로 스캘핑 진입에 유용합니다. 그림과 같이 EMA20 및 EMA50과 같은 적절한 추세 지표와 함께 사용하십시오. - CCI 속도 지표는 CCI 자체의 방향이 얼마나 빨리 변하는지를 보여주며, 매우 민감합니다. - CCI 속도 지표의 값이 0보다 작으면 속도는 음수이고, 0보다 크면 속도는 양수입니다. - 이 지표에는 모바일 및 PC 알림 기능이 내장되어 있습니다. 여기를 클릭하여 고품질 트레이딩 로봇과 지표를 확인하세요! 본 제품은 MQL5 웹사이트에서만 제공되는 정품입니다.

Venom Limit Engine Pro is a non-trading market indicator designed to help traders identify reaction zones, especially on Gold / XAUUSD and the M5 timeframe. The indicator uses a Smart Reaction Zone approach. It analyzes key market areas such as support, resistance, price reaction zones, momentum, candle pressure, and limit entry areas. Instead of giving a simple buy or sell arrow, Venom Limit Engine Pro creates a structured limit zone and waits for price to enter the zone before the setup is con

PRICE Oscillator Most oscillators give you a line. CandleOsc gives you full candlesticks — open, high, low, close — repositioned around a moving average. Zero becomes your reference point: anything above it means price is strong relative to its average, anything below means it's weak. What that changes in practice: you're not just reading a direction, you're seeing the structure of the move. A green candle with a long upper wick, consolidation around zero, a bearish acceleration — information t

Institutional Blueprint (MT5) — Market Structure, Order Blocks & Risk/Reward Zones
Institutional Blueprint reads the chart the way professional price-action traders do. On every closed bar it maps live market structure, marks the Order Block behind each move, and turns the most relevant block into a ready-to-read trade plan with a clear Entry, Stop Loss and three Take-Profit targets — drawn as a green reward zone and a red risk zone, so the trade geometry is obvious at a glance.
Based on Smar

SMC 포용패턴 디텍터 프로페셔널 버전
메타트레이더 5 실시간 캔들 패턴 인식 시스템
제품 개요
SMC 포용패턴 디텍터는 실시간으로 높은 확률의 캔들 패턴을 식별하고 분석하도록 설계된 전문가급 트레이딩 인디케이터입니다. 스마트 머니 컨셉(SMC) 원리와 고전적인 캔들 패턴 분석을 결합하여, 이 인디케이터는 검증된 시장 구조 인식을 기반으로 정확한 진입 신호를 트레이더에게 제공합니다.
M1 시간대에서 스캘핑을 하는 트레이더든, 일일 차트로 스윙 트레이딩을 하는 트레이더든, 이 인디케이터는 세 가지 강력한 패턴을 자동으로 감지합니다: 상승 포용 패턴, 하락 포용 패턴, 세 개의 안쪽 캔들 패턴(위/아래), 그리고 버려진 아기 패턴입니다. 감지된 각 패턴에는 신호의 강도와 신뢰성을 나타내는 신뢰도 점수(0-100%)가 포함됩니다.
핵심 기능
패턴 감지 엔진 인디케이터는 실시간으로 각 캔들을 모니터링하고 다음 패턴을 자동으로 감지합니다:
포용 패턴 (상승 및 하락) 포용 패턴

Liquidity Trap Entry System — 붙이면 바로 거래 가격이 주요 레벨을 돌파해 진입했는데, 곧바로 반전되어 손절을 맞은 적 있나요? 그것이 바로 **유동성 함정(liquidity trap)**입니다. 큰손이 가짜 돌파로 유동성을 모은 뒤 반전시키는 것이죠. 이 지표는 바로 그 시나리오를 감지해, 완성된 매매 계획을 차트에 바로 그려줍니다. 아주 간단 — 3단계 기본 설정 그대로 지표를 차트에 붙입니다. 신호가 즉시 표시됩니다: Entry – SL – TP1→TP4 , 모두 라인으로 표시. 진입. 끝. 복잡한 튜닝 없음. 수십 개의 파라미터도 없음. 붙이면 바로 작동. 신뢰할 수 있는 이유 리페인트 없음(Non-repaint) — 신호는 캔들 마감 시 확정되어 이후 절대 바뀌지 않습니다. 명확한 신호 — 모든 신호는 화살표 하나에 Entry/SL/TP 전체 세트. 모호함이 없습니다. 정의된 리스크 — 모든 거래에 하드 손절. 마틴게일·그리드 없음. 30개 판매마

ICT Institutional Zones Pro — Trade with Institutional Precision Stop wasting time manually drawing key ICT levels every day. ICT Institutional Zones Pro is a professional-grade MT5 indicator built for traders who use ICT (Inner Circle Trader) and Smart Money Concepts (SMC) to read market structure with precision. This indicator automatically maps the most important institutional levels directly on your chart, helping you instantly identify where smart money is likely accumulating, distributing

VibeFox Indicators — 멀티 인디케이터 신호 스캐너 VibeFox Indicators는 고전적인 MetaTrader 5 도구 모음을 마우스로 조작하는 단일 제어 센터로 바꿔 줍니다. 수십 개의 개별 스터디를 첨부하고 설정하고 지켜보는 대신, 컴팩트한 캔버스 기반 패널 하나에서 널리 알려진 14개 인디케이터 를 관리하고, 스캐너가 거래 신호를 차트에 실시간으로 직접 표시하도록 합니다. 작업 공간을 어지럽히지 않으면서 깨끗한 가격 움직임에 신뢰할 수 있는 인디케이터의 확인을 더하고자 하는 트레이더를 위해 만들어졌습니다. 하나의 패널에 담긴 14개 인디케이터 두 줄로 된 선택기를 통해 스캐너가 지원하는 모든 인디케이터에 즉시 접근할 수 있습니다. 각각은 자체적인 독립 설정과 자체 활성화 상태를 유지합니다. 추세 및 오버레이: Moving Average, Ichimoku, Parabolic SAR, Bollinger Bands, Fractals. 모멘텀 및 오실레이터: MAC
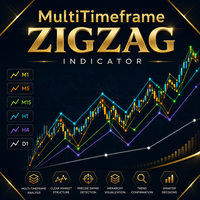
Fast view of market structure across multiple timeframes — always at hand.
Add it to your MT5 library and keep your chart clean. Simple, lightweight and practical — ideal as a supporting tool for daily price action analysis.
Track market structure with speed and clarity. MultiTF Fast Pivot ZigZag helps you identify HH, HL, LH, LL and key higher-timeframe levels without switching charts or cluttering your workspace.

MGH-MultiStoch — Multi-Timeframe Trend Detection and Wave Analysis (MT5) MGH-MultiStoch is a multi-timeframe trend indicator that displays up to 6 timeframes simultaneously in one window. It helps traders confirm trend direction across timeframes, count market waves visually, and build forward-looking wave scenarios based on higher-timeframe crosses. This is the MetaTrader 5 version. Because MT5 supports a wider range of timeframes, this version adds full per-line timeframe selection, so you ca

Most tools shout "BUY NOW" and hope you trust them. DeepTrade Intelligence Suite does the opposite — it hands you the evidence and lets YOU decide. For the current price pattern it answers, in real time, the only questions that matter: - How many times has this exact pattern appeared historically? - What was the success rate? - What was the average move — and the worst reversal? - How strong is this signal, really? - What are the probability scenarios up vs down? Example of what it shows in

Liquidity Order Blocks MT5 Liquidity Order Blocks MT5 is a professional visual indicator for MetaTrader 5 designed to help traders identify and monitor potential bullish and bearish liquidity areas directly on the chart. The indicator detects pivot-based order block zones and displays each zone with a structured visual breakdown of estimated bullish volume, bearish volume, relative strength and delta. Its purpose is to make liquidity areas easier to read, compare and monitor during market analys

Renko Flow Map MT5 Renko Flow Map MT5 is a non-repainting visual indicator that identifies confirmed directional opportunities and converts them into a structured trade map directly on the chart. Each confirmed setup displays its original entry, Stop Loss and three progressive target zones. Signals are generated only after candle close and historical entry arrows remain fixed. Main Features Confirmed BUY and SELL signals Non-repainting historical arrows Entry, Stop Loss, TP1, TP2 and TP3 levels

Dynamic Trend Moving Average for MT5 Dynamic Trend Moving Average is an intelligent moving average indicator designed to help traders instantly identify the current market trend through a simple and intuitive color-coding system. Unlike traditional moving averages, this indicator automatically changes color according to market conditions: Green – Bullish trend detected
Red – Bearish trend detected
Yellow – Neutral market or transition phase This visual approach allows traders to quickly

Spread Recorder — Multi-Symbol Max/Min Dashboard Spread Recorder is a real-time multi-symbol dashboard that continuously monitors live spreads across your entire watchlist and permanently records the maximum and minimum spread ever seen for each symbol — with timestamps. Key features: Monitor 10, 28, 50+ symbols simultaneously from a single customizable text file Auto-adaptive grid layout — the panel automatically resizes its rows and columns to fit however many symbols you load, from a handful

Swap Monitor — Multi-Symbol Buy/Sell Swap Dashboard with Alerts Swap Monitor is a real-time multi-symbol dashboard that displays live SELL and BUY swap rates for your entire watchlist in one compact, color-coded panel — and can alert you the instant any swap rate changes. Key features: Monitor 10, 28, 50+ symbols simultaneously from a single customizable text file Auto-adaptive grid layout — the panel automatically resizes to fit however many symbols you load Displays both SELL and BUY swap valu

Smart Reversal Bands – Professional Trading Indicator for MetaTrader 5
Smart Reversal Bands is a modern and user-friendly trading indicator designed for MetaTrader 5, helping traders identify potential market reversal opportunities through clear and easy-to-understand BUY and SELL signals.
Whether you are an experienced trader or just starting your trading journey, Smart Reversal Bands provides a clean visual trading experience that makes it easier to follow price movements and recognize poten

CyberTradeTHxAI Gold Sniper MT5 Professional Gold Trading Signal Indicator for MetaTrader 5 CyberTradeTHxAI Gold Sniper MT5 is a professional-grade Gold (XAUUSD) trading indicator developed to identify high-probability Buy and Sell opportunities using trend analysis, pullback confirmation, and intelligent market structure detection. Designed for both beginner and advanced traders, the indicator automatically calculates optimal Entry Zones, Stop Loss, and multiple Take Profit levels while provid

Apollo Pips Generator 는 추세의 방향으로 신호를 제공하는 지표입니다. 표시기는 여러 진입점을 제공하므로 항상 이익을 얻을 수 있는 거래 기회를 찾을 수 있습니다. 스크린샷에 주의하세요. 스크린샷은 상단과 하단을 나타내는 별 신호가 있는 채널로 표시되는 다른 도구와 함께 Pips Generator 도구를 보여줍니다. 이 조합은 시스템을 적용할 수 있는 여러 방법을 제공합니다. 구매 후 두 번째 표시기를 무료로 받으려면 저에게 연락하십시오. 스크린샷에 나와 있는 것과 완전히 동일한 시스템을 갖게 될 것입니다. 또한 최상의 결과를 얻기 위해 이 시스템을 사용하는 방법에 대한 지침도 제공합니다. 두 도구 모두 PUSH 알림을 포함한 모든 유형의 경고를 제공합니다. 나는 당신에게 행복한 거래를 기원합니다!

Xau scaper indicator - Advanced Gold Reversal & Trend Scalper Xau scaper indicator is an advanced technical analysis tool designed specifically for traders operating pure scalping strategies on Gold (XAU). Optimized for capturing rapid movements on lower timeframes, this indicator combines two powerful market logics into a single tool: identifying reversal points and clear reading of the underlying trend . Ideal for highly volatile assets like Gold, Xau scaper indicator offers timely signals for

Master Precision Trading with the ICT Macros Time Window Indicator (ICT 매크로 타임 윈도우 지표로 마스터하는 정밀 트레이딩) 금융 시장에서 타이밍은 궁극의 우위입니다. 이너 서클 트레이더(ICT) 방법론을 따르는 트레이더에게 알고리즘이 언제 가격을 움직일지 정확히 아는 것은 가격이 어디로 갈지 아는 것보다 훨씬 중요합니다. ICT Macros Time Window Indicator 는 차트에서 직접 이러한 알고리즘 시간 세그먼트를 추적할 수 있는 필수 도구입니다. 이 도구는 테이프 리딩(Tape Reading, 호가창 및 가격 흐름 세부 분석) 을 마스터하고 폭발적인 알고리즘 시장 움직임이 일어나기 전에 포착하고자 하는 데이트레이더를 위해 특별히 제작되었습니다. ICT Macros Time Window Indicator 사용 방법 이 지표는 런던 및 뉴욕 거래 세션 전반에 걸쳐 특정 매크로 주기를 자동으로 하이라이트합니다. 이

SMC Smart Dashboard and Alerts MT5 is an advanced, lightweight, and non-repainting visual trading assistant designed for traders who follow Smart Money Concepts (SMC) and structural price action. Instead of guessing your next entry, this indicator automatically identifies structural shifts, calculates optimal entry/exit price targets based on your preferred Risk-to-Reward (RR) ratio, and displays everything on a clean, flicker-free real-time dashboard. Core Features & Analytical Logic SMC Struct

MT5 Liquidity Sweeps Indicator
MT5 Liquidity Sweeps Indicator detects buy-side and sell-side liquidity sweeps using swing-based market structure analysis. The indicator supports Wick-Based Sweeps, Break-and-Retest Sweeps, and Combined detection modes while tracking sweep lifecycle states including detected, touched, mitigated, and expired zones. Additional features include configurable mitigation logic, liquidity level visualization, event alerts, swing structure analysis, and historical sweep

Market Temperature Map Market Temperature Map is a visual indicator for MetaTrader 5 designed to show where the current price is positioned within its recent trading range. The indicator transforms this relative price position into a dynamic temperature scale. Cold colors represent prices near the lower part of the range, while hot colors represent prices near the upper part. This provides a fast and intuitive view of market pressure, momentum and potential exhaustion areas. How It Works The ind

Liquidity Magnet Map Liquidity Magnet Map is a visual liquidity analysis indicator for MetaTrader 5. It identifies unswept liquidity pools around confirmed swing highs and swing lows, evaluates their relative importance and highlights the zone currently showing the strongest attraction potential. The indicator combines market structure, proximity, pool maturity, tick volume and momentum alignment into a composite scoring model. Each active zone receives a relative probability percentage, making

ChronoSweep ChronoSweep is a professional market timing and liquidity indicator for MetaTrader 5. It combines key trading sessions, liquidity sweeps, displacement and Fair Value Gaps into a structured visual framework. The indicator focuses on specific intraday windows associated with increased market activity. Instead of filling the chart with unrelated signals, ChronoSweep highlights when price, liquidity and imbalance conditions align during the London and New York sessions. How It Works Chro

Directional Trend Cascade Directional Trend Cascade is a visual trend-following indicator for MetaTrader 5 designed to make market direction and potential trading opportunities easier to identify directly on the chart. The indicator analyzes the alignment of six exponential moving averages and displays them as a coordinated trend cascade. When a new directional alignment is confirmed, the system marks it with a BUY or SELL signal. How It Works A bullish trend is identified when the moving averag

Quarterly Theory Indicator: A Comprehensive Guide for SMC and ICT Traders (분기 이론 지표: SMC 및 ICT 트레이더를 위한 종합 가이드) Quarterly Theory 지표 는 MetaTrader 플랫폼을 위해 설계된 고급 시간 기반 분석 도구입니다. 스마트 머니 컨셉(Smart Money Concepts) 과 인너 서클 트레이더(Inner Circle Trader) 방법론의 핵심 원칙에 뿌리를 둔 이 지표는 금융 시장에서 시간과 가격 전달의 프랙탈 성격을 시각화합니다. 이 지표는 시장이 무작위로 움직이지 않고 엄격한 기계적 시간 주기를 따른다는 알고리즘적 전제하에 작동합니다. 주요 타임프레임을 분기(Quarter)라고 알려진 4개의 동일한 부분으로 나눕니다. 색상으로 구분된 하위 창에 이러한 분기를 플롯함으로써 이 지표는 AMDX 주기 (Accumulation: 축적, Manipulation: 조작, Distributi

Session Volume Profile SMC 는 가격이 어디로 갔는지뿐 아니라 시장이 실제로 어디에서 거래했는지를 보여줍니다. 각 세션(일·주·월)마다 차트에 직접 가로형 볼륨 프로파일을 구성하여, 가장 많은 활동이 몰렸고 이후 가격이 존중하는 경향이 있는 가격 수준을 드러냅니다.
대부분의 차트는 가격만 보여줍니다. Volume Profile 은 빠진 차원, 즉 각 가격에서 얼마나 거래되었는가 를 더합니다. 본 지표는 이를 세션 단위의 명확한 해석으로 바꾸고, 그 위에 Smart Money Concepts(SMC) 시장 구조 관점을 겹쳐, 거래량과 구조를 하나의 도구에서 볼 수 있게 합니다.
무엇을 그리는가
각 세션에 대해 POC (Point of Control, 가장 많이 거래된 가격), VAH 와 VAL (밸류 에어리어 상·하단), 그리고 세션 거래량의 대부분을 담는 음영 처리된 밸류 에어리어 를 포함한 완전한 볼륨 프로파일을 그립니다. 세션이 마감되면 그 POC, VA

First Candle Sessions — LDN & NY MT5 Indicator | M1 to H1 | London and New York Sessions What It Does Automatically marks the High, Low and 50% midpoint of the first 5-minute candle at the opening of the London and New York sessions, creating a clear visual range to trade breakouts every day without any manual work. Buy signal: when a subsequent candle closes above the High of the first candle. Sell signal: when a subsequent candle closes below the Low of the first candle. No signal

Session Liquidity Mapper Session Liquidity Mapper is a professional analytical tool designed to map important liquidity zones in the market. The indicator was developed based on 18 years of observations, research, and practical experience, helping traders view price action from a different perspective. The indicator does not provide BUY or SELL signals. Its primary purpose is to identify important liquidity levels where market participants tend to focus their attention. With Session Liquidity Ma

Adaptive Trend Projection is a MetaTrader 5 indicator designed to help traders visualize the possible continuation of the current market structure. The indicator analyzes recent price behavior using two weighted regression windows: a longer lookback to understand the broader direction and a shorter lookback to capture the most recent movement. It then combines trend slope, recent acceleration, volatility, and ATR-based limits to draw a forward projection for the next candles. The central project

Gann Waves Smart Structure Pro (MT5) Tired of lagging, messy price action indicators that freeze your MetaTrader terminal? Welcome to Gann Waves Smart Structure Pro —the ultimate, high-performance market structure indicator for MetaTrader 5. Built upon authentic W.D. Gann wave-building mechanics, this tool seamlessly maps market swings and automatically flags institutional structural shifts ( CB, TN, GT ) in real-time. Whether you are a Smart Money Concepts (SMC) trader, a Gann enthusiast, or a

Upgrade your technical analysis with a professional, lag-free Pivot and Market Session indicator. Perfect for Day Traders, Scalpers, and Prop Firm users who need precise Support & Resistance zones without cluttering their MetaTrader 5 charts. Key Features: Clean Visuals: Uses exact-length trendlines instead of infinite rays to keep your chart clutter-free. Special Calculation: Uses special calculation to determine the pivot, resistance, and support zones. The accuracy is reliable. Smart Dynamic

ZoneSnap - Fixed Zones + M30 Momentum Confirmation
Stop guessing support and resistance. ZoneSnap automatically draws clean fixed price zones that institutions actually watch.
KEY FEATURES: 1. Fixed $50 / $100 Zones Auto-draws round psychological levels for XAUUSD, EURUSD, GBPUSD. No repaint. No lag. No candle scanning. Perfect for Gold traders who trade $2450, $2500, $2550 etc.
2. **M30 Stochastic Filter** Only get signals when M30 Stoch confirms. This filters out 40% of bad

Breakout Finder ATR detects high-probability breakout and breakdown zones built from repeatedly tested swing highs and lows, then projects ready-to-read Entry / Stop Loss / Take Profit levels calculated from market volatility (ATR). A compact on-chart dashboard keeps you informed of the current trend, the latest signal, and how that signal has played out so far. It works on any symbol and any timeframe and is designed as a clean visual decision-support tool — not a black box. Features Pivot-base

VectorFlow Signal VectorFlow Signal is a professional visual indicator for MetaTrader 5 designed to simplify trend analysis and highlight potential trading opportunities directly on the chart. The indicator uses an adaptive trend engine to detect directional changes and display clear Buy and Sell signals. Each signal is also classified by strength, helping traders quickly decide whether they want a more conservative, balanced or aggressive approach. Signal Strength Rating One of the key features

What if you could finally SEE where the market really wants to go?
Most traders watch price. Pros watch VOLUME — where the money was actually traded. Volume Profile Fibo Confluence puts that reading right in front of you, in plain language, no jargon.
WHAT YOU SEE ON YOUR CHART • The POC, the most-traded price: the market's natural magnet • The value area (VAH / VAL): the "house" where price spends its time • Automatic Fibonacci retracement + the golden pocket • Low-volume nodes

The market speaks a language. This tool translates it for you.
Behind the apparent chaos of candles lies a grammar: structure. Institutions read it, beginners suffer it. Market Structure makes it visible on your chart — and with NO REPAINT.
WHAT THE TOOL DRAWS • The structure zigzag: the real highs and lows, connected • BOS (Break of Structure) : the trend continues • CHoCH (Change of Character) : the structure TURNS, the alert that matters • SWEEP (fake breakout) : a wick tr

ICT Kill Zones marks the four main intraday sessions on your chart and the high and low of each session. It is an analytical tool for traders who follow the ICT and Smart Money approach. It does not place orders and does not give automatic buy or sell signals. It shows when the active sessions occur and where session liquidity rests, so you can make your own trading decisions. Session high and low levels and sweep events are confirmed on closed candles only. Past levels are not redrawn. The MT

MetaTrader stops at the minute. You'll see by the SECOND.
MT5 offers no chart below M1. That's a real gap for scalpers. Tick Candles fills it: from the real tick flow, it builds a mini candle chart of 1, 5 or 10 seconds, overlaid on your screen. The TradingView view, inside MT5.
️ WHAT YOU SEE • A seconds-candle frame, refreshed several times per second • The direction of the current candle (up / down / flat) • The delta of the last seconds + speed in ticks/s = the market's PULSE (

Not all hours are equal in trading.
The same setup isn't worth the same at 3am and at the New York open. Trading Sessions colors the three major market sessions right on your candles, so you know at a glance WHEN you're trading.
WHAT YOU SEE • Colored zones Asia / London / New York , laid over price • Asian High / Asian Low: the Asian range edges, so often hunted by London and New York before the real move • A clock panel: the active session, live
WHY IT MATTERS T

The trend, finally obvious. Even for a complete beginner.
Four moving averages, one instant reading. EMA Ribbon turns a complicated calculation into a color you understand in one second.
WHAT YOU SEE • A ribbon of 4 EMAs, fastest to slowest • Green = clear uptrend • Red = clear downtrend • Gray = no trend, the market hesitates → stand aside • A panel writes the verdict in plain words
THE IDEA When the averages are neatly stacked and spread, the trend is clear. When they tang

The Dynamic Market Profile allows you to analyze the volume of any specific chart region manually and instantly. No more being restricted to fixed daily or weekly profiles: you choose the exact move, consolidation, or trend leg you want to analyze . The indicator lets you draw up to 5 independent areas at the same time using interactive rectangles . How It Works on a Daily Basis Create the zone: Press keys 1, 2, 3, 4, or 5 on your keyboard (or use the on-screen buttons) to plot a rectangle . A

VibeFox Volume Profile — MetaTrader 5용 Volume Profile VibeFox Volume Profile는 MetaTrader 5를 위한 완전한 Volume Profile 도구 모음입니다. 거래된 거래량을 가격에 따라 수평으로 분포시켜 그려내므로, 시장이 가장 많은 활동을 보인 곳, 거래가 얇았던 곳, 그리고 어떤 가격 수준이 자석이나 장벽처럼 작용할 가능성이 높은지를 즉시 확인할 수 있습니다. 모든 프로파일은 차트 위에 직접 그려지며, 현대적이고 마우스로 조작하는 패널에서 제어됩니다 — 뒤져야 할 메뉴도, 첨부할 스크립트도 없습니다. 캔들만으로 지지와 저항을 추측하는 대신, 거래량의 실제 발자취로 작업합니다. 가격을 끌어당기는 고거래량 노드, 가격이 흔히 빠르게 통과하는 저거래량 간극, 그리고 대부분의 거래가 이루어진 공정 가치 구역입니다. 필요한 방식 그대로의 Volume Profile Volume Profile는 하나의 고정된 프로파일이 아닙니다

Candle Clock All Timeframes — Real-Time Countdown MT5 Indicator | M1 to Monthly | Updates every second What It Does Displays a real-time countdown timer next to the current candle showing exactly how many minutes and seconds remain before the candle closes. The timer updates every second automatically and works on all timeframes from M1 to Monthly without any manual intervention. Position: the timer always appears next to the active candle on the right side of the chart. Updates: ev
트레이딩 전략과 기술 지표를 판매하기에 가장 좋은 장소가 왜 MetaTrader 마켓인지 알고 계십니까? 광고나 소프트웨어 보호가 필요 없고, 지불 문제도 없습니다. 모든 것이 MetaTrader 마켓에서 제공됩니다.
