YouTube'dan Mağaza ile ilgili eğitici videoları izleyin
Bir ticaret robotu veya gösterge nasıl satın alınır?
Uzman Danışmanınızı
sanal sunucuda çalıştırın
sanal sunucuda çalıştırın
Satın almadan önce göstergeyi/ticaret robotunu test edin
Mağazada kazanç sağlamak ister misiniz?
Satış için bir ürün nasıl sunulur?
MetaTrader 5 için yeni teknik göstergeler - 14

SDivergence Göstergesi, MACD ve Stokastik (şimdilik) için düzenli sapmaları ve gizli sapmaları hesaplar ve gösterir. Bu göstergenin yararı, çoklu giriş değişkenleridir. Bu girişleri kullanarak, stratejinize daha uyarlanabilir RD ve HD'ler elde etmek için değişiklik yapabilirsiniz.
Rehber :
1- Önce istediğiniz osilatörü (MACD veya Stokastik veya Her İkisi) grafiğe koyun.
2- SDivergence göstergesini çalıştırın ve SDivergence giriş penceresine daha önce koyduğunuz osilatörün karşılık gelen a
FREE

Pack Volatility 75 1/3 In this indicator stage 1 I am pleased to present you the volatility 75 Buy/Sell Professional indicator. where in each temporary structure it will mark a sale and a safe purchase to operate manually, where the strategy is based on the lines EMA of 7 exponential periods and the EMA of 50 exponential periods. where purchasing a product comes 2 as a gift (it's the pack) purchasing any of the 3 products will be sent the remaining indicators, to be able to apply the strategy we
On this occasion I am pleased to present the (Boom 300 Professional Pack) where it consists of 4 indicators for the Boom 300 index of synthetic indices (Deriv Broker) Acquiring this indicator enables you the pack of the 4 boom 300 indicators where the rest of the indicators will be sent, This indicator is 1 of the 4 that includes the Buy/Sell strategy, sending you clear alerts where there buy or sell the pair It is recommended to use in a period of 15 minutes, to have a greater profit since the

Minimalist style BB indicator fully filled with a single color. Indicator type: Technical Indicator You are too confused with the complicated zigzag lines in the BB indicator, especially when your strategy has many indicators combined, it looks like a mess and we will no longer see any candlesticks on the chart for technical analysis s. This indicator was born to solve that. See more: Conversion tradingview indicator collection | Minimalist Price Action Strategy | Subscribe It is design
FREE

The indicator is based on the concept of price channels, which are formed by plotting the highest high and lowest low prices over a specified period of time. The Donchian Channel Indicator consists of three lines: an upper channel line, a lower channel line, and a middle channel line. The upper channel line represents the highest high over a specified period, while the lower channel line represents the lowest low. The middle channel line is the average of the two and can be used as a reference f
FREE
To get access to MT4 version please click here . This is the exact conversion from TradingView:"HIGH AND LOW Optimized Trend TrackerHL OTT" by "kivancozbilgic" This is a light-load processing indicator. It is a non-repaint indicator. All input options are available. Buffers are available for processing in EAs. You can message in private chat for further changes you need. Thanks.

It is one of the famous indicator in TradingView platform. Supertrend indicator shows the trend of the market intuitively . You can use it for understanding the trend or get insight about the market.
------- Value & Color -------- You can change the colour (line, filled). Default value is the same as Tradingview Supertrend default value ( period 10, ATR multiplier 3.0)

Grafiğinizde otomatik olarak destek ve direnç seviyeleri PLUS itici mum boşlukları çizin, böylece fiyatın nereye gidebileceğini ve / veya potansiyel olarak tersine dönebileceğini görebilirsiniz.
Bu gösterge, web sitemde (The Market Structure Trader) öğretilen pozisyon ticareti metodolojisinin bir parçası olarak kullanılmak üzere tasarlanmıştır ve hedefleme ve potansiyel girişler için temel bilgileri görüntüler. MT4 Version: https://www.mql5.com/en/market/product/97246/ Göstergede 2 TEMEL öze

Trend Chief è un algoritmo indicatore avanzato che filtra il rumore del mercato, determina la tendenza, i punti di ingresso e i possibili livelli di uscita. Usa intervalli di tempo più brevi per lo scalping e intervalli di tempo più lunghi per lo swing trading. Trend Chief è perfetto per tutti i simboli Metatrader: valute, metalli, criptovalute, azioni e indici * Come utilizzare l'indicatore Trend Chief: - Ottieni la tendenza principale guardando i grafici giornalieri e H4 - Se la tendenza è al

Boom and crash Gold Miner v2 trend histogram which works in conjunction with the indicator above that has arrows as shown in the video. PLEASE Note: That the top indicator and the bottom indicator are two separate indicators. the top indicator is https://www.mql5.com/en/market/product/98066 the bottom one is free. which is the histogram at the bottom. the trend histogram trading tool that helps to easy detect the trend blue color indicates an uptrend. Orange color is a down trend.
FREE
JPYTraderSR is a simple support and resistance indicator with Fibonacci retracement and extension levels added to provide even more trade signal confluence. It provides extra confirmations by indicating support and resistance levels shaping the market structure at any given time, in relation to harmonic trade concepts facilitated by Fibonacci ratios. The JPYTrader Expert Advisor (v1.0) utilizes an older version of this indicator (v1.0), which in turn leads to fairly accurate price action retrace

Jackson Support and Resistance it a powerful advance support and resistance indicator which provide signal base on price action, it Design to make things easy for everyone to draw support and resistance. we believe most strategies are built with support and resistance as a foundation .Having support and resistance perfect can be a game change to you way of trading. It flexible to all instrument .don't forget to watch our video on how to us this indicator prefect and progressive.
FREE
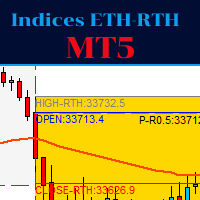
This indicator is for trading indices.
The RTH sessions (regular trading hours) where the underlying cash market is open are distinguished from ETH: for example for the American indices from 9:30 to 16:15 East Coast (New York) time, while for the Dax from 09:00 to 17:35 CET.
For the ETH session (outside RTH) the Fibonacci levels are plotted, as well as sensitive levels such as 25,50,75% retracement from the minimums and maximums.
Also for the RTH session the Fibonacci levels are graphed,
The fate of a trade depends on knowing the direction of the price trend. Whatever style you trade, you must know that the direction of the main market trend is in the hands of buyers or sell
YZD Trend indicator helps you to find the main direction by using mathematical parameters and ATR This indicator is a good supplement for your strategy, especially price action, which can reduce your trade losses.
How to use: YZD Trend indicator consists of two ranges in the form of bands, when th

Market Heartbeat is in your hand! Introduction The Market Heartbeat indicator with a special enhanced algorithm (volume, money flow, cycle of market and a secret value) is a very repetitive trend finder with a high success rate . Interestingly, this Winner indicator indicates that the trend has changed its direction or the end of a trend retracement or even appears at the range market. The Market Heartbeat can use in scalping trading or trend trading. It finds immediately with alarm, notificatio

To get access to MT4 version please click here . This is the exact conversion from TradingView: "Hammer & ShootingStar Candle Detector" by "MoriFX". This is a light-load processing and non-repaint indicator. All input options are available. Buffers are available for processing in EAs. You can message in private chat for further changes you need. Thanks.
FREE
--- StudentK RVI --- 1. Advanced strategy based on RVI 2. EA adapted (especially for StudentK's EA)
--- Context --- StudentK is not indicated as a master or K Sir for knowledgeable person who claims for winning all the time. (But lots of traders should know the fact that it is rarely truth, especially in fluctuated period of time)
StudentK is a group of years-experienced traders who want to share amazing tools in Free and Paid versions. Aiming helping people getting out of "The Rat Race" by
--- StudentK CCI --- 1. Advanced strategy based on CCI 2. EA adapted (especially for StudentK's EA)
--- Context --- StudentK is not indicated as a master or K Sir for knowledgeable person who claims for winning all the time. (But lots of traders should know the fact that it is rarely truth, especially in fluctuated period of time)
StudentK is a group of years-experienced traders who want to share amazing tools in Free and Paid versions. Aiming helping people getting out of "The Rat Race" by
--- StudentK MACD --- 1. Advanced strategy based on MACD 2. EA adapted (especially for StudentK's EA)
--- Context --- StudentK is not indicated as a master or K Sir for knowledgeable person who claims for winning all the time. (But lots of traders should know the fact that it is rarely truth, especially in fluctuated period of time)
StudentK is a group of years-experienced traders who want to share amazing tools in Free and Paid versions. Aiming helping people getting out of "The Rat Race"
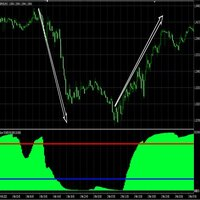
Absolute High Low indicator is a discretionary tool for assessing extremes in the price. It is very self-explanatory, and you can test against other default oscillators to see the difference. Combine with your trend following systems to master entry and exit at extremes. Back test and study the indicator to see the results up against a system or indicator. The indicator calculates a number of max bars so a gap will appear at the end, and it will restart. MT4 Version: https://www.mql5.com/e
Market Viewer gives a quick glance on correlation and direction. This indicator takes a list of symbols (max 8) Leave a symbol setting empty if you wish not to use that many - like in the defaults… It will check for each timeframe (Monthly, Weekly, Daily, H4, H1, 30min, 15min, 5min and 1min) if the current candle on that timeframe is bullish or bearish. This will give a good indication of the direction for us to trade in. We need to be in sync with the bigger timeframes.
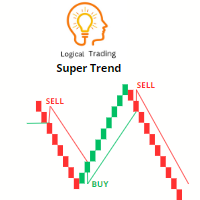
Süper Trend göstergesi, tüccarların trendin yönünü ve piyasada potansiyel giriş ve çıkış noktalarını belirlemek için kullandığı popüler bir teknik analiz aracıdır. Fiyat hareketine ve volatiliteye dayalı olarak sinyaller sağlayan bir trend takip göstergesidir.
Süper Trend göstergesi, boğa trendini gösteren bir çizgi (genellikle yeşil renkte) ve ayı trendini gösteren bir çizgi (genellikle kırmızı renkte) olmak üzere iki çizgiden oluşur. Çizgiler, trendin yönüne bağlı olarak fiyat grafiğinin üz
FREE

Ticaretinizi bir sonraki seviyeye taşımak için güçlü bir gösterge mi arıyorsunuz? MQL5'teki Göreceli Güç Endeksi (RSI), Hareketli Ortalama ve Heiken-Ashi göstergelerinin en iyilerini birleştiren benzersiz RSI tabanlı göstergemizden başka bir yere bakmanıza gerek yok.
Göstergemiz, herhangi bir gecikme olmadan gerçek zamanlı veriler sunarak, bilinçli alım satım kararlarını güvenle vermenize olanak tanır. Yeni başlayanlardan uzmanlara kadar her seviyeden tacir için mükemmeldir.
Özelleştirilebi

Güçlü NRTR (Nick Rypock Trailing Reverse) göstergesini tanıtmaktan gurur duyuyoruz - eğilim değişimlerini belirlemeyi ve etkili takip eden stop seviyeleri belirlemeyi hedefleyen tüm tüccarlar için vazgeçilmez bir teknik araç. Nick Rypock tarafından geliştirilen bu gösterge, piyasa koşullarının sürekli değişimine uyum sağlayan benzersiz bir algoritmaya sahip olması nedeniyle, her tüccarın cephaneliğine değerli bir ek katmaktadır.
İşte tüccarların bu göstergeyi kullanırken en yaygın iki yol:
FREE

Gösterge, teknik olarak psikolojik destek/direnç çizgileri olan fraktal çizgileri hesaplar. Aslında bunlar, belirli bir süre boyunca fiyatın en yüksek ve en düşük seviyeleridir. Gösterge tüm grafiklerde ve zaman dilimlerinde çalışır. Ayarlar: Fractal Candels - temelinde bir fraktalın oluşturulduğu mum çubuklarının sayısı. Psikolojik fiyatın hesaplanabileceği maksimum/minimum değeri hesaplar Rigth Candels - yanlış fraktalların sağına doğru filtrelendiği mum sayısı Left Candels - yanlış fraktallar

Boom and Crash Gold miner v2 Trading indicator based on market momentum works on m1 for boom and crash 1000 and M5 time frame for normal trading pairs wait for blue arrow to appear plus change of candle stick color and candlesticks must be above the 2 modified moving averages then you can buy the market. wait for orange arrow to appear plus change of candle stick color and candlesticks must be below the 2 modified moving averages then you can sell the market.

Indicator introduction: A channel and trend line indicator, which is a good tool for manual trading, and also can be used for creating new EAs, without drifting or repainting. It applies to any timeframes and any symbols. The work of the indicator is shown in the screenshots. For any novice and programming trading friend, you can write the signal into the EA to play freely, buffer 0 corresponds to the bold trend line, buffer 4 and 5 respectively corresponds to the channel's upper and lower f
Introducing our groundbreaking Forex indicator, specifically designed to help traders master the art of identifying critical support and resistance zones, as well as double top and double bottom patterns with unprecedented accuracy. Say goodbye to guesswork and hello to a powerful tool that will revolutionize your trading experience. Our proprietary indicator leverages cutting-edge technology to recognize key price levels where buying and selling pressures are poised to shift the market dynamics

Very simple, yet powerful, indicator that helps you get notified every time a candle touches your trend line, horizontal line, and/or your rectangular. Powerful indicator yet very simple to use! All you need to do is draw your MT5 trend lines, horizontal lines, and/or rectangles and SmartLine takes care of notifying you the moment the current price touches one of your key levels! No brainer If you like the indicator, please leave a review and share the tool with your peers. WARNING: Please use t
FREE

--- StudentK Sync Chart --- 1. Move charts at the same time 2. Cross check among different Symbols and Timeframes 3. Plan your own trading strategies
--- Context --- StudentK is not indicated as a master or K Sir for knowledgeable person who claims for winning all the time. (But lots of traders should know the fact that it is rarely truth, especially in fluctuated period of time)
StudentK is a group of years-experienced traders who want to share amazing tools in Free and Paid versions. Aimi

--- StudentK Sync Chart --- 1. Move charts at the same time 2. Cross check among different Symbols and Timeframes 3. Plan your own trading strategies
=== Simple (Free) Version ===
1. Allow USDJPY only
2. Support M5 and M15
3. * Contact StudentK for unlocking all timeframes *
--- Context --- StudentK is not indicated as a master or K Sir for knowledgeable person who claims for winning all the time. (But lots of traders should know the fact that it is rarely truth, especially in fluctuat
FREE
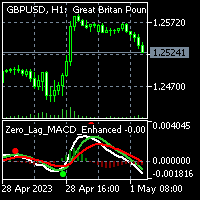
To get access to MT4 version please click here . This is the exact conversion from TradingView: "Zero Lag MACD Enhanced - Version 1.2" by " Albert.Callisto ". This is a light-load processing and non-repaint indicator. All input options are available. Buffers are available for processing in EAs. You can message in private chat for further changes you need. Thanks

Nadaraya-Watson Envelope Indicator convert to MT5 Nadaraya Watson Envelope Indicator is one of the monst popular indicator in TradingView. TradingView(Chrome, Edge) eats a huge of CPU, so I convert this to MT5 version.
As you can see the screenshot, it's good with Schaff trend RSI Indicator (or others) If you want to get Schaff trend RSI Indicator , Link: https://www.mql5.com/en/market/product/98011
Window Size - determines the window size for calculating smoothed values. A larger window

There are many linear regression indicators out there, most of them draw lines or channels, but this one actually draws a chart. The beauty of the indicator like Heiken Ashi is it removes a lot of market noise. 4 (OHLC) arrays are filled with Linear Regression(LR) values of each price for the LR period (default=14). The period of the Linear Regression is adjustable dependant on the market conditions. The SMA (default=14) also has period adjustment. Candles are generated with Green for 'Up' cand
Schaff trend RSI indicator (It is related with EMA and RSI) It is suited for sub-Indicator to undertand trend(or direction change)
As you can see the screenshot, it's good with Nagaraya-Watson Envelope Indicator (or others) I am using this indicator as Screenshot setting. (Schaff value is default value. 23, 50, 9, close) If you want to get Nagaraya-Watson Envelope, Link: https://www.mql5.com/ko/market/product/97965

The Super Trend is one of the best trend-following indicator for MT5 platforms. It's working fine for real-time trend alerts and accurate signals and it help to identify the best market entry and exit positions. This indicator is the tool you can refers to a trend following overlays. It contains two major parameters: the period and the multiplier. Besides, traders should consider default values that include 10 for every true range aтd 3 for the multiplier. 2 Types TP SL you set in input Point

The Off Trend MT5 Forex Indicator is a trend-following tool. Its signals are presented in the cloud. When the cloud is green, the trend momentum is bullish, and traders should take buy opportunities. Conversely, the trend momentum is bearish when the cloud is pink, and traders should take sell opportunities. The Off Trend mt5 Forex Indicator fits all timeframes and mt4 currency pairs.
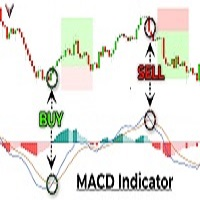
The MACD Gold Scalping Indicator is a powerful tool designed to help traders like you extract profits from the gold market. This indicator is based on the popular Moving Average Convergence Divergence (MACD) indicator, but it's been customized specifically for trading gold. When you use this indicator, you'll be able to quickly identify key entry and exit points in the gold market. It uses a combination of trend analysis, momentum indicators, and support and resistance levels to generate highly
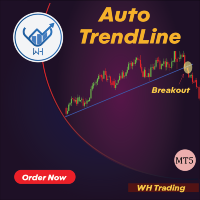
Grafiklerinizde trend çizgileri çizme sürecini otomatikleştiren yenilikçi MT5 göstergesi Auto Trendline ile tanışın. Manüel olarak trend çizgileri çizmenin sıkıcı ve zaman alan işine elveda deyin
ve Auto Trendline'ın işi sizin için yapmasına izin verin!
* Size talimatları ve adım adım kılavuzu göndermek için satın aldıktan sonra benimle iletişime geçin . Gelişmiş algoritması ile Otomatik Trend Çizgisi sizin için trend çizgilerini otomatik olarak algılar ve çizerek
zamandan ve emekten

Market Structure Patterns is an indicator based on smart money concepts that displays SMC/ICT elements that can take your trading decisions to the next level. Take advantage of the alerts , push notifications and email messages to keep informed from when an element is formed on the chart, the price crosses a level and/or enters in a box/zone. Developers can access the values of the elements of the indicator using the global variables what allows the automation of trading

Gösterge Giriş Gösterge, RSI veya CCI'dan daha kararlı ve daha az gecikmeli olan hareketli ortalama formüllerine göre tasarlanmıştır. Göstergenin üç gösterge değeri vardır, hareketli ortalama periyodu ve çizginin renkleri manuel olarak değiştirilebilir. Bu gösterge size ne getirebilir? Doğru giriş sinyalleri: Gösterge, yukarı ve aşağı ok sinyallerini çizer. Çok dönemli trend analizi: Bu göstergeyi büyük bir zaman çizelgesi tablosuna ve küçük bir zaman çizelgesi grafiğine yüklemek, onu kulla

Trendleri analiz etme ve işlem fikirleri için Demark Trends göstergesinin gücünü keşfedin. Demark göstergeleri, piyasa trendlerini ve tükenme noktalarını değerlendirmedeki etkinlikleriyle tanınır. Bizim Demark Trends göstergemiz bu deneyimi bir üst seviyeye taşıyarak grafiklerinizde otomatik olarak kesin trend çizgileri çizer. Mum sayısı, alarm ayarları ve çizgi renkleri de dahil olmak üzere özelleştirilebilir parametrelerle analizinizi tam kontrol altında tutabilirsiniz. Hem yeni başlayanlar he
FREE

MT5 için uyarılar içeren Otomatik Sabit Aralık Hacim Profili
Bu gösterge, fiyatın nerede daha fazla zaman harcadığını gösterir ve ticarette kullanılabilecek önemli seviyeleri vurgular.
ve belirli bir ticaret seansının en önemli fiyat seviyelerini, değer alanını ve kontrol değerini özetleyerek zaman içindeki fiyat yoğunluğunu gösterebilir. Bu gösterge, M1 ile D1 arasındaki zaman dilimlerine eklenebilir ve günlük, haftalık, aylık ve hatta gün içi oturumlar için Piyasa Profilini gösterir. Daha

Oluşturulacak mum sayısını belirleme özelliğine sahip Standart Bill Williams Fraktallar Göstergesi. Gösterge tüm grafiklerde ve zaman dilimlerinde çalışır.
Ayarlar: candles -fraktalın dayandığı sol ve sağ mum sayısı (klasik bir göstergede bu değer her zaman 2'dir)
İletişim: Herhangi bir sorunuz varsa veya yardıma ihtiyacınız varsa, lütfen özel mesaj yoluyla benimle iletişime geçin. Автор: Fertikov Serhii, Göstergelerimin, danışmanlarımın, komut dosyalarımın daha fazlası satıcı profilinde
FREE

The UT Bot Alert Indicator is an advanced technical analysis tool designed to help traders optimize their trading performance. This innovative indicator is based on the proven UT Bot system, which utilizes multiple indicators to deliver accurate signals that can help traders make better decisions. The UT Bot Alert Indicator provides a range of features that can help you stay on top of market trends and capitalize on opportunities. Here are some of its key functionalities: Trend Analysis: The UT
FREE

Gold TL MTF - this is a fine stock technical indicator. The indicator algorithm analyzes the movement of the asset price and reflects trend lines along the fractals of a specific timeframe (TF).
Benefits of the indicator: The indicator produces signals with high accuracy. The confirmed signal of the indicator does not disappear and is not redrawn. You can trade on the MetaTrader 5 trading platform of any broker. You can trade any assets (currencies, metals, cryptocurrencies, stocks, indices
FREE

Adaptive Moving Average (AMA) is a trend indicator using moving average and market noise filter. Indicator feature are blue and red points, showing the power of trend. Recommendations for trading: Auxiliary Indicator Detecting trend Detecting power of trend Detecting potential reversal points Main indicator Shows entry points for swing trading Serves as dynamic support and resistance Recommendations for use: Any instrument Any timeframe Input parameters: Period - AMA period Fast Period - fast MA
FREE

Supply and Demand Indicator + FREE Currency Strength Meter ADD-ON Looking for a powerful tool that can help you identify the most reactive zones in the forex market? Our supply and demand indicator for MetaTrader 4 and 5 is exactly what you need. With its advanced algorithms and real-time analysis, this indicator helps traders of all experience levels make informed trading decisions. The supply and demand indicator is a cutting-edge tool that helps traders identify areas where buyers and sellers

The best instrument for scalping. It allows you to always be correctly positioned in the price. It's a simple and extraordinarily powerful visual reference. Very suitable for price action. It consists of four components. 1. Fork. There are two levels that surround the price and mark the rebound points. They can be varied independently with 4 associated controls, two for each level. Its amplitude is indicated in pips in the indicator data. The minimum fork is updated with each tick. It has
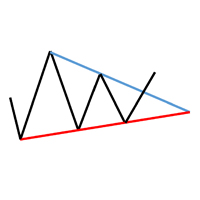
The TrianglesPro indicator for MetaTrader5 draws triangles on the chart based on the local highs and lows. The length of the trendlines can be limited. Optionally, you can display the highs and lows that are used to determine the triangles. It is also possible to determine how far back the identification of triangles should start. Also check out my other indicators.
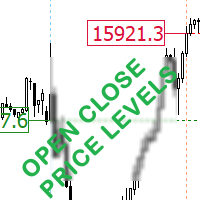
This indicator displays the open and closing price for the selected number of days. Easily identify market open and close Gaps. Select the Day icon to show the open and closing price line. Select the Time icon to show the open and closing hours. Indices and stocks are not a 24hour market as shown on MT5 charts, they open and close at specific times. Marketplace
Time Zone
Trading Hours
New York Stock Exchange (NYSE)
EDT
9:30 a.m. to 4:00 p.m.
Nasdaq Stock Market
EDT
9:30 a.m. to 4

The TTM Squeeze is a trading strategy developed by John Carter of Trade the Markets that uses the combination of Bollinger Bands and Keltner Channels to identify periods of low volatility, followed by periods of high volatility. The strategy is based on the principle that low volatility periods are typically followed by high volatility periods and is used to identify potential trading opportunities. When the Bollinger Bands move inside the Keltner Channels, it is referred to as a squeeze, and i
FREE

You may find this indicator helpfull if you are following a session based strategy. The bars are colored according to the sessions. Everything is customisable.
Settings: + Asia Session: zime, color, high, low + London Session: zime, color, high, low + US Session: zime, color, high, low
Please feel free to comment if you wish a feature and/or give a review. Thanks.
FREE

A pivot point is an intraday technical indicator used to identify trends and reversals mainly in equities, commodities, and forex markets . Pivot points are calculated to determine levels in which the sentiment of the market could change from bullish to bearish, and vice-versa.
the swing daily is an advanced pivot points indicator that grants the user control over many aspects of the trading levels that you'll get familiar with in the controls section it's used mainly to locate intraday

Imbalance / FVG MTF Mark Imbalance on chart of Selected Multi Time frames. Trend is Manually set to filter signals in the chosen direction by a button on the chart. .
Futures Auto Mark Imbalance / FVG on chart on selected time frames
Select time frames by buttons on chart
Popup Alert, Push Notification or email when New Imbalance Form
Popup Alert, Push Notification or email when Imbalance is Taken out
Select Alert Mode to be a single or multiple Imbalance ( OR / AND option ) when Imbalan

Bu, dört seans boyunca tüm seviyeleri (Açık-Yüksek-Düşük-Kapanış) görüntüleyebilen işlem seanslarının bir göstergesidir. Gösterge aynı zamanda oturum düzeylerini de tahmin edebilir. Oturumlar çizgiler veya dikdörtgenler (boş veya dolu) ile çizilebilir, çizgiler bir sonraki oturuma uzatılabilir. Kısayol tuşlarına (varsayılan olarak '1', '2', '3', '4') basarak her oturumu kolayca gizleyebilir/gösterebilirsiniz.
ASR (Ortalama Oturum Aralığı) satırlarını görebilirsiniz (varsayılan kısayol tuşu

Versus USD, her bir ana para biriminin USD karşısındaki fiyat değişimini hesaplar ve grafikteki her çubuk ya da periyot, imleç tarafından belirlenen mevcut zaman diliminde performanslarının net ve karşılaştırmalı bir görünümünü, ilerleme çubukları ile gösterir. Ek olarak, diğer para birimlerine karşı USD'ye karşı en yüksek veya en düşük fiyat değişimini yaşadığı çubuk/dönemde, söz konusu para biriminin performansının daha hassas bir ölçüsünü sağlamak için bir ok işareti ile işaretler

50% Off Today Only! Price Goes Back Up at 11 PM (EST)
uGenesys Volume Indicator: Your Key to Mastering Market Volume Analysis What Traders Are Saying: "A must-have indicator...really a game-changer." – wuzzy66 "Amazing indicator...strongly recommend to beginners." – joinbehar Understanding Market Volume: Volume in the market is a critical indicator of movement and opportunity. The uGenesys Volume Indicator is specially crafted to pinpoint when the market has the most volume, allowing you t

Introducing our A.I Currency Strength Meter Forex Indicator, a state-of-the-art tool designed to provide forex traders with real-time insights into the strength of various currencies. Leveraging the latest advancements in artificial intelligence and machine learning, this innovative indicator analyzes market data in real-time, providing users with accurate and up-to-date information to inform their trading decisions. In addition to its cutting-edge algorithms, the Currency Strength Meter For
Add an image or logo on a chart. Parameters: "File name for On mode" - location of image file depending MQL5 folder. "Background object" - set the logo as a background object. “x”, “y” – coordinates on the chart, from which the logo shows. If you want to delete the logo, just remove ea from the chart. The suggested resolution for the image is 200x200 pixels. You can use this ea while recording a video.
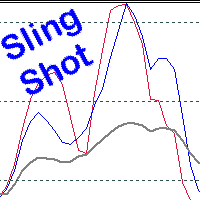
Scalping, Mean reversion or Position trading strategy
Get into an established trend on a pullback in the market. Use the Pinch in the indicator for profit taking. Use the Pinch as a mean reversion strategy, scalping back to a moving average line.
Input Parameters Fast Sling Shot configuration. Slow Sling Shot configuration. Dual Sling Shot configuration. Price line configuration. Trigger zones or levels. Example of Sling Shot trade idea: Price line sets the mood, below the baseline level (5
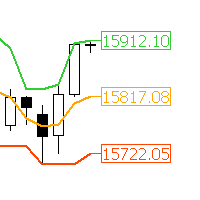
"AV Donchian Channel MT5" is an indicator for MetaTrader 5, which shows the current prices of the donchian channels and the middle line.
Multiple AV Donchian Channel indicators can be placed on one chart. The center line can be used for trailing.
See also Richard Dennis Turtle Trader strategy.
Settings:
- Donchian Channel Period
- Colors and widths of the lines
- Colors and widths of price labels
Please report bugs to me.

Simple ATR (Average True Range) Channel to find your Stop Loss and/or Take Profit. Indicator allows to draw a second multiplier if you need different values for SL and TP. Leave the second multiplier to 0 if not used.
Settings + Length
+ Smoothing
+ Multiplier #1 (default 1.5)
+ Multiplier #2 (set to 0 if not used)
+ High price
+ Low price
+ show price line
+ colors can be changed
Please leave wishes in the comments. Reviews are also welcome.
FREE

HighQualityMap是一个很好的中长线交易指示器,这个指标可以单独使用,尤其是用在M30或者大于M30的时间框架下,它能很好的体现出趋势的走向,以及转折点,你可以很快的从这个指示器上寻找到最佳的buy和sell位置,同时也能很好根据指示器去坚守自己的持仓定订单。指标不含有未来函数,不会重新绘制,不仅能够应用到自己的手动交易过程中,还能完全可以写入到自己的EA中。(如果你感觉到这个指标能够帮助你进行更准确的交易,请帮忙给个好评,希望我的作品能够帮助更多有需要的人) ===================参数列表===================== 所有参数均采用默认参数即可,无需更改,若为激进型交易者,可以根据自己的需要来调整参数。 =================参考使用方法=================== 此指标可以适用于任何交易品种,使用周期框架大于M30相对更准确。

This Indicator is based on Mr. Dan Valcu ideas.
Bodies of candles(open-close) are the main component used to indicate and assess trend direction, strength, and reversals.
The indicator measures difference between Heikin Ashi close and open.
Measuring the height of candle bodies leads to extreme values that point to trend slowdowns. Thus quantifies Heikin Ashi to get earlier signals.
I used this indicator on Heiken Ashi charts but, it's possible to choose to calculate Body size based on
FREE
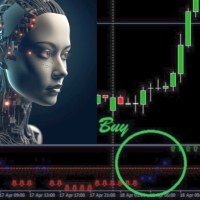
Introducing Trend Fusion 444F, a powerful MQL4 indicator designed to determine market direction using multiple trading indicators. This comprehensive tool offers a unique fusion of technical analysis techniques that help traders make informed decisions in various market conditions. Key Features: Comprehensive Analysis: Trend Fusion 444F combines several widely-used trading indicators to provide a multi-dimensional view of the market. The indicators include Moving Averages, MACD, RSI, DeMarker,

INTRODUCTION The Fib Autotrendline is a basic tool that analysts use to find out when a security's trend is reversing. By determining the support and resistance areas , it helps to identify significant changes in price while filtering out short-term fluctuations, thus eliminating the noise of everyday market conditions. It is an excellent tool for any trader who follows indicators that use swing highs and swing lows . How to Use the fib Auto Trendline Indicator The Fib Auto Trendline

Bu, zirveleri ve dipleri değerlendirmek için net bir göstergedir ve Salınımlı piyasa için iyi çalışır.
Promosyon fiyatı 49$ → 59$
özellikler üstleri ve dipleri yargılamada iyi Yeniden çizme yok, sürüklenme yok Hızlı hesaplama, gecikme yok Zengin hatırlatma modu Birden fazla parametre ve renk ayarlanabilir
parametre "======== Ana ========" YüksekDüşükDönem1 = 9 YüksekDüşükPeriyod2 = 60 YüksekDüşükPeriyod3 = 34 YüksekDüşükEMAPeriyodu = 4 MASignalPeriod = 5 "======== Bildir ========" UseAler

"BIG FIGURE INDICATOR", otomatik olarak fiyat grafiklerindeki belirli seviyelerde yatay çizgiler tanımlar ve çizer; örneğin, bütün sayılar veya yarım sayılar gibi (örneğin, para birimi işlemlerinde 1.0000 veya 1.5000). Bu seviyeler, büyük tüccarların ve yatırımcıların odaklanabileceği yuvarlak sayıları temsil ettikleri için psikolojik olarak önemli kabul edilir ve potansiyel destek veya direnç seviyelerine yol açabilir. Büyük rakam göstergesi, tüccarların önemli fiyat seviyelerini belirlemeleri
FREE
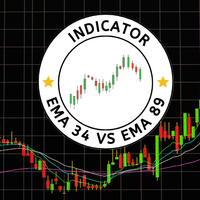
"EMA43 vs EMA89" Göstergesi, trend dönüşlerini ve potansiyel işlem fırsatlarını belirlemek isteyen tüccarlar için güçlü bir araçtır. Bu gösterge, EMA34 ve EMA89 hareketli ortalamalarını grafikte görüntüler. Bu hareketli ortalamalar kesiştiğinde, potansiyel bir trend yönü değişikliğini gösteren bir alım veya satım uyarısı oluşturulur. Özellikler: Kullanımı kolay: Göstergenin grafiğinize ekleyin ve EMA34 ve EMA89'un kesiştiğinde uyarılar almaya başlayın. Ayarlanabilir hareketli ortalama periyotlar
MetaTrader Mağaza, ticaret robotları ve teknik göstergeler satmak için en iyi yerdir.
MetaTrader platformu için ilgi çekici bir tasarıma ve iyi bir açıklamaya sahip bir uygulama geliştirmeniz yeterlidir. Milyonlarca MetaTrader kullanıcısına sunmak için size ürününüzü Mağazada nasıl yayınlayacağınızı açıklayacağız.
Ticaret fırsatlarını kaçırıyorsunuz:
- Ücretsiz ticaret uygulamaları
- İşlem kopyalama için 8.000'den fazla sinyal
- Finansal piyasaları keşfetmek için ekonomik haberler
Kayıt
Giriş yap
Gizlilik ve Veri Koruma Politikasını ve MQL5.com Kullanım Şartlarını kabul edersiniz
Hesabınız yoksa, lütfen kaydolun
MQL5.com web sitesine giriş yapmak için çerezlerin kullanımına izin vermelisiniz.
Lütfen tarayıcınızda gerekli ayarı etkinleştirin, aksi takdirde giriş yapamazsınız.