YouTubeにあるマーケットチュートリアルビデオをご覧ください
ロボットや指標を購入する
仮想ホスティングで
EAを実行
EAを実行
ロボットや指標を購入前にテストする
マーケットで収入を得る
販売のためにプロダクトをプレゼンテーションする方法
MetaTrader 5のための新しいテクニカル指標 - 14

SDivergence Indicator calculates and shows regular divergences and hidden divergences for MACD and Stochastic(for now). The benefit of this indicator is multiple input variables. Using these inputs you can modify to get more adaptive RD and HD's to your strategy. Guide : 1- First put your desired oscillator (MACD or Stochastic or Both) on the chart. 2- Run SDivergence indicator and set corresponding sub-window index of previously put oscillator in SDivergence input window. -Note: the chart sub-w
FREE

Pack Volatility 75 1/3 In this indicator stage 1 I am pleased to present you the volatility 75 Buy/Sell Professional indicator. where in each temporary structure it will mark a sale and a safe purchase to operate manually, where the strategy is based on the lines EMA of 7 exponential periods and the EMA of 50 exponential periods. where purchasing a product comes 2 as a gift (it's the pack) purchasing any of the 3 products will be sent the remaining indicators, to be able to apply the strategy we
On this occasion I am pleased to present the (Boom 300 Professional Pack) where it consists of 4 indicators for the Boom 300 index of synthetic indices (Deriv Broker) Acquiring this indicator enables you the pack of the 4 boom 300 indicators where the rest of the indicators will be sent, This indicator is 1 of the 4 that includes the Buy/Sell strategy, sending you clear alerts where there buy or sell the pair It is recommended to use in a period of 15 minutes, to have a greater profit since the

Minimalist style BB indicator fully filled with a single color. Indicator type: Technical Indicator You are too confused with the complicated zigzag lines in the BB indicator, especially when your strategy has many indicators combined, it looks like a mess and we will no longer see any candlesticks on the chart for technical analysis s. This indicator was born to solve that. See more: Conversion tradingview indicator collection | Minimalist Price Action Strategy | Subscribe It is design
FREE

The indicator is based on the concept of price channels, which are formed by plotting the highest high and lowest low prices over a specified period of time. The Donchian Channel Indicator consists of three lines: an upper channel line, a lower channel line, and a middle channel line. The upper channel line represents the highest high over a specified period, while the lower channel line represents the lowest low. The middle channel line is the average of the two and can be used as a reference f
FREE
To get access to MT4 version please click here . This is the exact conversion from TradingView:"HIGH AND LOW Optimized Trend TrackerHL OTT" by "kivancozbilgic" This is a light-load processing indicator. It is a non-repaint indicator. All input options are available. Buffers are available for processing in EAs. You can message in private chat for further changes you need. Thanks.

It is one of the famous indicator in TradingView platform. Supertrend indicator shows the trend of the market intuitively . You can use it for understanding the trend or get insight about the market.
------- Value & Color -------- You can change the colour (line, filled). Default value is the same as Tradingview Supertrend default value ( period 10, ATR multiplier 3.0)

支持線と抵抗線、そしてローソク足のギャップをチャート上に自動的に表示するため、価格が次に向かう可能性のある場所や反転する可能性のある場所を確認することができます。
このインジケーターは、私のウェブサイト(The Market Structure Trader)で教えているポジショントレード手法の一部として使用するように設計されており、ターゲットとエントリーの可能性のための重要な情報を表示します。 MT4 Version: https://www.mql5.com/en/market/product/97246/ このインジケーターには、2つのコア機能と4つの追加機能があります: コア機能1 - 日足、週足、月足のサポートラインとレジスタンスラインの自動表示 このインジケーターは、直近2日間、最大6週間前、数ヶ月前のサポートレベルとレジスタンスレベルを自動的に引き込みます。これらのレベルの見た目は完全にカスタマイズすることができ、いくつ表示されるかを表示することもできます。これらの重要な水準は、しばしば主要な支持線と抵抗線として機能し、価格が転換して引き戻されたり反転したりする場

トレンド チーフは、市場のノイズを除去し、トレンド、エントリー ポイント、および可能なエグジット レベルを決定する高度なインジケーター アルゴリズムです。 スキャルピングには短い時間枠を使用し、スイング取引には長い時間枠を使用します。 Trend Chief は、通貨、金属、暗号通貨、株式、指数など、すべてのメタトレーダー シンボルに最適です。
* トレンド チーフ インジケーターの使用方法: - 日足チャートとH4チャートを見てメイントレンドを把握 - トレンドが上昇している場合は、m15 のような短い時間枠に移動し、取引を行う前に価格がメインのグリーン ラインを超えるまで待ちます。他のすべてのラインもグリーンである必要があります。 - トレンドが下降している場合は、m15 などの短い時間枠に移動し、価格がメインの赤い線を下回るまで待ってから取引を行います。他のすべての線も赤である必要があります。 - ラインの色が変わったら取引を終了
私の信号と他の製品はここにあります

Boom and crash Gold Miner v2 trend histogram which works in conjunction with the indicator above that has arrows as shown in the video. PLEASE Note: That the top indicator and the bottom indicator are two separate indicators. the top indicator is https://www.mql5.com/en/market/product/98066 the bottom one is free. which is the histogram at the bottom. the trend histogram trading tool that helps to easy detect the trend blue color indicates an uptrend. Orange color is a down trend.
FREE
JPYTraderSR は、 JPYTrader Expert Advisor 専用のシンプルなサポートとレジスタンスのインジケーターです。 いつでも市場構造を形成するサポートとレジスタンスのレベルを示すことにより、エキスパートアドバイザーに追加の確認を提供します。 JPYTrader に複数の合流基準を提供することが唯一の目的であるため、このインジケーターに提供される設定はありません JPYTraderSR wa, JPYTrader Expert Adviso r sen'yō no shinpuruna sapōto to rejisutansu no injikētādesu. Itsu demo ichiba kōzō o keisei suru sapōto to rejisutansu no reberu o shimesu koto ni yori, ekisupātoadobaizā ni tsuika no kakunin o teikyō shimasu. JPYTrader ni fukusū no gōryū kijun o teikyō suru koto

Jackson Support and Resistance it a powerful advance support and resistance indicator which provide signal base on price action, it Design to make things easy for everyone to draw support and resistance. we believe most strategies are built with support and resistance as a foundation .Having support and resistance perfect can be a game change to you way of trading. It flexible to all instrument .don't forget to watch our video on how to us this indicator prefect and progressive.
FREE
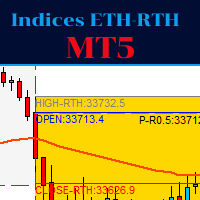
This indicator is for trading indices.
The RTH sessions (regular trading hours) where the underlying cash market is open are distinguished from ETH: for example for the American indices from 9:30 to 16:15 East Coast (New York) time, while for the Dax from 09:00 to 17:35 CET.
For the ETH session (outside RTH) the Fibonacci levels are plotted, as well as sensitive levels such as 25,50,75% retracement from the minimums and maximums.
Also for the RTH session the Fibonacci levels are graphed,

The fate of a trade depends on knowing the direction of the price trend. Whatever style you trade, you must know that the direction of the main market trend is in the hands of buyers or sell
YZD Trend indicator helps you to find the main direction by using mathematical parameters and ATR This indicator is a good supplement for your strategy, especially price action, which can reduce your trade losses.
How to use: YZD Trend indicator consists of two ranges in the form of bands, when th

Market Heartbeat is in your hand! Introduction The Market Heartbeat indicator with a special enhanced algorithm (volume, money flow, cycle of market and a secret value) is a very repetitive trend finder with a high success rate . Interestingly, this Winner indicator indicates that the trend has changed its direction or the end of a trend retracement or even appears at the range market. The Market Heartbeat can use in scalping trading or trend trading. It finds immediately with alarm, notificatio

To get access to MT4 version please click here . This is the exact conversion from TradingView: "Hammer & ShootingStar Candle Detector" by "MoriFX". This is a light-load processing and non-repaint indicator. All input options are available. Buffers are available for processing in EAs. You can message in private chat for further changes you need. Thanks.
FREE

--- StudentK RVI --- 1. Advanced strategy based on RVI 2. EA adapted (especially for StudentK's EA)
--- Context --- StudentK is not indicated as a master or K Sir for knowledgeable person who claims for winning all the time. (But lots of traders should know the fact that it is rarely truth, especially in fluctuated period of time)
StudentK is a group of years-experienced traders who want to share amazing tools in Free and Paid versions. Aiming helping people getting out of "The Rat Race" by
--- StudentK CCI --- 1. Advanced strategy based on CCI 2. EA adapted (especially for StudentK's EA)
--- Context --- StudentK is not indicated as a master or K Sir for knowledgeable person who claims for winning all the time. (But lots of traders should know the fact that it is rarely truth, especially in fluctuated period of time)
StudentK is a group of years-experienced traders who want to share amazing tools in Free and Paid versions. Aiming helping people getting out of "The Rat Race" by
--- StudentK MACD --- 1. Advanced strategy based on MACD 2. EA adapted (especially for StudentK's EA)
--- Context --- StudentK is not indicated as a master or K Sir for knowledgeable person who claims for winning all the time. (But lots of traders should know the fact that it is rarely truth, especially in fluctuated period of time)
StudentK is a group of years-experienced traders who want to share amazing tools in Free and Paid versions. Aiming helping people getting out of "The Rat Race"
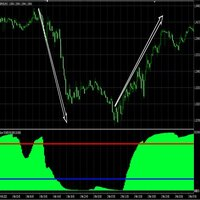
Absolute High Low indicator is a discretionary tool for assessing extremes in the price. It is very self-explanatory, and you can test against other default oscillators to see the difference. Combine with your trend following systems to master entry and exit at extremes. Back test and study the indicator to see the results up against a system or indicator. The indicator calculates a number of max bars so a gap will appear at the end, and it will restart. MT4 Version: https://www.mql5.com/e
Market Viewer gives a quick glance on correlation and direction. This indicator takes a list of symbols (max 8) Leave a symbol setting empty if you wish not to use that many - like in the defaults… It will check for each timeframe (Monthly, Weekly, Daily, H4, H1, 30min, 15min, 5min and 1min) if the current candle on that timeframe is bullish or bearish. This will give a good indication of the direction for us to trade in. We need to be in sync with the bigger timeframes.
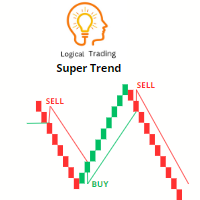
スーパートレンド指標は、トレーダーが市場のトレンドの方向や潜在的なエントリーと出口のポイントを特定するために使用する人気のあるテクニカル分析ツールです。価格の動きとボラティリティに基づいてシグナルを提供するトレンド追従型の指標です。
スーパートレンド指標には、上昇トレンドを示すライン(通常は緑色で表示)と下降トレンドを示すライン(通常は赤色で表示)の2つがあります。トレンドの方向に応じて、ラインは価格チャートの上または下にプロットされます。
スーパートレンド指標を効果的に使用するためには、次の手順に従ってください:
1. トレンドの方向を特定する:スーパートレンドラインを確認して、市場が上昇トレンドか下降トレンドかを判断します。緑色のラインは上昇トレンドを示し、赤色のラインは下降トレンドを示します。
2. エントリーシグナル:スーパートレンドラインの色が変わった場合、トレンドの反転の可能性を示すエントリーの検討を行います。例えば、スーパートレンドラインが赤から緑に変わった場合、下降トレンドから上昇トレンドへの変化を示し、購入の機会を示しています。
3. エグジット
FREE

トレーディングを次のレベルに引き上げるための強力な指標をお探しですか? MQL5 で最高の相対力指数 (RSI)、移動平均、および平均足指標を組み合わせた独自の RSI ベースの指標を探す必要はありません。
当社のインジケーターは遅延のないリアルタイムのデータを提供するため、情報に基づいた取引決定を自信を持って行うことができます。 初心者からエキスパートまで、あらゆるレベルのトレーダーに最適です。
カスタマイズ可能な設定とパラメーターを使用すると、インジケーターを取引スタイルや好みに合わせて簡単に調整できます。 デイトレーダーであろうと長期投資家であろうと、当社の RSI ベースのインジケーターは、トレンドの反転を特定し、利益を最大化するのに役立ちます。
当社の熟練した開発者チームは、比類のない精度とパフォーマンスを提供するインジケーターを作成するためにたゆまぬ努力を重ねてきました。 RSI、移動平均、平均足インジケーターを組み合わせることで、ゲームの先を行くトレーダーのための真のパワーハウスを作成しました。
RSI、移動平均、平均足インジケーターの強力な組み合わせで

強力なNRTR(Nick Rypock Trailing Reverse)インディケーターをご紹介します。トレンドの反転を特定し、効果的なトレーリングストップレベルを設定することを目指すトレーダーにとって必須のテクニカルツールです。ニック・ライポックによって開発されたこのインディケーターは、常に変化する市場条件に適応する独自のアルゴリズムを採用しており、どんなトレーダーのツールキットにも欠かせない存在となっています。
以下は、トレーダーがこのインディケーターを使用する人気のある方法です:
1. トレンドの反転:NRTRインディケーターは、トレンドが反転する予兆があるときに明確なシグナルを生成します。インディケーターラインが価格チャートを交差することに注意し、トレンドの方向が変わる可能性を示します。
2. トレーリングストップ:NRTRは、トレンド市場で利益を保護する頼りになるトレーリングストップツールとしても機能します。価格が望む方向に動くと、NRTRラインが価格の下または上に動的に追随し、適応可能なストップロスレベルを提供します。
カスタマイズ可能なパラメータ:NR
FREE

The indicator calculates fractal lines, which are technically psychological support/resistance lines. In fact, these are the highs and lows of the price over a period of time. The indicator works on all charts and timeframes. Settings: Fractal Candels - number of candles from which a fractal is built. Calculates the maximum/minimum at which a psychological price can be set. Rigth Candels - number of candles based on which false fractals are filtered to the right of it Left Candels - number of ca

Boom and Crash Gold miner v2 Trading indicator based on market momentum works on m1 for boom and crash 1000 and M5 time frame for normal trading pairs wait for blue arrow to appear plus change of candle stick color and candlesticks must be above the 2 modified moving averages then you can buy the market. wait for orange arrow to appear plus change of candle stick color and candlesticks must be below the 2 modified moving averages then you can sell the market.

Indicator introduction: A channel and trend line indicator, which is a good tool for manual trading, and also can be used for creating new EAs, without drifting or repainting. It applies to any timeframes and any symbols. The work of the indicator is shown in the screenshots. For any novice and programming trading friend, you can write the signal into the EA to play freely, buffer 0 corresponds to the bold trend line, buffer 4 and 5 respectively corresponds to the channel's upper and lower f
Introducing our groundbreaking Forex indicator, specifically designed to help traders master the art of identifying critical support and resistance zones, as well as double top and double bottom patterns with unprecedented accuracy. Say goodbye to guesswork and hello to a powerful tool that will revolutionize your trading experience. Our proprietary indicator leverages cutting-edge technology to recognize key price levels where buying and selling pressures are poised to shift the market dynamics

Very simple, yet powerful, indicator that helps you get notified every time a candle touches your trend line, horizontal line, and/or your rectangular. Powerful indicator yet very simple to use! All you need to do is draw your MT5 trend lines, horizontal lines, and/or rectangles and SmartLine takes care of notifying you the moment the current price touches one of your key levels! No brainer If you like the indicator, please leave a review and share the tool with your peers. WARNING: Please use t
FREE

--- StudentK Sync Chart --- 1. Move charts at the same time 2. Cross check among different Symbols and Timeframes 3. Plan your own trading strategies
--- Context --- StudentK is not indicated as a master or K Sir for knowledgeable person who claims for winning all the time. (But lots of traders should know the fact that it is rarely truth, especially in fluctuated period of time)
StudentK is a group of years-experienced traders who want to share amazing tools in Free and Paid versions. Aimi

--- StudentK Sync Chart --- 1. Move charts at the same time 2. Cross check among different Symbols and Timeframes 3. Plan your own trading strategies
=== Simple (Free) Version ===
1. Allow USDJPY only
2. Support M5 and M15
3. * Contact StudentK for unlocking all timeframes *
--- Context --- StudentK is not indicated as a master or K Sir for knowledgeable person who claims for winning all the time. (But lots of traders should know the fact that it is rarely truth, especially in fluctuat
FREE
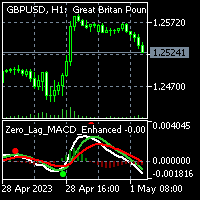
To get access to MT4 version please click here . This is the exact conversion from TradingView: "Zero Lag MACD Enhanced - Version 1.2" by " Albert.Callisto ". This is a light-load processing and non-repaint indicator. All input options are available. Buffers are available for processing in EAs. You can message in private chat for further changes you need. Thanks

Nadaraya-Watson Envelope Indicator convert to MT5 Nadaraya Watson Envelope Indicator is one of the monst popular indicator in TradingView. TradingView(Chrome, Edge) eats a huge of CPU, so I convert this to MT5 version.
As you can see the screenshot, it's good with Schaff trend RSI Indicator (or others) If you want to get Schaff trend RSI Indicator , Link: https://www.mql5.com/en/market/product/98011
Window Size - determines the window size for calculating smoothed values. A larger window

There are many linear regression indicators out there, most of them draw lines or channels, but this one actually draws a chart. The beauty of the indicator like Heiken Ashi is it removes a lot of market noise. 4 (OHLC) arrays are filled with Linear Regression(LR) values of each price for the LR period (default=14). The period of the Linear Regression is adjustable dependant on the market conditions. The SMA (default=14) also has period adjustment. Candles are generated with Green for 'Up' cand
Schaff trend RSI indicator (It is related with EMA and RSI) It is suited for sub-Indicator to undertand trend(or direction change)
As you can see the screenshot, it's good with Nagaraya-Watson Envelope Indicator (or others) I am using this indicator as Screenshot setting. (Schaff value is default value. 23, 50, 9, close) If you want to get Nagaraya-Watson Envelope, Link: https://www.mql5.com/ko/market/product/97965

The Super Trend is one of the best trend-following indicator for MT5 platforms. It's working fine for real-time trend alerts and accurate signals and it help to identify the best market entry and exit positions. This indicator is the tool you can refers to a trend following overlays. It contains two major parameters: the period and the multiplier. Besides, traders should consider default values that include 10 for every true range aтd 3 for the multiplier. 2 Types TP SL you set in input Point

The Off Trend MT5 Forex Indicator is a trend-following tool. Its signals are presented in the cloud. When the cloud is green, the trend momentum is bullish, and traders should take buy opportunities. Conversely, the trend momentum is bearish when the cloud is pink, and traders should take sell opportunities. The Off Trend mt5 Forex Indicator fits all timeframes and mt4 currency pairs.
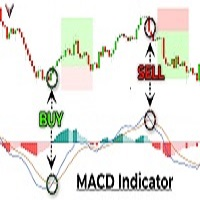
The MACD Gold Scalping Indicator is a powerful tool designed to help traders like you extract profits from the gold market. This indicator is based on the popular Moving Average Convergence Divergence (MACD) indicator, but it's been customized specifically for trading gold. When you use this indicator, you'll be able to quickly identify key entry and exit points in the gold market. It uses a combination of trend analysis, momentum indicators, and support and resistance levels to generate highly

チャート上にトレンドラインを描く プロセスを自動化する革新的な MT5 インジケーター、自動トレンドラインをご紹介します。トレンドラインを手動で描くという退屈で時間のかかる作業に別れを告げ
、自動トレンドラインに作業を任せてください。
*購入後、 手順とステップバイステップガイドをお送りしますのでご連絡ください。 高度なアルゴリズムにより、自動トレンドラインはトレンドラインを自動的に検出して描画し、
時間と労力を節約します。インジケーターをチャートに添付するだけで、価格変動の高値と安値に基づいてトレンドラインが識別され、描画されるのを観察することができます。 自動トレンドラインは高度にカスタマイズ可能で、取引スタイルや好みに合わせてインジケーターの感度を調整できます。
さまざまな線のスタイルや色を選択したり、トレンドラインが破られたときに通知するアラートを設定したりすることもできます。 初心者でも経験豊富なトレーダーでも、自動トレンドラインはあらゆる市場のトレンドを特定して分析するために不可欠なツールです。
ユーザーフレンドリーなインターフェイスと高度な機能を備え

Market Structure Patterns is an indicator based on smart money concepts that displays SMC/ICT elements that can take your trading decisions to the next level. Take advantage of the alerts , push notifications and email messages to keep informed from when an element is formed on the chart, the price crosses a level and/or enters in a box/zone. Developers can access the values of the elements of the indicator using the global variables what allows the automation of trading

指標の紹介 このインジケーターは移動平均式に従って設計されており、RSI や CCI よりも安定しており、遅れが少ないです 。このインジケーターには 3 つのインジケーター値、移動平均期間、および線の色があり、手動で変更できます。 このインジケーターは何をもたらすのでしょうか? 正確なエントリーシグナル: インジケーターは上下の矢印シグナルを描画します。 複数期間のトレンド分析: このインジケーターを大きな時間枠チャートと小さな時間枠チャートにロードすると、使用の効果が向上します。大きな時間足チャートではインジケーターの色に従ってトレンドの方向を判断し、小さな時間足チャートではシグナルに従って市場にエントリーします。 高価格と安値セクションの判断: インジケーターの値は常に 0 から 100 の間であり、これに基づいて価格の相対的な位置を分析できます。トレンドラインが 80 より高い場合、価格が買われ過ぎのセクションにある場合、買いポジションをオープンする機会を選択できます。トレンドラインが 20 を下回っている場合、価格は売られ過ぎの セクション にあり、売りポジションをオープンす

トレンド分析と取引の洞察のための "Demark Trends Indicator" のパワーを体験してください。 Demark インジケーターは、市場トレンドやエクソースポイントの評価における効果で知られています。当社の "Demark Trends Indicator" は、これらの専門知識をさらに高め、自動的にチャートに正確なトレンドラインを描画します。キャンドルの数、アラーム設定、ラインの色など、カスタマイズ可能なパラメータを使用して、あなたの分析に完全なコントロールを持つことができます。初心者でも経験豊富なトレーダーでも、当社のインジケーターはトレンド分析を簡素化し、時間と労力を節約します。 "Demark Trends Indicator" の潜在能力を開放して: 正確なトレンドの識別: 自動的に描画された正確なトレンドラインで市場トレンドをシームレスに分析します。 効率的な取引戦略: 現在のトレンドの状態を評価し、情報に基づいた取引のための可能なエクソースポイントを予測します。 カスタマイズ可能なパラメータ: キャンドルの数、アラーム設定、ラインの色などを調整して、インジ
FREE

MT5のアラート付きの自動固定範囲ボリュームプロファイル
この指標は、価格がより多くの時間を費やした場所を示し、取引に使用できる重要なレベルを強調しています。
また、特定の取引セッションの最も重要な価格レベル、バリュー エリア、およびコントロール バリューの概要を示す、経時的な価格密度を示すことができます。 このインジケーターは、M1 と D1 の間の時間枠に添付でき、日次、週次、月次、さらには日中のセッションの市場プロファイルを表示します。 時間枠が短いほど、精度が高くなります。 可視性を高めるには、より長い時間枠をお勧めします。 フリードローの長方形セッションを使用して、任意の時間枠でカスタム マーケット プロファイルを作成することもできます。 プロファイルのブロックを描画するために、6 つの異なる配色を使用できます。 プロファイルを単色ヒストグラムとして描画することも可能です。 または、強気/弱気バーに基づいてプロファイルを色付けすることもできます。 このインディケータは裸の価格アクションに基づいており、標準的なインディケータは使用しません。
バリュー エリアの高値

The standard Fractals Bill Williams indicator with the ability to specify the number of candles for formation. The indicator works on all charts and timeframes.
Settings: candles - the number of candles to the left and right on the basis of which the fractal is built (in the classic indicator this value is always 2)
Contact: If you have any questions or need assistance, please contact me via direct message. Author: Fertikov Serhii, More of my indicators, advisors, scripts are available i
FREE

The UT Bot Alert Indicator is an advanced technical analysis tool designed to help traders optimize their trading performance. This innovative indicator is based on the proven UT Bot system, which utilizes multiple indicators to deliver accurate signals that can help traders make better decisions. The UT Bot Alert Indicator provides a range of features that can help you stay on top of market trends and capitalize on opportunities. Here are some of its key functionalities: Trend Analysis: The UT
FREE

Gold TL MTF - this is a fine stock technical indicator. The indicator algorithm analyzes the movement of the asset price and reflects trend lines along the fractals of a specific timeframe (TF).
Benefits of the indicator: The indicator produces signals with high accuracy. The confirmed signal of the indicator does not disappear and is not redrawn. You can trade on the MetaTrader 5 trading platform of any broker. You can trade any assets (currencies, metals, cryptocurrencies, stocks, indices
FREE

Adaptive Moving Average (AMA) is a trend indicator using moving average and market noise filter. Indicator feature are blue and red points, showing the power of trend. Recommendations for trading: Auxiliary Indicator Detecting trend Detecting power of trend Detecting potential reversal points Main indicator Shows entry points for swing trading Serves as dynamic support and resistance Recommendations for use: Any instrument Any timeframe Input parameters: Period - AMA period Fast Period - fast MA
FREE

Supply and Demand Indicator + FREE Currency Strength Meter ADD-ON Looking for a powerful tool that can help you identify the most reactive zones in the forex market? Our supply and demand indicator for MetaTrader 4 and 5 is exactly what you need. With its advanced algorithms and real-time analysis, this indicator helps traders of all experience levels make informed trading decisions. The supply and demand indicator is a cutting-edge tool that helps traders identify areas where buyers and sellers

The best instrument for scalping. It allows you to always be correctly positioned in the price. It's a simple and extraordinarily powerful visual reference. Very suitable for price action. It consists of four components. 1. Fork. There are two levels that surround the price and mark the rebound points. They can be varied independently with 4 associated controls, two for each level. Its amplitude is indicated in pips in the indicator data. The minimum fork is updated with each tick. It has
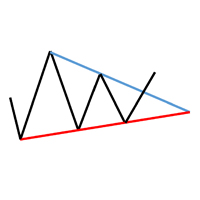
The TrianglesPro indicator for MetaTrader5 draws triangles on the chart based on the local highs and lows. The length of the trendlines can be limited. Optionally, you can display the highs and lows that are used to determine the triangles. It is also possible to determine how far back the identification of triangles should start. Also check out my other indicators.
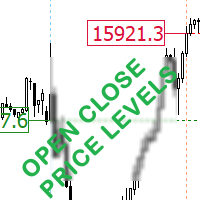
This indicator displays the open and closing price for the selected number of days. Easily identify market open and close Gaps. Select the Day icon to show the open and closing price line. Select the Time icon to show the open and closing hours. Indices and stocks are not a 24hour market as shown on MT5 charts, they open and close at specific times. Marketplace
Time Zone
Trading Hours
New York Stock Exchange (NYSE)
EDT
9:30 a.m. to 4:00 p.m.
Nasdaq Stock Market
EDT
9:30 a.m. to 4

The TTM Squeeze is a trading strategy developed by John Carter of Trade the Markets that uses the combination of Bollinger Bands and Keltner Channels to identify periods of low volatility, followed by periods of high volatility. The strategy is based on the principle that low volatility periods are typically followed by high volatility periods and is used to identify potential trading opportunities. When the Bollinger Bands move inside the Keltner Channels, it is referred to as a squeeze, and i
FREE

You may find this indicator helpfull if you are following a session based strategy. The bars are colored according to the sessions. Everything is customisable.
Settings: + Asia Session: zime, color, high, low + London Session: zime, color, high, low + US Session: zime, color, high, low
Please feel free to comment if you wish a feature and/or give a review. Thanks.
FREE

A pivot point is an intraday technical indicator used to identify trends and reversals mainly in equities, commodities, and forex markets . Pivot points are calculated to determine levels in which the sentiment of the market could change from bullish to bearish, and vice-versa.
the swing daily is an advanced pivot points indicator that grants the user control over many aspects of the trading levels that you'll get familiar with in the controls section it's used mainly to locate intraday

Imbalance / FVG MTF Mark Imbalance on chart of Selected Multi Time frames. Trend is Manually set to filter signals in the chosen direction by a button on the chart. .
Futures Auto Mark Imbalance / FVG on chart on selected time frames
Select time frames by buttons on chart
Popup Alert, Push Notification or email when New Imbalance Form
Popup Alert, Push Notification or email when Imbalance is Taken out
Select Alert Mode to be a single or multiple Imbalance ( OR / AND option ) when Imbalan

This is an indicator of trading sessions that can display all levels (Open-High-Low-Close) for four sessions . The indicator can also predict session levels. Sessions can be drawn with lines or rectangles (empty or filled), lines can be extended to the next session. You can easily hide/show each session by pressing hotkeys (by default '1', '2', '3', '4'). You can see ASR (Average Session Range) lines (default hotkey 'A'). This is similar to the ADR calculation, only it is calculated based on

「Versus USD(米ドルに対する)」は、主要通貨それぞれの価格変動を米ドルに対して計算し、グラフの現在の時間枠における各期間またはバーについて、そのパフォーマンスを比較的明確に表示します。加えて、「進捗バー」を使用して表示し、他の通貨と比較した際にその通貨が最も高いまたは最も低い変動率を経験したバー/期間には「矢印」を表示し、通貨のパフォーマンスをより正確に測定することができます。 米ドルは、外国為替市場における各主要通貨のパフォーマンスを測定するために使用される主要通貨であり、国際取引において最も流動性が高く広く使用されている通貨です。加えて、ほとんどの外国為替取引は米ドルをベース通貨またはクオート通貨として使用しているため、他の通貨のパフォーマンスを比較・評価することが容易になります。 外国為替取引における経験レベルや取引スタイルに関わらず、既に収益性の高いストラテジーを持っているかどうかに関わらず、このインジケーターは短時間でスキルアップすることができます。また、以下の機能を備えた使いやすいインジケーターです: 28の主要通貨ペアすべてに対応しています すべての時間枠(M1

50% Off Today Only! Price Goes Back Up at 11 PM (EST)
uGenesys Volume Indicator: Your Key to Mastering Market Volume Analysis What Traders Are Saying: "A must-have indicator...really a game-changer." – wuzzy66 "Amazing indicator...strongly recommend to beginners." – joinbehar Understanding Market Volume: Volume in the market is a critical indicator of movement and opportunity. The uGenesys Volume Indicator is specially crafted to pinpoint when the market has the most volume, allowing you t

Introducing our A.I Currency Strength Meter Forex Indicator, a state-of-the-art tool designed to provide forex traders with real-time insights into the strength of various currencies. Leveraging the latest advancements in artificial intelligence and machine learning, this innovative indicator analyzes market data in real-time, providing users with accurate and up-to-date information to inform their trading decisions. In addition to its cutting-edge algorithms, the Currency Strength Meter For
Add an image or logo on a chart. Parameters: "File name for On mode" - location of image file depending MQL5 folder. "Background object" - set the logo as a background object. “x”, “y” – coordinates on the chart, from which the logo shows. If you want to delete the logo, just remove ea from the chart. The suggested resolution for the image is 200x200 pixels. You can use this ea while recording a video.
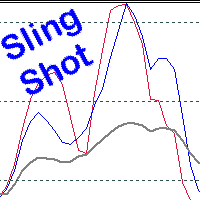
Scalping, Mean reversion or Position trading strategy
Get into an established trend on a pullback in the market. Use the Pinch in the indicator for profit taking. Use the Pinch as a mean reversion strategy, scalping back to a moving average line.
Input Parameters Fast Sling Shot configuration. Slow Sling Shot configuration. Dual Sling Shot configuration. Price line configuration. Trigger zones or levels. Example of Sling Shot trade idea: Price line sets the mood, below the baseline level (5
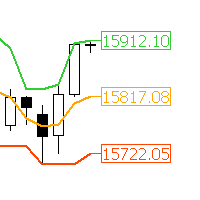
"AV Donchian Channel MT5" is an indicator for MetaTrader 5, which shows the current prices of the donchian channels and the middle line.
Multiple AV Donchian Channel indicators can be placed on one chart. The center line can be used for trailing.
See also Richard Dennis Turtle Trader strategy.
Settings:
- Donchian Channel Period
- Colors and widths of the lines
- Colors and widths of price labels
Please report bugs to me.

Simple ATR (Average True Range) Channel to find your Stop Loss and/or Take Profit. Indicator allows to draw a second multiplier if you need different values for SL and TP. Leave the second multiplier to 0 if not used.
Settings + Length
+ Smoothing
+ Multiplier #1 (default 1.5)
+ Multiplier #2 (set to 0 if not used)
+ High price
+ Low price
+ show price line
+ colors can be changed
Please leave wishes in the comments. Reviews are also welcome.
FREE

HighQualityMap是一个很好的中长线交易指示器,这个指标可以单独使用,尤其是用在M30或者大于M30的时间框架下,它能很好的体现出趋势的走向,以及转折点,你可以很快的从这个指示器上寻找到最佳的buy和sell位置,同时也能很好根据指示器去坚守自己的持仓定订单。指标不含有未来函数,不会重新绘制,不仅能够应用到自己的手动交易过程中,还能完全可以写入到自己的EA中。(如果你感觉到这个指标能够帮助你进行更准确的交易,请帮忙给个好评,希望我的作品能够帮助更多有需要的人) ===================参数列表===================== 所有参数均采用默认参数即可,无需更改,若为激进型交易者,可以根据自己的需要来调整参数。 =================参考使用方法=================== 此指标可以适用于任何交易品种,使用周期框架大于M30相对更准确。

This Indicator is based on Mr. Dan Valcu ideas.
Bodies of candles(open-close) are the main component used to indicate and assess trend direction, strength, and reversals.
The indicator measures difference between Heikin Ashi close and open.
Measuring the height of candle bodies leads to extreme values that point to trend slowdowns. Thus quantifies Heikin Ashi to get earlier signals.
I used this indicator on Heiken Ashi charts but, it's possible to choose to calculate Body size based on
FREE
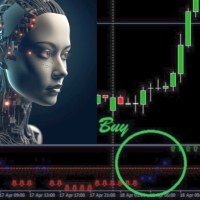
Introducing Trend Fusion 444F, a powerful MQL4 indicator designed to determine market direction using multiple trading indicators. This comprehensive tool offers a unique fusion of technical analysis techniques that help traders make informed decisions in various market conditions. Key Features: Comprehensive Analysis: Trend Fusion 444F combines several widely-used trading indicators to provide a multi-dimensional view of the market. The indicators include Moving Averages, MACD, RSI, DeMarker,

INTRODUCTION The Fib Autotrendline is a basic tool that analysts use to find out when a security's trend is reversing. By determining the support and resistance areas , it helps to identify significant changes in price while filtering out short-term fluctuations, thus eliminating the noise of everyday market conditions. It is an excellent tool for any trader who follows indicators that use swing highs and swing lows . How to Use the fib Auto Trendline Indicator The Fib Auto Trendline

これは上値と下値を判断するための明確な指標であり、変動する市場に適しています。
キャンペーン価格 49$ → 59$
特徴 上下の判断がうまい 再描画なし、ドリフトなし 高速計算、ラグなし リッチ リマインダー モード 複数のパラメータと色を調整できます
パラメータ 「========メイン========= HighLowPeriod1 = 9 HighLowPeriod2 = 60 HighLowPeriod3 = 34 HighLowEMAPeriod = 4 MASignalPeriod = 5 「========通知========= UseAlertNotify = true; UseMetaQuotesIDNotify = true; UseMailNotify = true; NotifySignalMode = 色を変更し、レベルを確認します。 ハイレベル = 80; 低レベル = 20; NofityPreMessage = "スマート ピーク ボトム";
EA コールの場合 0.ハイバッファー 1.低バッファ 2. 方向バッファ 1 アップ、0、

「BIG FIGURE INDICATOR」は、価格チャート上で整数や半分の数字(たとえば、通貨取引での1.0000や1.5000など)など特定のレベルで自動的に水平線を識別して描画します。これらのレベルは心理的に重要であると考えられており、大口トレーダーや投資家が注目する可能性がある丸められた数字を表しており、潜在的なサポートまたはレジスタンスレベルにつながります。ビッグフィギュアインジケーターは、トレーダーが重要な価格レベルを特定し、これらのレベルに基づいて取引決定を行うのに役立ちます。 ラインはM1からH8のタイムフレームチャートにのみ表示されます。 ラインの色は入力パラメータタブで変更できます。 すべての通貨ペアで使用できます。 MT4バージョン: https://www.mql5.com/fr/market/product/96747 注意:当社のインジケーターを最適に機能させるには、まずデイリー(D1)タイムフレームを読み込む必要があります
FREE
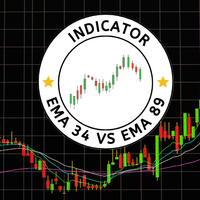
「EMA43 vs EMA89」インジケーターは、トレンド転換や取引機会を特定するための強力なツールです。このインジケーターは、EMA34とEMA89の2つの移動平均線をチャート上に表示します。これらの移動平均線がクロスすると、買いシグナルまたは売りシグナルが生成され、トレンド方向の潜在的な変化を示します。 特徴: 使いやすい:インジケーターをチャートにアタッチして、EMA34とEMA89がクロスしたときにアラートを受信するだけです。 調整可能な移動平均期間:EMA34とEMA89の長さを調整して、取引戦略に合わせることができます。 すべてのタイムフレームで動作:EMA Cross Alert IndicatorをM1からMNまでのすべてのタイムフレームで使用できます。 使い方: EMA Cross Alert Indicatorをチャートにアタッチします。 EMA34とEMA89がクロスするのを待ちます。 買いシグナルまたは売りシグナルが生成された場合は、新しいトレンドの方向に取引を行うことを検討してください。 リスクの免責事項:金融市場での取引にはリスクが伴います。過去のパフォーマ
MetaTraderマーケットは、履歴データを使ったテストと最適化のための無料のデモ自動売買ロボットをダウンロードできる唯一のストアです。
アプリ概要と他のカスタマーからのレビューをご覧になり、ターミナルにダウンロードし、購入する前に自動売買ロボットをテストしてください。完全に無料でアプリをテストできるのはMetaTraderマーケットだけです。
取引の機会を逃しています。
- 無料取引アプリ
- 8千を超えるシグナルをコピー
- 金融ニュースで金融マーケットを探索
新規登録
ログイン