YouTube'dan Mağaza ile ilgili eğitici videoları izleyin
Bir ticaret robotu veya gösterge nasıl satın alınır?
Uzman Danışmanınızı
sanal sunucuda çalıştırın
sanal sunucuda çalıştırın
Satın almadan önce göstergeyi/ticaret robotunu test edin
Mağazada kazanç sağlamak ister misiniz?
Satış için bir ürün nasıl sunulur?
MetaTrader 4 için Uzman Danışmanlar ve göstergeler - 77

Bomber is a fully automated Algorithmic Expert Advisor with multi-Strategies based on our IA optimization on different traditional strategies such as moving average , Ichimoku ,ADX, ... ,You are able to choose any one of the strategies or using all of them same as default setting together. live signal: https://www.mql5.com/en/signals/940345 Telegram group: h ttps://t.me/BomberExpert :::::::::::::::Requirement & Recommendations::::::::::::::: Please send us private message for better support.

LordTrendSignal is a financial market indicator for Meta Trader that checks signals through trends and candles, works on all TimeFrames (M1, M5, M15, M30, H1, H4, D1).
LordTrendSignal checks the signal through trends and candles and informs you via notification, alerts via email and push on the automatic screen.
The trend flexibility of LordTrendSignal is high, however, together with other of our indicators LordAutoFibonacci and LordAutoTrendLine you will be able to work very well to obtain

The indicator shows the trend change and how the market is changing. When calculating, many parameters are weighed. Therefore, divergence between the chart and the indicator is possible.
Input parameters:
IndicatorPeriod: several calculation periods (small - small period, medium - medium period, long - long period).
You can trade by divergence, analyzed on the resistance and support lines (and other types of graphical analysis), as part of other indicators. Tags: Stochastic, Trend.

Brief description
TrendWatch indicator analyze chart trend strength and acceleration. Analysis is based on close price SMA with configurable period. Result is given as set of two curves in the indicator window. Blue (default color) curve identify trend direction and strength. Yellow curve (default color) identify trend tendency to accelerate/deceleare. Scale of curves is normed to maximal value in given time period. Both curves can be additionally smoothed using configurable SMA and/or set to

Use our recommended broker: https://icmarkets.com/?camp=61478 What is neural breakout ea? Neural breakout ea is an advanced fractals breakout strategy with the neural network to predict market moves with high accuracy, combined with a smart averaging system. Neural breakout EA is tested on all released pairs for more then 10+ years including COVID-19 period and has been stable at all times. This is a proven strategy to provide long term account growth with minimal account risk involved. Main f

The Trend Slow indicator uses the author's algorithm for analyzing price behavior and displays the result of complex work in the form of lines. For simplicity, the algorithm automatically changes the line color according to its direction.
The indicator has a parameter to enable alerts when the color changes, thus helping the trader to identify new market trends.
This system will help you find high-probability trades in the direction of strong trends.

1. Automated trading system 2. Follow the trend / Breakout / Price Action 3. It can be add more positions to the trend(Pyramiding)
Parameters:
EA1: Entry Strategic Settings Stop New Open Orders: false/true Strategic_ABC: TrendFollow/BreakOut/PriceAction Trade Direction: Buy_Only Sell_Only Buy_Sell Pyramid Hedge(Long+Short): true/false(add positions to both direction) Hidden SL/TP Line: It can be hidden SL/TP line
EA2: Risk Management Se

This is the PORTUGUESE version, to buy the ENGLISH version, visit: https://www.mql5.com/en/market/product/103149 GET LordEA FREE INSTALLED AND OPERATING ON YOUR ACCOUNT, ASK ME PRIVATE MESSAGE. The LordEA specialist is a robot for Meta Trader with the objective of working with the robot's own trend and strategies.
We use by default methods of distancing and type of geometric lot where the robot will detect through the trend an exact time to open a new order, or even under martingale. LordEA
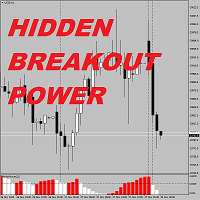
Hidden Breakout Power The market has a cycle, keeps on moving from: RANGE -> BREAKOUT -> TREND ->CONSOLIDATION ->RANGE RANGE and TREND The two major states, while the BREAKOUT refer to the short period of market breaking the range, CONSOLIDATION refer to the long consolidation of market and shrink to range. Usually oscillatory indicator performs well in RANGE states and perform poorly in trend state, while TREND indicator is the other way around, it performs will in a TREND states and but poor

The Trend Hist indicator is designed to display on a chart and visually evaluate the trailing algorithm by inside bars.
This indicator finds strong trend movements of a currency pair on a given number of bars, and also finds a correction to this trend. If the trend is strong enough, and the correction becomes equal to the one specified in the parameters, then the indicator signals this.
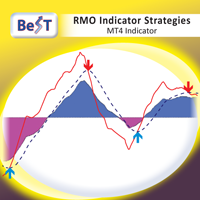
BeST_RMO Indicator Strategies is an MT4 Indicator that is based on the corresponding famous Oscillator created by Rahul Mohindar that detects trends in all markets and it can produce Buy and Sell Signals of high winning probability forming a complete and standalone trading system of impressive results.
The indicator uses 2 strategies as a selection: i) Classic : produces Reversed Entry Signals by the crossings of zero (0) line and ii) MAsSignals : produces Reversed Entry Signals using MAs of R

GS trendS is a trend indicator that can be used for any Forex financial instrument.
The indicator does not redraw and does not lag. Recommended timeframe H1.
It is possible to select the trend algorithm settings {Only Open, Average Open/Close, Average High/Low}
The color indicates the direction of the trend: yellow - direction can be SELL or BUY (S_B)
blue - uptrend (BUY)
red - downward trend (SELL) The indicator panel displays trend values of 5 timeframes for the current price level.

One of the biggest challenges traders face is finding the trading system that's right for them. Trend Op indicator predicts the most likely short-term price movement based on complex mathematical calculations. This indicator is designed to detect trends in price movement and allows you to quickly determine not only the direction of the trend, but also to understand the levels of interaction between buyers and sellers. It has no settings and therefore can be perceived as it signals.

LH ve HL kesintilerini bulmak için saf fiyat eylemiyle yapılan gelişmiş hesaplama.
Piyasada size büyük bir geri dönüş noktası verecektir.LH ve HL sinyalleri trengle çıkışları için de kullanılabilir.
Koparma gerçekleştiğinde, güçlü bir geri dönüş olduğunu gösterir.Hareketli Ortalamalar için güzel bir filtre.Bunu trend göstergeleriyle kullanmanızı şiddetle tavsiye ederim.
Destek ve direnç, arz talep göstergeleri için ekstra bir onay olarak kullanılabilir.
Daha fazla ayrıntı aşağıdaki for

LSM TrendReversal Pro Indicator is a ideal tool to identify detail and overall Trend and Supply/Demand Zones(Reversal) for scalping/day trading or swing trading. It has itself " MTF(Multi Time frame)" Trend filtering system in the indicator. 1. Easy Follow the Trend 2. Catch the Trend Reversal Area(Combined with " SupplyDemand Zones Indicator " ) 3. Supporting Entry/Exit Point (Trade Direction)
Basket Currency Strength indicator. Chart Symbols Changer. (Please see " LSM Basket Indicat

This indicator Pluuto Alert Pro indicator.Indicator displays trend movement. Indicator calculates automatically line.Alert = (FiltPer1,Line1_Arrow).When the alert is up the next alert is down,when the alert is down the next alert is up (new bar). Features FiltPer1 - displays indicator period.Per1 FiltPer2 - displays indicator period.Per2. FiltPer3 - displays indicator period.Per3. Multiplier1_per1 - displays indicator multiplier.(FlitPe1,step) Multiplier2_line1 - displays indicator multiplier.(L

The Expert Advisor ( Scalp Breakout ) can be launched on any hourly period, on any currency pair and on the server of any broker. Unique trading system! It is recommended to work with liquid Forex pairs, with a low spread and use VPS. You can start using it with $ 100 and 0.01 lot. The bot works on both Netting and Hedging account types. There is also a version for MT5 .
This is high frequency trading. Uses two trading options: with virtual and real stop losses. Virtual stop levels (take prof

Original Trrend Arrow trend indicator showing buy and sell areas. With this indicator, you do not need to sit near the computer and wait for the inflection point to appear day and night.
The indicator is very easy to use. When an up arrow appears, open a buy deal. When a down arrow appears, open a sell trade.
The indicator works on all timeframes and currency pairs. It is advisable to use the indicator in combination with other instruments for more reliable signals and making a more balance

This trading system is based on market impulses of varying complexity.
To generate a signal, the indicator uses the moments when the direction of the pulse and the necessary section of the trend coincide. The indicator also takes into account the current market volatility. Stop_loss tags can be set with the parameter "0" or "1", then Stop_Loss will take into account market volatility.
Take_Profit tags can be set with the parameter "0", then Take_Profit will take into account market volat

Precise trend following strategies - Forex Miner EA is based on Strong current Trend.
- Built with a mixture of many Trending indicators to get best Results on daily basis.
- As statistics say 95% Traders in this market, unfortunately, lose their hard earned money and the key factor is bad money management taking small profits and huge losses Our Robot is designed to follow the strong current trend so risk is at minimum side and Profits coming out are Big Green Pips.
Highly Adva

NEW OPTIMIZATION , LOWER DRAWDOWN UPDATE!
VERSION 3.5
(Real Profit, Real Trades, Real Signal)
After your purchase, drop me a PM.
Ever wonder why the popular selling scalpers with fixed Stoploss, that you bought, never makes money after a while, even though the backtest is great? Ever wonder why you dont make profit from the EA's that you used, after going through many of them?
There is a reason for that.
Hi, Im a Quant with 15++ years REAL trading experience. You can PM me any

This is a price action trading robot, the EA will stick to the medium term trend and price to deliver trades. Orders are always protected by the user set stop loss points. With the capital management system, it will help that EA operates in accordance with its purpose. Telegram : https://t.me/trungtqIT
Timeframe is M5,M15. Minimum account balance: $30. Attention is Important: EA only test live on demo or real accounts. Backtest results are just random and inaccurate.
Features: Every trade is

An arrow is formed on the current candle and indicates the direction of the next candle and the possible direction of the trend in the future.
The signal can sometimes drop out.
The trade is entered at the Next candlestick. .
its advantages:
accuracy of signals. complete absence of redrawing. You can choose absolutely any tool. the indicator will provide many profitable and accurate signals there is alert, push, email of seeing ... no need to pile up a live chart with different indica

Binary Options Support Resistance Indicator This indicator is designed for binary options trading and effectively shows retracements from support and resistance levels. Signals appear on the current candle. A red arrow pointing downwards indicates a potential selling opportunity, while a blue arrow pointing upwards suggests buying opportunities. All that needs adjustment is the color of the signal arrows. It is recommended to use it on the M1-M5 timeframes as signals are frequent on these timef

A limited number of copies will be sold on the MQL5 market. Price $500. The last of the 10 remaining prices $700 for the next 10 copies. Prices will rise sharply later, just to keep actual users up to date and save EA exclusivity
It doesn't use Martins or grids, and it has stops at each position.
魔术 -EA唯一标识符 资金管理-( 固定手数) 您可以设置固定手数 (根据风险) 在达到止损的情况下,松开此处分配的 百分比 风险 (余额百分比) 帐户余额的 百分比 风险。 自动风险- (根据风险)在达到止损的情况下,您可以放松在此处分配的风险百分比 周五收盘时 停止交易 -周五收盘时 停止交易 周一开市时 停止交易 -周一开市时 停止交易 最小化

Indicator LTS for MT4(Level + Trends + Speed)
The LTS indicator was specially created for quick analysis of consolidations on the chart , which greatly facilitates decision-making when trading. LTS marks resistance and gives information about the forces affecting it, as well as the current speed and average travel. The indicator is easily customizable and can analyze any timeframe. LTS uses a unique trend analysis algorithm based on 4 parameters from global to local.

The Finance Craft bot is suitable for everyone who was looking for a universal scalpel but cannot dwell on a specific product, because in all of them it notices flaws or does not understand the trading strategy. For those who fall into this category of searchers, there is good news - this bot is for you! In the description presented below, only essential information will be provided, and nothing superfluous. The first important point is that the bot works on both Netting and Hedging account typ

Limited number of copies will be sold on MQL5 market.
Price $500 last one of 10 left at this price
Next 10 copies $700. Later the price will increase drastically just to keep the actual users up-to-date and save exclusivity of EA Strategies don't use Martin, hedge, grid,
EA uses the trend strategy.Open positions after the trend correction ends,and will open 5 orders at most
Can be linked to 30 currency pairs, Each pair passes the 5-year history test.
Signal : https://www.mql5.com/en/s

When you are on the way, the GPS detects wrong points on your way, at that moment you decide if you pay attention to the GPS and turn around if possible. Or continue on your way. This system detects the points where the market has to continue in the trend or initiate the return to the range. It allows the trader to choose the appropriate direction. And as the market moves away from our point, the intensity of our decision increases.
This system is suitable for small accounts and can be used w

This EA is based on the supertrend indicator signal.
The indicator line is divided into two colors, orange for short and green for long.
Parameter setting:
External double LotSize = 0.01; / / number of hands
External int magic = 20201114; / / magic, which mainly distinguishes the order difference from other EA, and generally does not need to be concerned
External int SL = 300; / / stop loss
External int TP = 500; / / stop profit
External int period = 10; / / indicator perio

Parabolik Tahmincisi, kesin eğilimleri belirlemek ve pazara giriş ve çıkış seviyelerini tahmin etmek için geleneksel Parabolik sinyalleri filtrelemek için tasarlanmış güçlü bir teknik göstergedir. Gelişmiş teknikleri ile bu gösterge, trend yönünün doğru bir şekilde görselleştirilmesini, optimum giriş seviyelerini ve doğrudan grafik üzerinde kar alma seviyelerini sunar. Ek olarak, bir sinyal oluşturulduğunda veya kar alma seviyesine ulaşıldığında mobil, e-posta ve açılır uyarılar yoluyla bildir

AwS Algorithm whit Stocastic: It is a algorithm system that uses the stocastic signal as a reference to enter the market.
The system detects the important points and operates the trend o the pulback, you chosse the direction
You can download the demo and test it yourself.
Very stable growth curve as result of smart averaging techniques.
"Safety first" approach in development. Stress-tests on historical data f

Popüler Parabolik Göstergeyi temel alan gelişmiş bir çok sembollü, çok zamanlı çerçeve ve yeniden boyanmayan bir pano göstergesi olan Parabolik Tahmin Panosu ile tanışın. Kesin eğilimi belirlemek ve pazara giriş ve çıkış seviyelerini tahmin etmek için geleneksel Parabolik sinyalleri filtreler.
Bu gösterge sadece bir gösterge panosu değildir. Sembole tek bir tıklama ile trend yönünü, doğru giriş seviyelerini görebilir ve yeni bir grafik penceresinde kar seviyeleri alabilirsiniz. Ve hızlı
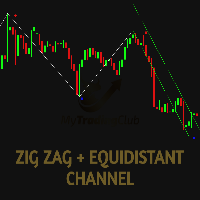
The MTC Equidistant Channel indicator is a helping tool for the traders who use: The supports and resistances lines; The trends; Fibonacci levels; It's a combination between the ZigZag indicator and the Equidistant chanel, It helps to detect the break-outs in many strategies and shows the possible entry points. The indicator capabilities : Drawing the Equidistant chanel automatically on the ZigZag indicator. The possibility of changing the ZigZag indicator settings. The indicator works on all ti

After purchasing, you can request and receive any two of my products for free!
После покупки вы можете запросить и получить два любых моих продукта бесплатно! Well-written author's strategy based on indicators: Bollinger Bands, Moving Average, RSI. The entry into the position is carried out according to the trend on pullbacks by the signal. Default: H1 (AUDUSD, GBPUSD, EURUSD, USDJPY, USDCAD, NZDUSD, EURGBP, USDCHF, EURJPY). It is important that in case of a trend change, averaging is use

Trend monkey Trend Monkey is an EA that integrates various strategies such as trend identification, grid, and hedging. After using it, I believe you will be able to start your journey of wealth. This is the free version, you can download the professional version.
Big discount: 30% discount for the top ten users
Feature Spread requirements are not particularly demanding, general platforms can run Follow trends, use trends to trade Using hedging transactions to maximize profits
Recommen

The Dual Strategy bot uses a strategy based on classic and reliable Moving Average as well as the Relative Strength Index oscillator. You have always wanted a reliable strategy that works according to well-known rules according to the classic and understandable approach to the formation of signals for entry and exit. To make everything clear and transparent? Do you find many implementations of such strategies, but they all have problems in trading and significant drawbacks and shortcomings when

There are times in life when your future is decided by heads or tails.
This system detects these moments and allows you to choose if you want to play it heads or tails.
Depending on what you choose, the system will start the algorithm in the direction that you have decided.
Choose whether you want heads or tails.
This system is suitable for small accounts and can be used with only $ 10 00 .
You can download the demo and test it yourself.
Very stable growth curve as resu

This indicator Pluuto Alert Plus indicator.Indicator displays trend movement. Indicator calculates automatically line.Alert = FiltPer.When the alert is up the next alert is down,when the alert is down the next alert is up (new bar). Features
FiltPer - displays indicator period.Line1. FiltPer2 - displays indicator period.Line2. Multiplier - displays indicator multiplier.(FlitPer,Line1;step) Deviation1 - displays indicator deviation.(Line2) Deviation2 - displays indicator deviation.(Line2) Deviat

The algorithm of the advisor calculates the important support and resistance levels.
Next, the Expert Advisor calculates the probability of price movement "to" or "away" from this price level. Support: https://www.mql5.com/en/channels/TrendHunter If a high probability of price movement in the desired direction is determined, the advisor opens a deal.
Each trade is protected by a stop loss. Dangerous trading methods are not used. Recommended instruments (5M): GBPUSD, EURUSD, USDJPY, USDCAD.

The Progressive Moving bot uses a strategy based on classic and reliable Moving Average. A significant advantage of MA is trading in the direction of the current trend. This can be seen on the terminal screen after breaking the Moving Average line. Moving average trading is understandable even for a beginner. One of the most common methods is crossing two or more moving averages. In one indicator, a shorter period is configured, in the other, a longer one. You have always wanted a reliable stra

Description
Volume Magic is an indicator that shows the value of the relative volume in conjunction with the direction of the current trend. The ratio of the current volume relative to the average volume for a certain period is displayed in the lower window as an oscillator. The direction of the current trend is displayed as two-color trend lines.
How to use?
First, use two-color trend lines to determine the direction of the current trend. Then look for areas of low volume and open positi
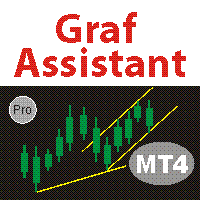
Индикатор MT4 выполняет комплекс задач в одной программе. Предназначен для быстрого всестороннего графического анализа цены на финансовых рынках. Включает в себя функции построения различных трендовых линий, каналов, волн, свечей, уровней фибо, круглых уровней, ZZ. Определяет флет, волновые и канальные паттерны, процентное отношение коррекционных волн. Отсчитывает время до окончания текущего периода. Все функции включаются и выключаются кнопками на панели графика. Выводить на экран можно как од

THE LAST RING OF SATURN is not an EA is your EA. Do you want to accompany THE LAST RING OF SATURN to the LAST level of neural trading? You just have to download it and try it yourself. Also testing it is free. Are you not going to try them?
THE LAST RING OF SATURN it is a Secure Automated Software for trade Forex market and indices. The architecture is a Fully Automatic Autonomous Robot Expert capable of independently analyzing the market and making trading decisions THE LAST R

This indicator Pluuto Alert indicator.Indicator displays trend movement. Indicator calculates automatically line.Alert = arrow.When the alert is up the next alert is down,when the alert is down the next alert is up (new bar). Features
FiltPer - displays indicator period.Line1. FiltPer2 - displays indicator period.Line2. Multiplier - displays indicator multiplier.(FlitPer,Line1;step) Deviation1 - displays indicator deviation.(Line2) Deviation2 - displays indicator deviation.(Arrow) Trend - displ

Least Square MA Description: The Least Square Moving Average indicator allows you to assess the direction of the market movement and its possible reversals. The indicator is a line that is displayed in the price window. Input parameters: LSMA_Period - the period for calculating the moving average using the least squares method; Prediction - the number of candles used to construct the predicted moving average using the least squares method, provided that its rate (falling or growing remains); D

Trend Target analyzes the main parameters of Forex, helps to obtain information about the current position of all market transactions for a particular asset. Trend Target makes it possible to classify the direction of price movement by determining its strength. Solving this problem helps to enter the market on time. You can not only see the direction of the trend, but also the levels that you can work with.
The indicator also allows plotting levels. Quickly identifies support and resistance l

Trend LineA is a powerful trend indicator equipped with everything you need to trade and at the same time very easy to use. The indicator calculates the most probable zones of trend stop / reversal, zones of confident trend movements. The indicator works on all timeframes and currency pairs. The indicator gives quite accurate signals and it is customary to use it both in trend and flat markets. It is advisable to use the indicator in combination with other instruments for more reliable signals

The Trend Map indicator is designed to detect trends in price movement and allows you to quickly determine not only the direction of the trend, but also to understand the levels of interaction between buyers and sellers. It has no settings and therefore can be perceived as it signals. It contains only three lines, each of which is designed to unambiguously perceive the present moment. Line # 2 characterizes the global direction of the price movement. If we see that the other two lines are above

Indicator of strong levels. Usually, price either bounces off them or breaks out powerfully with a strong move. Also, often in areas of such levels, the price turns into sideways movement, gaining strength before a new impulse.
Settings: Timeframe - Select a timeframe; TopColor - Color of support zones; BotColor - Color of resistance zones; Price_mark - Color of price labels; Price_Width - The size of price labels.

I imagine that right now you're feeling a bit like Alice, tumbling down the rabbit hole ? Hm?
You take the BLUE PILL , the story ends, you wake up in your bed and believe whatever you want to believe.
You take the R ED PILL , you stay in Wonderland, and I show you how deep the rabbit hole goes... Remember, all I'm offering is the truth, nothing more.
Follow me. You can download the demo and test it yourself. Very stable growth curve as result of smart averaging techniques.
"Safety fir

The indicator is designed to determine the momentum of the price.
The Stochastic is recommended to be used during the lateral movement phase together with other indicators. However, some Stochastic signals have worked well in the trending market.
Overbought and oversold zones
Oscillator zones above 80% and below 20% are called overbought and oversold zones, respectively. When the price enters the overbought zone (that is, trades near the upper border of the range), if it bounces down, the
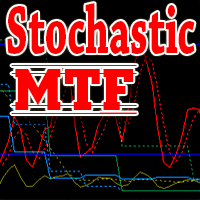
The indicator displays the Stochastic oscillator indicator readings of four time frames simultaneously in the lower window of the chart.
An example of a possible use: the direction of all indicator lines in one direction is a sign of a strong trend. The use of the lag factor - in the case of the indicator lines staying in one area for a long time - is a sign of trend "fatigue", its stop or reversal. The indicator is redrawn only within the candlestick of its own timeframe.
The indicator has

Hello all The expert works on the moving average indicator Calculating the number of points from the current price and the index Entering into a profit deal 5 pips If the trend reverses with a new signal, it enters a trade with the trend with opening consolidation deals with the same size of the original lot With the closure of all together on a profit of 5 points Cooling deals with the same size of the basic lot 15 pips opens a new trade Work on the M15. Parameters:
Lot1: Manual Lot Size Au

The strategy of the Expert Advisor is based on a non-standard method of reading the Bollinger bands indicator data.
The algorithm of the advisor determines the zones of market consolidation (squeeze) and a subsequent sharp increase in volatility. After a decrease in the level of increased volatility, the EA starts working in the direction of the most probable price movement.
The EA does not use dangerous trading methods. Every trade is protected by a stop loss. Recommended currency pairs (T

The Trend Rever indicator uses two lines of different colors to display buy or sell signals. The first of these lines is red and the second is blue. When changing the color of the lines, an arrow is also displayed, which indicates which deal to open, buy or sell. A simple but effective system for determining the Forex trend. The algorithm takes into account the measurement of prices, and this method also focuses on the measurement of each of the price drops - which gives more detailed informati
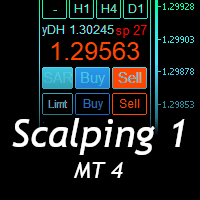
Scalping Day Trading Support Utility Scalping One for MT4
setting faile (for white Chart) http://www.emkyuradias.shop/indexenglish.html
One position is displayed with one button. View P & L, Lot, and Point in real time. It is possible to switch the display of positions of only chart currencies and all currency pairs. Supports automatic identification in Japanese and English Account currency notation corresponds to dollar, euro, pound, yen (automatic identification) Lot, take profit an

The strategy is based on the search for areas of concentration of prices of large buyers and sellers. In such zones, short-term trends are usually generated. This is a grid EA, but thanks to the function of overlapping unprofitable orders, it is able to withstand large drawdowns and recover the account. Works well on volatile pairs and gold (XAUUSD, GBPUSD, USDCAD, EURUSD, USDJPY, USDCHF, AUDUSD, NZDUSD ... ). It has many useful functions, such as closing orders on Friday or when an equity t

If you are looking for a Best Grid EA. DON'T MISS IT!
The King EA combine 2 Strategy, which strategy in all top Grid EA Include in The King EA. With only 1 EA, you can change setting to use many Strategy you want to get good result. SETTING #30 for EUR USD H4, GBPUSD/ GBPJPY M30/H1, Gold M1/M15
Recommend ECN broker with LOW SPREAD: IC Market , Exness, NordFX , FXPRIMUS , Alpari , FXTM It good to combo with Buy Sell Signals to follow Trend and Sellect Buy Only/Sell Only for E

The Progres indicator uses calculations designed to smooth out sharp fluctuations that do not affect the overall picture of price movement.
This is an auxiliary tool for technical analysis, which helps to determine the direction of the trend: either upward or downward price movement on the selected trading instrument. The indicator is a trend-type indicator; it smooths out price fluctuations during signal formation by averaging data.
The trend can be ascending (bullish) and decreasing (bear

Interesting Trend - can be easily used as an independent trading system. The indicator tracks the market trend, ignoring sharp market fluctuations and noise around the average price. Implements an indication of trend movement with moments for potential stops in the indicator.
Simple, visual and efficient use. The indicator does not redraw and does not lag. Works on all currency pairs and on all timeframes. You can interpret it like this: The location of the rate above or below the shadows ind
The intelligent algorithm of the Reversibles indicator determines the direction and strength of a trend, and also signals a trend change. Reversibles is a technical analysis indicator. Uses just one parameter for settings.
The indicator is built for simple and effective visual trend detection with an additional smoothing filter. The indicator does not redraw and does not lag. Shows potential market reversal points. The indicator can work on any timeframe.
You can set up message alerts as so

Emerged is a convenient indicator for technical analysis and is suitable for trading binary options. The indicator uses color signaling: blue - when changing from descending to ascending, and red - on the contrary, to descending. You can use the indicator when entering the market. All entry points are optimal points at which movement changes. Entry points should be used as potential market reversal points. The default indicator settings are quite effective most of the time.
Emerged hybrid tre

The Trend Distinctive indicator smoothes price fluctuations during signal formation by averaging the data. This gives the trader the opportunity to visually determine what trend will be present at a particular time interval.
This is an auxiliary tool for technical analysis, which helps to determine the exact direction of the trend: either an upward or downward movement of the price of a trading instrument. Although the indicator is a little late, it still generates the most reliable signals t

The Open Trend indicator calculates the saturation levels of the price chart. Most often, a good trend is visible on a price chart visually. But an experienced trader should clearly understand the current balance of power in the market before entering.
A signal to exit the oversold area is a buy signal. A signal to exit the overbought area is a sell signal. Usually, you need to set the relative values for the overbought and oversold levels Bottom and Top for this indicator.
The Open Trend

Escape the black Hole, is a system that detects the range that is the black hole that keeps your money.
Once the limit of that range, which would be the event horizon, has been detected, an attack system at the price that operates in favor of the escape of that black hole begins.
Therefore, it is a system that operates in favor of the trend at the moment in which it is confirmed that the trend has exceeded the point of gravity that drags it into the fearsome price range that devours the tre
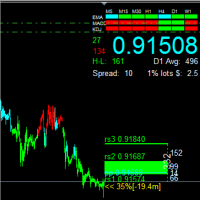
1. This indicator provides the judgment of the intraday trend, and the period is effective if the period is switched to below 4H" 2. This indicator provides an accurate calculation of intraday support and resistance. Under the condition of the trend, the box is the entry benchmark price" 3. This indicator provides the calculation of the interval between the current price and the intraday support and resistance for a clear analysis of the situation" 4. This indicator provides three indicators fr

After the indicator is loaded, it will display a close to the real balance net value change graph, and contain deposit and withdrawal prompts, etc.
1. The indicator is the trend display of net balance 2. The net value estimation uses the reverse order calculation, and the trend of each currency pair order on the K-line chart is retrospectively estimated to obtain a more accurate net value 3. If you want all the history to be calculated, please select all in the history, if you don't need all,
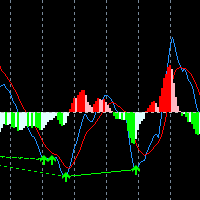
MACD is called Convergence and Divergence Moving Average, which is developed from the double exponential moving average. The fast exponential moving average (EMA12) is subtracted from the slow exponential moving average (EMA26) to get the fast DIF, and then 2× (Express DIF-DIF's 9-day weighted moving average DEA) Get the MACD bar. The meaning of MACD is basically the same as the double moving average, that is, the dispersion and aggregation of the fast and slow moving averages characterize the
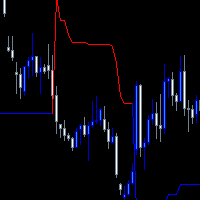
L' INDICATORE DI TREND PRO mostra la direzione del mercato e rende facile sapere quando si è verificato il breakout. È facile da impostare e molto utile con una conoscenza di base dell'azione dei prezzi. Puoi utilizzare PRO TREND INDICATOR per scambiare tutti gli asset che rompono il supporto o la resistenza. Trova il set up che si addice di più alla tua strategia di trading per individuare i punti di breakout.
MetaTrader Mağaza - yatırımcılar için ticaret robotları ve teknik göstergeler doğrudan işlem terminalinde mevcuttur.
MQL5.community ödeme sistemi, MetaTrader hizmetlerindeki işlemler için MQL5.com sitesinin tüm kayıtlı kullanıcıları tarafından kullanılabilir. WebMoney, PayPal veya banka kartı kullanarak para yatırabilir ve çekebilirsiniz.
Ticaret fırsatlarını kaçırıyorsunuz:
- Ücretsiz ticaret uygulamaları
- İşlem kopyalama için 8.000'den fazla sinyal
- Finansal piyasaları keşfetmek için ekonomik haberler
Kayıt
Giriş yap
Gizlilik ve Veri Koruma Politikasını ve MQL5.com Kullanım Şartlarını kabul edersiniz
Hesabınız yoksa, lütfen kaydolun
MQL5.com web sitesine giriş yapmak için çerezlerin kullanımına izin vermelisiniz.
Lütfen tarayıcınızda gerekli ayarı etkinleştirin, aksi takdirde giriş yapamazsınız.