YouTube'dan Mağaza ile ilgili eğitici videoları izleyin
Bir alım-satım robotu veya gösterge nasıl satın alınır?
Uzman Danışmanınızı
sanal sunucuda çalıştırın
sanal sunucuda çalıştırın
Satın almadan önce göstergeyi/alım-satım robotunu test edin
Mağazada kazanç sağlamak ister misiniz?
Satış için bir ürün nasıl sunulur?
MetaTrader 4 için Uzman Danışmanlar ve göstergeler - 288

Martingale or Fixlot !!
Time unit: 1 min MM Type 1 Mrtingale MM Type 2 Fixlot Minimum lever: 1: 500 and or 1: 1000 In the discussions I will add a few sentences right away. The EA is programmed for EURUSD, but can also be used with other pairs. In this case, the settings must be adjusted! Wish good luck.
I test on the two accounts relatively many settings so do not wonder if it is more or less one! Real account Broker FBS Server Real 9: 290046195 Password: Invest1 Broker FBS Real 3 Login 23031

"Pisces Expert Advisor" Powered by FxGangster
This EA Better work with GBPJPY and USD Pairs. this Expert Advisor has a Scalping, hedging and trend following strategy when trade with wrong way, it will use hedging to fix it, and I have included too much indicator inside this EA, you can use all setting inside to set this EA, by the way you can look how many indicator and how to setting in my screenshots pictures. Live myfxbook : Pisces EA -------------------
We provide Forex Analyst signals,

Scalpinez is a complete scalping system. The indicator itself analyzes the market and gives the trader clear signals for opening and closing orders. The same indicator gives recommendations on the size of TakeProfit. StopLoss - reverse signal. That is, if we have an open sell order and it has not yet had TakeProfit, a blue arrow appears to buy - we close the sell order.
Thus, working with the Scalpinez indicator is reduced to following its instructions.
The trading strategy is as follows: When

The TrendLSMA indicator is very reliable because it is based on moving averages. The TrendLSMA feature is the presence of a signal for entry / exit - the indicator line indicates in a certain color the signals "buy" or "sell". The accuracy of this signal is very high, 95% success rate for 5% failures. TrendLSMA is also suitable for exiting a position. The indicator almost completely captures the trend, but during flat it is necessary to use filters. When entering a position, you will always work

Индикатор RegressionXP рассчитывает два типа регрессии и вычисляет среднеквадратичную девиацию цены на данном диапазоне. Важна прямая золотая линия (регрессия первой степени), показывающая направление и состояние текущего тренда на выбранном таймфрейме. Чем больше угол с горизонталью, тем сильнее тренд. Таким образом, мы имеем возможность делать выводы относительно состояния валютной пары по текущему расположению цены относительно линии регрессии. На расстоянии от золотой линии проходят параллел

This EA loads Support & Resistance Trend Lines and trade purely based on price action of Trend Reversal strategies. No effect with manual entry. It is possible to use this Expert Advisor as indicator. It also featuring both safe Hedging and Multingle methods as well MANUAL entry by using control panel. Auto Strategy: Swing Reversal Patterns with trailing TP & Stop. Manual Strategy: BUY/SELL using Control Panel on chart with trailing TP & Stop. Operating Procedure Use 15 Minutes time frame char

Currency Heat Wave Ultimate teknik göstergesi, tüccarlara ana para birimlerinin gücü hakkında gerçek zamanlı içgörüler sağlayan değerli bir araçtır. 28 döviz çifti analiziyle, doğrudan grafik üzerinde döviz gücüne ilişkin kapsamlı bir genel bakış sunarak kullanımı inanılmaz derecede kolay hale getirir. Renkleri dinamik olarak değiştirerek, tüccarların para birimlerinin pozisyonlarını hızlı bir şekilde belirlemelerine ve bilinçli kararlar vermelerine olanak tanır. Currency Heat Wave'in dikkate

Индикатор Analytic System - это полноценная торговая система. Он состоит из 2 частей: Первая - это стрелочки, показывающие наиболее оптимальные точки открытия и закрытия сделок. Стрелка вверх - сигнал на покупку,стрелка вниз - на продажу. Индикатор использует сложные аналитические алгоритмы, при помощи которых система определяет моменты входов и выходов. Вторая - это информационная панель в правом верхнем углу. Крупным шрифтом обозначена цена, справа от неё показано текущее направление тренда (в

KT Ichimoku Trader is a fully automated expert advisor that offers five popular trading strategies based on the Ichimoku indicator. Each strategy has it's own entry and exit method without any interference to other strategies. The Ichimoku system can be applied to all major currency pairs and metals. However, we found that it performs reasonably well mainly on two pairs. MT5 Version is available here https://www.mql5.com/en/market/product/35043
Features
Trade up to 5 famous trading strategi

Psr3 EA is the one of Psr series EAs. It works on 5 minutes chart only. You can use this EA any currencies but you should optimize first. Default parameters belongs to my broker databases EURUSD M5 . It uses pivot and Support/Resistance Levels. Stoploss and Takeprofit can be adjustable by user. ( for optimizing ) Input Parameters: MagicNum: Expert will use this number to determine experts orders. Lots: Lots amount which you want to use. Default is 0.01 ( it can be cahnged by expert due to you

Psr1 EA is the one of Psr series EAs. It works on 5 minutes chart only. You can use this EA any currencies but you should optimize first. Default parameters belongs to my broker databases EURUSD M5 . It uses pivot and 2 main moving averages. Moving averages can be adjustable by user. ( for optimizing ) Input Parameters: MagicNum: Expert will use this number to determine experts orders. Lots: Lots amount which you want to use. Default is 0.01 ( it can be cahnged by expert due to your broker's

How it works? This EA trades with Stochastic Signal Line and Base Line crossovers. Stochastic will base its value on the current time frame. Only allows one open trade at a time. Two strategy to choose, crossover and trend following. Optimize risk management settings for lot size and martingale. Strategy: Crossover Opens a buy position if the Signal Line crosses below Base Line and base line is below the Buy below crossover level. Opens a sell position if the Signal Line crosses above

The indicator bounds the price according to a cyclic wave dependency using moving averages. Thus, all the crossing points, in which the movement is changed considering the indicator period, are the optimal ones. The crossing points can be used as the potential market reversal points. However, do not forget about the complex approach: the indicator signals require additional data to enter the market.

The WiseBW indicator simplifies decision making by recognizing turns using the built-in algorithm, and then confirms signals at support / resistance levels. Thus, the indicator tracks the market trend with unsurpassed reliability, ignoring sharp market fluctuations and noise around the average price. The indicator can be used both for pipsing at small periods, and for long-term trading. Options: updown - offset pips for indentation of icons; back - how many bars to take into account; CountBa

SST Expert Adviser is a fully automated EA that uses a revolutionary Grid algorithm together with support and resistance zone
Real test: www.myfxbook.com/members/seng55/sst-expert-adviser/3054181
Set file: https://www.mql5.com/en/market/product/34702#!tab=comments&page=1&comment=10392694 Recommendations EA Settings : Use default settings or set files. Symbol : EURUSD USDJPY or Any. Time Frame : M15. Brokers : ECN brokers, low spread/commission, 1:500 up leverage , non-FIFO or FIFO. Trading Cond

Expert works H1 timeframe only There are two main criteria. Daily pivots and moving averages. To open a buy order, today's daily pivot must greather than the day before's daily pivots. Moving averages for EURUSD pair as default. They can be changed for other pairs and also for EURUSD too. You can also change takeprofit and stoploss level. expert doesnt trade on mondays and before 2 hour on other trade days. You can test and optimize for all pairs with extern parameters. Do not purchase without

Пинбар — это лишь 1 свечка или бар, представляющая собой цену, что отскочила от максимального или минимального ценового уровня. Свечка открылась, цена пошла в одном направлении и затем резко развернулась за период свечи — так формируется пинбар. Пинбар легко заметить — длинная тень (хвост), маленькое тело. Запомните: не все свечи с длинным хвостом являются пинбарами. Только когда хвост намного больше тела свечи, формируется пинбар. Как правило, рынок при этом закрывается там, где открылся или по

Neversys is a Scalping Trading and Intraday Trading. Neversys uses predictions and predictions using artificial intelligence algorithms. In this way, the professional higher law has lost its luck.
EURUSD does a practical, historically important job. Download the demo yourself. My tests were 90 days of accuracy, actual spread, extra slip and high visibility date of actual ticks. Also tested on MT4 Strategy Tester. Can be found here
The recommendations are as follows
optimized for the EUR / US
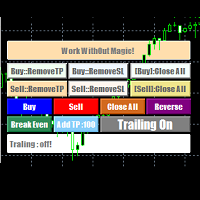
EasyAgent Trade Tool.This is not an automatic trading robot (EA) and it doesn’t take decisions or opens position, but it helps your work when you trading manual work with Strategy Tester and you can control trade via magic number. The following functions are available: Order opening in one click. Order closing/deleting in one click. Modification of Stop Loss and Take Profit using a mouse. Closing all orders based on their type. Order reversal. Breakeven function. Trailing Stop function.

Trend çizgileri, forex ticaretinde en önemli teknik analiz aracıdır. Ne yazık ki, çoğu tüccar onları doğru şekilde çizmez. Otomatik Trend Çizgileri göstergesi, piyasaların trend hareketini görselleştirmenize yardımcı olan ciddi tüccarlar için profesyonel bir araçtır.
İki tür Trend Çizgisi, Boğa Trend Çizgisi ve Ayı Trend Çizgisi vardır.
Yükseliş trendinde, Forex trend çizgisi, fiyat hareketinin en düşük salınım noktalarından geçer.
En az iki "en düşük düşük"ü birleştirmek, bir trend çizgisi o
The UpDownSignals indicator is designed to identify entry and exit points for a deal. Using it is very simple: when an up arrow appears, open a BUY deal, when a down arrow appears, open a SELL deal. The indicator gives accurate and timely signals for entry and exit, appearing on the current candle between the time the candle opens and closes. The indicator works on the basis of MACD, candlestick patterns and proprietary algorithms.
Indicator inputs: period - indicator period enableAlerts - Ena

Most of those who trade in Forex are aware of the Elliott Wave Analysis System. So what is this wave analysis: This is the study and analysis of price, and not its derivatives (various indicators); The ability to determine price targets using Fibonacci tools (Elliott waves are closely related to Fibonacci numbers). You can get a clear picture of the market at all time scales; With EWA, it is possible to build a trading system with a clear description of the inputs and outputs. For simplicity, t

How it works? This EA trades with Fast MA and Slow MA crossovers. Moving Average will base its value on the current time frame. Only allows one open trade at a time. Two strategy to choose, crossover and trend following. Optimize risk management settings for lot size and martingale. Strategy: Crossover Opens a Buy position if the Slow MA crosses below Fast MA. Opens a Sell position if the Slow MA crosses above Fast MA. Trend Following Opens a Buy position if the Slow MA is below Fast

This mutlitimeframe indicator is based on my own indicator wich shows trends at a early stage . You will see the trends from M1 to Month timeframe . The more the value is high ,the more the trend is confirmed .The values above 100 determine a high trend . Medium trend : 50 <=Value<100 No trend : 50<Value You can set alert for each timeframe and for your own value . Meaning of the parameters: M5|1: .....is the indicator's value on the 1st bar for M5 timeframe M5|2: .....is the indicator's va

Alpha Multi Scalper is a fully automated Expert Advisor. The strategy of this system consists of two mechanisms that work together between scalping strategies and multiple currency pair strategies . Based on the principles of predictive analysis of market price factors and price fluctuations that help determine trends and identify price patterns can help to see better opportunities for trading to make a profit. And diversify risks by trading multiple pairs at the same time. This system model li

https://www.mql5.com/en/users/earobotkk/seller#products FIBO ARROW This indicator draws a Fibonacci Retracement based on daily time frame. It draws arrows, sends pop-up alert and phone notification whenever price crosses Fibonacci levels. This tool is useful for users who trade with Fibonacci. INPUT ON Alert: set to true will pop-up alert whenever arrow appears. ON Push: set to true will send phone notification whenever arrow appears. ===== FIBO(High & Low)===== Time Frame: Fibonacci is drawn f

FAD Expert Advisor The FAD Expert Advisor works by entering a trade with the trend. ATR_Multiplier and MA_Period are used in the calculation to determine if we are entering a trend. SL_Multiplier is used for exit or the Auto SL feature that will move your stop loss with the MA. SL_Multiplier can be set to 0 for no stop loss. Works on all time frames and pairs. Suggestions: No EA should be left alone. Human intervention is a must. Settings: MagicNumber: Magic Number used for orders ATR_Mult

Harika bir sinyal buldunuz, ancak bir sağlayıcının lotu çok mu küçük? Daha büyük konum hacmine ihtiyacınız var, ancak terminal ayarları çok mu zayıf? Signal Lot Manager, sağlayıcının pozisyon hacmini, ihtiyaç duyulan hacmin mükerrer sırası aracılığıyla artıracaktır. Sadece siparişleri kopyalamak için bir lot boyutu ve bir sinyal adı belirleyin. Signal Lot Manager, terminalinizde siparişleri çoğaltmak için bir lot çarpanı yardımcı programıdır. Kaynak herhangi bir danışman, manuel ticaret, ayrı bi
Expert Mathematical Pattern is a multi-currency robot that trades on the M30 period.
Trading strategy:
The expert works on the M30 period.
The expert uses patterns in his work.
The pattern denotes regular regularity.
An expert in history reveals the patterns of the market, in which days and at what time the market repeats its movement in one direction or another.
This expert does not require additional optimization. It is automatically optimized during trading by performing the necessary

Dream Wall Street It represents the visualization of support resistance levels. the indicator marks the levels that are formed on a candle whose tick volume exceeds the average volume; it is perfect as it is without filters for scalping by level it can also be used as an addition to an existing trading system. The indicator can be used as a filter. It is already set up to configure anything for you. Settings allow you to customize the light levels

The Bad Boys indicator is a arrow indicator percentage (of positive trades) of correct forecasts of the indicator, even during news releases, the indicator was tested on a real account and showed a good result of correct forecasts. Settings allow you to customize the color of the arrows. volatility period indicator period the number of bars for which the market analysis will be carried out price is the method when a signal will appear when opening when closing a candle, etc. volatility allows yo

A trend indicator that shows the direction of pivot points. It can be used with an optimal risk to reward ratio. The probability of a success trend is very high. The indicator uses arrows to show favorable time to enter the market and market entry directions. Uses only one adjustable parameter (a value from 1 to 3). Take profit is much larger than stop loss! The indicator works on all currency pairs and time frames.

Are you using Awesome Oscillator? Wonder at which High and Low prices this indicator colored Green? Red? This indicator helps you determine those limits. GET 20% OFF for renting for 1 year! Yellow line is called Upper Line, and Red line is Lower Line.
BUY SIGNAL In this case, last bar's AO color would be colored Green.
Both Open and Low Price above the Lower Line. Close price crosses the Upper Line from below.
SELL SIGNAL In this case, last bar's AO color would be colored Red. Both Open and Hig

Broker Broker is a self-taught advisor. The algorithm of this adviser is constantly adjusting to the trading dynamics of the market. Advisor has a minimum number of parameters, which facilitates the work of beginners in the foreign exchange market. Advisor Benefits works on any time period works with any trade symbol no parameters that need optimization on each transaction, the adviser learns and adjusts to the current trading situation
Advisor Parameters lot_persent = 10 - the volume of a trad
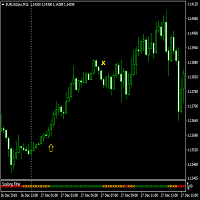
Advanced Scalping Filter to be used on any major currency pair. Designed for the 15 minute time-frame, however the filter should also work efficiently on the 5 minute time-frame. This filter takes into account various conditions of MACD's, Moving Averages, as well as current price positioning, to produce recommended buy, sell, or exit signals (as green for buy, red for sell, and orange for exit). Ideal for quick 10 pip profits or for exit signal to occur.
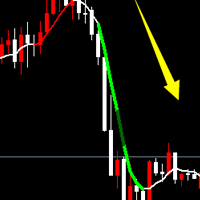
This indicator is suitable for long, medium and short-term foreign exchange users.
Suitable for trending technology users
Have a strong judgment and guidance
Need to combine the MACD indicator to find a specific entry location
How to use: The best approach conditions are MACD cross-average color change, find the callback position to enter the field to do the homeopathic, find the resistance level in the big cycle to protect the damage
Simple, intuitive and practical, suitable for foreign ex

This simple utility EA designed for managing the open trades. For all open trades when the certain amount of profit is reached it closes a part of the position and moves the Stop Loss to breakeven level.
EA has following entry parameters: - Scale-out lots: defines the size of the position that we want to close when profit is reached - Scale-out profit: defines the profit in points when we want to scale out - Breakeven profit: defines how many points above/below breakeven value we want to put

With the SR Dashboard, you get a powerful tool to control some of the most important information in trading. Assemble a setup according to your strategy and get informed as soon as this setup is valid. Assign scores to defined conditions and let the Dashboard find them. Choose from Trend, Average Daily Range, RSI, Moving Averages, Pivot (Daily, Weekly, Monthly), Highs and Lows, Candlestick Patterns. Note: This indicator cannot be used in the Strategy Tester. The demo version here from the marke
DoubleUp System is created as trade assistance, manager and profit-enhancing Utility. It is NOT to trade for you but helps you maximize your trading.
It has 10 On-Chart Buttons for various trading operations and setting parameters to manage your orders. like its name, it doubles and increases your profit targets with just a few pips distance by opening 4 pending orders or 1 Instant orders with 3 pending orders (depending on the situation of the market at the time)
If your trading system can gu
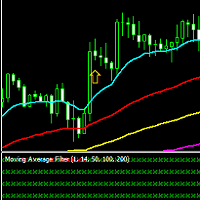
This is a filter of various moving average combinations used to give a higher level of confidence to trade entries. The indicator may be used with moving averages on the chart or independently by itself to show the current trend direction. Trade signals of the Moving Average Filter are based on the Price (1EMA) vs the 14EMA, the 14EMA vs the 50EMA, the 50EMA vs the 100EMA, and the 100EMA vs the 200EMA. Trade signals are produced when all of the filters are in alignment, thus showing all green or

If you need an adviser who often bargains and opens deals almost every day, you went to the address. Trading every day is intended for frequent trading for a long time. In this case, the adviser opens no more than one transaction in each direction. When there are a lot of deals in optimization, more often it will give more profit in real life than advisers who, during optimization, make fewer deals, but show high profitability.
This Expert Advisor is based on the indicators Williams Percent Ran

The RSI MultiCross Expert Advisor works by entering a trade when RSI makes a cross of a level and exits on the cross of the opposite level (MIN_RSI, MAX_RSI). To enter a buy RSI will cross below the MIN_RSI and the candle that closes above MIN_RSI will signal to enter the trade. This allows the EA to get some indication price could be reversing (vice versa for a sell signal). To exit a buy RSI will cross above the MAX_RSI minus the RSI_Buffer. Or you can use the TP_Multiplier or SL_Multipliers

"It's not about how much you do, but how much love you put into what you do that counts." - Mother Teresa
This Indicator is build on value of Relative Strength Index and Moving average of relative strength Index. We have calculated bands with respect to Moving average of Relative strength Index. Trading strategy: https://www.mql5.com/en/blogs/post/725691 Why use Rsi Ma Bands? Great for novice traders as well as experienced traders. Low risk entries. Doesn't repaints.
No additional Indicato
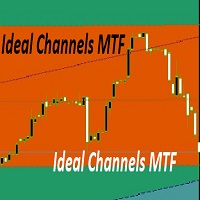
trading indicator, which automatically recognizes equal levels of support and resistance and otorova content and resistance and poison indicator uses elder system can be applied to any financial instruments and on any timeframes. the same indicator draws to. it is perfect for scalping as its essence is to trade in the channel. The indicator has many parameters that allow it to be conveniently customized. indicator settings filter - it filters the market noise that is, we get more accurate channe

Only EA developed over 1 year ago, which remains consistent in the market and in the #10 Top of the MQL Store
>>> You can use this EA with a balance starting at $30 in a cent account. Doubts about which broker and how much balance you need to trade, send me a message <<<
Summary:
Samurai Scaper Pro Series EUR/USD is an EA developed to run the EUR/USD on 5 MINUTE timeframe. This EA uses statistical analysis applied to the EUR/USD over 20 years to determine the best points of e

The DYJ MacdSto is a unique High quality and easy to use and affordable trading tool because we have incorporated a number of proprietary features and MACD and Stochastic and RSI and ADX indicators. The main advantages of the trend trading strategy used by the Expert Advisor are opening positions only in the direction of a trend, ability for the long-term retention of profitable positions allowing users to achieve good combinations of profit/loss distributions. DYJ MacdSto EA uses MACD and Stoch

I n the tester does not work, see how it works in the video; sorry for the inconvenience. UTB is done for real-time work quotation when trading.
indicator draws resistance support levels Also, when a level appears, an arrow appears where to open a deal. You will not miss any desired level approach. The indicator showed good results on all graphs and time frames. recommended settings step 1800
p.s
traders selling from wall street also use resistance support levels in their analytics how do tra

Esta es una de las modificaciones de los canales Keltner. Ayuda a identificar puntos de entrada y salida lógicos. Ayuda a determinar un posible movimiento de precios. Crea canales equidistantes que se convierten en niveles de soporte y resistencia dinámicos. Facilita enormemente el análisis del mercado visual. El indicador es un multi-tiempo multi-tiempo muestra buenos resultados.

Grid Hero War Pad is a GRAPHICAL MANUAL TRADER version of the original Grid Hero EA, designed and created for ADVANCED TRADERS who are experienced in plotting their own market entries. It is coded using ADVANCED GRAPHICAL INTERFACE programming, that combines the power of discretionary trading with Grid Hero algorithm in the form of a graphical console with button-click easy execution.
It allows you to execute trades manually using Market Orders and Pending Orders, and then automatically uses th

Торговый робот PROF 2 не торгует по тренду. Всем известно, что 80% времени рынок находится в боковом движении и лишь 20% это направленные движения. Поэтому данный робот пытается поймать коррекции после сильных движений. В данной версии не используется STOPLOSS , вместо этого типа ордера стоит другая защита от потерь. Если, по мнению робота коррекции все- таки не случится, то позиции закрываются. Параметр Stop отвечает за контроль над рисками и закрывает все сделки, в том случае если плавающий

MAD - Moving Average Distance The MAD Scalper Expert Advisor uses ATR and the distance to a moving average to determine if price has the potential for reversion (mean reversion). Trades are closed when price returns to mean (moving average) + buffer. We use ATR as our MA_Buffer. MAD includes an averaging feature. The range is determined by ATR and the RangeMultiplier. The higher the RangeMultiplier the further apart the averaging trades will be. Works on all time frames and pairs.
Suggestions:

The indicator is based on several useful indicators in the multi time frames that help us chart and table and alert.
The various parameters used in this indicator and the default ones are as follows. · Moving Average Mode: LMMA · Moving Average Period One: 4 · Moving Average Period Two: 8 · Moving Average Period Three: 15 · Moving Average Period Four: 30 · Moving Average Period Five: 80 · Moving Average Period Six: 150 ·
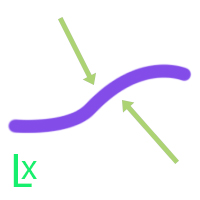
The EA monitors the closing price of the recent candle and its distance towards Moving Average Line. If the price has been stretched too far from the MA. The EA will place a market order towards the direction of the MA. For an instance, if a candle is closed above MA more than 80 pips, the EA will open a Sell Market position. The EA will conclude its position in two ways; 1. The first position goes directly towards MA line and touches it, triggering an exit by the EA in profit. 2. The price g
The new version of MirrorSoftware 2021 has been completely rewriten and optimized.
This version requires to be loaded only on a single chart because it can detect all actions on every symbol and not only the actions of symbol where it is loaded.
Even the graphics and the configuration mode have been completely redesigned. The MirrorSoftware is composed of two components (all components are required to work): MirrorController (free indicator): This component must be loaded into the MASTER

MOVING AVERAGE BANDS / MA BANDS: This is an very simple Indicator but very powerful in identifying trend reversal.The calculation of moving Average bands consist of defining the range of bars and the multiplier we use. -To find range of n bars we used the values of moving average high and low values of n bars. -Then we used individual multiplier for individual bands. -The multiplier we defining can be based on your style say for example some needs moving average fibonacci bands or dynamic fibona
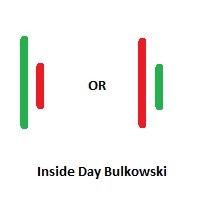
Inside Days Candlestick Bulkowski Inside Days Candlestick Bulkowski The Inside days candlestick is a well-known candle pattern composed of two candles. This indicator for showing outside days candlestick that describe by Thomas Bulkowski.
If you need for MetaTrader 5 version, please visit here: https://www.mql5.com/en/market/product/34724
Feature Highlights Show inside days candlestick. Customizable "Symbol". Customizable symbol distance from candlestick.
Input Parameters Symbol - Input sym

Эта утилита поможет вам рассчитать прибыль в валюте депозита, если цена пройдет от своего текущего значения к значению, указанному горизонтальной линией ProfitMeter. При запуске индикатора эта линия автоматически создается на уровне текущего значения цены. Линию следует выбрать и переместить на нужный вам уровень. Расчетное значение прибыли при входе в рынок минимально возможным лотом отображается в правом нижнем углу окна графика. Входные параметры Style of ProfitMeter Color of ProfitMeter Widt

HyBridBot
https://www.mql5.com/en/users/earobotkk/seller#products
HyBridBot trades at trending market utilizing money management which includes percentage of risked money, reward to risk ratio,stop loss and take profit. It applies our hybrid strategy with capital protection should the market not going in our favor. INPUTS TRADE COMMENT: user trade comment. Magic No: trade unique number for this robot. Time Frame: default is H1. Percent Trade Risk (%): percentage of account balance or free marg

Must read : THIS EXPERT ADVISOR ONLY OPEN TRADE WITH WELL DEFINED, TESTED AND ROBUST ALGORITHM.
From the result of 18 years backtest shown on the screenshot, make sure you calculate or check: Total trade;
Monthly trade expected;
Consecutive gain; Consecutive loss; Net profit;
Monthly net profit.
While observing the performance of the EA, its update will be carried out from time to time.
Thus is a fully automated expert advisor that scalp when there is relatively large price movement in market a
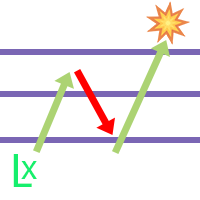
The EA utilizes 3 levels grid to capture any direction be it bullish up or bearish down, either way, the EA will end in profit. The EA is called fury as it cuts a very tight loss and immediately compensates the loss into new lot size calculation on the remaining positions. If the initial lot size of level 1 is 0.2 and the EA cuts it at loss at 10 pips, the next lot size will be 0.24 lot (depending on multiplier setting). There will be 3 Buy Stop orders above mid-level, and 3 Sell Stop orders bel

from the price of 200$ to 170$ only 1 Month !! Only for the symbol of EURUSD Time Frame D1 Minimum Balance $5 Update all Timeframes starting from TF M1, M5, M15, M30, H1, H4, D1, W1, MN1 Make sure to use a low spread below 10 Points and use a 5 digit broker broker
! Please do not mix with other transactions, so that too many transactions exceed the maximum number of broker orders
PARAMETERS
LOT = Balance : Compounding Ex: Balance $1000 Compounding = 10000 Lot Order =1000 : 10000 = 0.1 Lot Mag

This EA combines two built-in combined indicators (RSI breakout and Envelopes) to check the trends before performing any trading action. It's engine is provided with: trailing Stop Loss; bad time to trade filter for each day of the week; define in minutes the profitable orders duration; enable and disable martingale mode; define the maximum spread value to trade; define the minimum equity percentage to allow trading; the input values are already optimized for EURUSD at timeframe M1. The Strategy
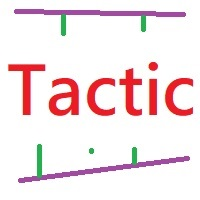
Auto tactic trade with two Lines:
They are (Top Line) and (Bottom Line), for tactic trade.
Big Features: Line will be auto created and detect the Top of shape, and Bottom of shape. Display how far the Line from market price. When Market Price *Touch (Top Line), will create a new order : **Sell**. When Market Price *Touch (Bottom Line),will create a new order:**BUY**. Moving the Lines:
Double Clicks on Line,it will be movable by User's Mouse. You can let a Line longer by Double Clicks on

Edward Teach Forex This is an expert Advisor for short-term trading using a series of orders with their averaging and subsequent increase. The EA trades in both directions, choosing a more suitable side in the trading process. Hidden profits and virtual trailing stop are used.Also, the EA has the ability to stop trading (not to open new orders) before important news, both during manual installation, and receiving information from the indicator "News provider" . There are several logics that imp

Hello friends, WaveKing is a piece of automated Forex trading Robot that automates trading decisions. EA was designed to open trades every day.The EA contains two strategies, one shock strategy and one trending strategy. Each order has a stop loss. No martingale , hedging or scalping .It's a unique EA that is totally based on market and price action. Default inputs apply to EURUSD(M1) . For testing deposit 5000+ USD . Monitoring of the Expert Advisor: https://www.mql5.com/zh/signals/518243 Re
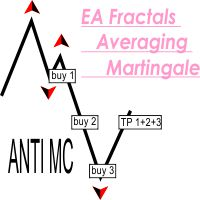
This EA successfully opposes the Fractal below then OP BUY otherwise if the new Fractal appears above then OP SELL If the wrong position will add a new transaction, and take profit at the same point This EA can run in two different directions (Buy will be counted separately from Sell orders) #Recomend Start Balance $1000 Flat movement is very good for work.
PARAMETERS Lots : Lots / volume orders Multiplier : Multiplier value of lot, You can use a small multiplier of 1.2 1.5 1.7 while Take Profi

This EA successfully opposes the Fractal below then OP BUY otherwise if the new Fractal appears above then OP SELL Flat movement is very good for work.
PARAMETERS Lots : Lots / volume orders TakeProfit : Take Profit Point if zero = No Take Profit StopLoss : Stop Loss Point if zero = No stoploss TF : Time Frame Fractals AutoStopLoss : If true , then StopLoss will be created automatically on High / Low Fractals
These EA fractals are simple EAs, it might be suitable to be tested on a currency pa

Robonacci is an intelligent robot that seems to understand the inherent nature of the market EURUSD very well. It uses Fibonacci Retracement levels extensively to determine potential support and Resistance levels. Although it uses levels for entry position, it’s main focus is to stay with the trend as long as possible. In its underlying strategy it uses “Cut the loses early and let the profit run” which is why it has a low winning rate. The robot uses four different market conditions: Ranging, T

The EA opens orders, when a fast MA crosses a slow MA:
Buy - from bottom to top, Sell - from top to bottom.
It provides for closing orders on breakeven and trailing stop.
It is also possible to open additional orders when the price moves towards the open position.
Settings: MagicNumber - order identifier; StartLot - lot size; SL - is the size of SL in points; TrailingStop - trailing stop size in points; Breakeven - breakeven; LevelBreakeven - breakeven size in points; LevelBreakevenProfit -

MoneyMaker v2
This expert advisor is based on idea that market produces very strong movement to opposite side once trend reversal is imminent. So our core trigger is bar size relative to previous bars optionally filtered by Bollinger Bands, Money Flow Index, Simple Moving Averages and Commodity Channel Index. MoneyMaker v2 also implements autolot based on free margin / Risk per single order (in %) parameter. Spread filtering is done through Minimum bar body size / pair spread multiplier (in po
MetaTrader mağazası, geçmiş verilerini kullanarak test ve optimizasyon için alım-satım robotunun ücretsiz demosunu indirebileceğiniz tek mağazadır.
Uygulamaya genel bakışı ve diğer müşterilerin incelemelerini okuyun, doğrudan terminalinize indirin ve satın almadan önce alım-satım robotunu test edin. Yalnızca MetaTrader mağazasında bir uygulamayı tamamen ücretsiz olarak test edebilirsiniz.
Alım-satım fırsatlarını kaçırıyorsunuz:
- Ücretsiz alım-satım uygulamaları
- İşlem kopyalama için 8.000'den fazla sinyal
- Finansal piyasaları keşfetmek için ekonomik haberler
Kayıt
Giriş yap
Gizlilik ve Veri Koruma Politikasını ve MQL5.com Kullanım Şartlarını kabul edersiniz
Hesabınız yoksa, lütfen kaydolun
MQL5.com web sitesine giriş yapmak için çerezlerin kullanımına izin vermelisiniz.
Lütfen tarayıcınızda gerekli ayarı etkinleştirin, aksi takdirde giriş yapamazsınız.