 MetaTrader 5
 Uzmanlar
 Göstergeler
 Kütüphaneler
 Yardımcı programlar
 Widgetlar
 Kurallar
YouTube'dan Mağaza ile ilgili öğretici videoları izleyin
Bir alım-satım robotu veya gösterge nasıl satın alınır?
Uzman Danışmanınızı
sanal sunucuda çalıştırın
sanal sunucuda çalıştırın
Satın almadan önce göstergeyi/alım-satım robotunu test edin
Mağazada kazanç sağlamak ister misiniz?
Satış için bir ürün nasıl sunulur?
MetaTrader 4 için Uzman Danışmanlar ve Göstergeler - 151
 Alım-satım robotları piyasalarda otomatik olarak işlem yapar, göstergeler ise fiyatları analiz etmek ve fiyat değişikliklerindeki kalıpları belirlemek için kullanılır.
Bu alım-satım uygulamalarıyla, MetaTrader 4'te daha bilinçli alım-satım işlemleri gerçekleştirecek ve daha fazla alım-satım fırsatı yakalayacaksınız.
Alım-satım robotları piyasalarda otomatik olarak işlem yapar, göstergeler ise fiyatları analiz etmek ve fiyat değişikliklerindeki kalıpları belirlemek için kullanılır.
Bu alım-satım uygulamalarıyla, MetaTrader 4'te daha bilinçli alım-satım işlemleri gerçekleştirecek ve daha fazla alım-satım fırsatı yakalayacaksınız. 
OBV Divergence Formation (hereinafter "Diver") is based on On Balance Volume technical indicator (OBV) that is a momentum indicator that relates volume to price change. Classic (regular) and Reversal (hidden) Divergences - at your choice. Adjustable sizes and all parameters Flexible settings including VOID levels (additional alert function, arrows on price-chart show in which direction to trade) No re-paint / No re-draw (set CalcOnOpenBar =false) "SetIndexBuffer" available for all variable

The VR Alert indicator utility is designed to inform the trader when the price reaches the given level. The signal levels can be set not only horizontally but also inclined. Thus, the trader gets the opportunity to receive notifications from the inclined trend levels. Thanks to the VR Alert utility, you will no longer need to sit near the monitor for a long time. You can calmly do about your household chores, perform your work duties and spend time with your family. Your task is simply to set th

The MACD Turbo indicator provides a highly configurable enhanced MACD indicator with histogram, push notifications, pop-up and email alerts. Traders can customize the MACD calculation parameters to meet their needs and also control the alert system based on their requirements. The alert module produces alerts when the MACD line crosses the 'Watermark' or zero level and also when the MACD and Signal lines crossover. Traders can choose the nature of the crossover modes which can be 'Printed' - whe
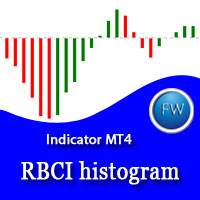
The RBCI hist indicator is an adaptive trend histogram, that eliminates noise using a Low-pass filter, which passes the lower frequencies and cuts off hight frequencies of the price fluctuations. The signal (depending on the strategy chosen by trader) is the intersection of the zero line by the indicator, as well as the change in the histogram color. The change in the histogram color serves as an early signal for opening positions towards the trend. The position of the indicator relative to the

Hello, I am Ayman from Egypt, I want to present an interesting indicator to you. It depends on Ichimoku Kinko Hyo, but there is a secret that i use in it. By using my indicator, you will be able to know a lot of important information in the market such as: Live Signal : https://www.mql5.com/en/signals/821024
Features You can avoid entry during market turbulence You can enter orders on the general trend only You will know if the trend is strong or weak If you entered an any orders by the help of

The indicator displays trend strength, including showing the transition from buy to sell and visa versa. It is ideal for trend following strategies and also highlights possible reversals/flattening trend with a yellow X on the indicator window. By default, the indicator does not repaint/flicker, however, there is an option to calculate on the live candle but even then the indicator will not repaint unduly. The indicator can also be used for exit.
Usage Enter long/buy trade when the indicator tr

Divergence Formation BBands (hereinafter "Diver") is based on Bollinger Bands Technical Indicator (BB). Classic (regular) and Reversal (hidden) Divergences - at your choice. Adjustable sizes and all parameters Flexible settings including VOID levels (alert function in place, arrows to show in which direction to trade) No re-paint / No re-draw (must set CalcOnOpenBar =false) "SetIndexBuffer" available for all variables (can be used in EA) Auto-detect 4- and 5-digit price function Lite (does not
This is a medium-term conservative system. It tracks quote movements and defines entry points. The Expert Advisor is completely automated and features the unique algorithm. It has been designed for trading CHFJPY, EURCHF, and USDJPY.
Features It does not use Martingale; No grid; No scalping; No excessive parameters; Fixed lot; No complicated settings. Trades are usually opened infrequently. Orders may remain open for a few days for obtaining greater profit. Amount of trades per month – from 5 t

Divergence Formation Hurst (hereinafter "Diver") is based on Hurst exponent used as a measurement of long term memory of time series. Classic (regular) and Reversal (hidden) Divergences - at your choice. Adjustable sizes and all parameters Flexible settings including VOID levels (alert function in place, arrows to show in which direction to trade) No re-paint / No re-draw (must set CalcOnOpenBar =false) "SetIndexBuffer" available for all variables (can be used in EA) Auto-detect 4- and 5-digit p

System Introduction Fx TrendRider is an amazing EA that takes pips as easy as the market itself because it rides with the trends and masters the trend direction and market conditions as it is at any point in time.
Money Management The default lot size setting is 0.10, you can start with that first and see how it goes, then you can increase your lot according to your account balance but do not trade with the money you cannot afford to lose even though with time, you will discover that you can us

PipsMinerFast is mainly a trend follower with a bit of price action. At first sight, you will think: "Oh well, one more indi showing everything I've missed today but not giving a clue about what will happen..." Okay, you can believe this when just looking at it but start a test it and you will see that PipsMinerFast: Shows you the trend immediately Is not repainting Has minimum lagging Counts pips immediately Adapts to your spread level Works from M1 to H1 Is heading in the right direction 90% o

Interceptor - professional volume and price extremes indicator. Interceptor is a powerful indicator, which thanks to a combination of four different types of normalized indicators in one algorithm can correctly identify extremes of the price leading to retracements and reversals in the trend. Algorithm is based mainly on combination of Accumulation/Distribution , On Balance Volume , Money Flow Index and Relative Strength Index . The first parameter of Interceptor is Interceptor_Depth which defin
WindFlow is a powerful solution for manual traders that will drive your trading decisions in no time. I designed this indicator taking into account three main concepts: momentum, break of recent trend and volatility. Just like the wind's flow any trend can have small correction or major change in its direction based on the main trend's strength, so at glance you can have a very good idea on the next "wind's direction" when you look at your charts.
How to properly use WindFlow? WindFlow is the p
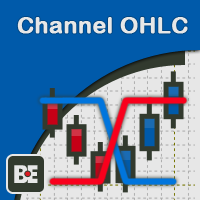
The creation of this indicator was inspired by the phrase of the famous trader Michael Covel "Price is the best indicator in the world". Not everyone is able to see the market through the eyes of a professional. Probably an indicator that does not distort the price and visualizes what is happening on the market can help you. Indicator "BE Channel OHLC" has been created for this purpose. The indicator name has not been chosen by chance. The indicator draws a channel using OHLC prices (OPEN, HIGH,

And stop and reverse MT4 is a trend Expert Advisor which uses no indicators.
Trading Strategy: And stop and reverse MT4 trades any currency pair and any timeframe. The strategy is based on accompanying an open position with a trailing stop and reversing it when the trailing stop triggers. The first position is opened with the triggering of the Buystop or Sellstop order above and below the current price. On Friday at 23:00 terminal time all positions and orders are closed for the weekend. Additi
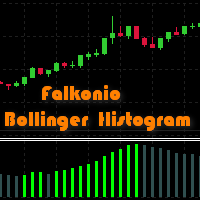
The histogram of the difference between upper and lower levels of the Bollinger Bands. Growth of the histogram means the expansion of the range on a trend interval, reduction means the narrowing of the range during corrections. The histogram is colored: the bullish trend areas, the bearish trend areas and corrections areas are displayed with different colors. Like other trend indicators it gives clear signals, but with delay. There is additional information about the color changes (change or end

We present our totally unique Expert Advisor "Expert trend one point": the EA trades within a trend, it contains a complex strategy (named "one point profit"), does not use stop loss, does not use an adjustable take profit, it adjusts the take profit per one point of profit. The EA works with four or five-digit prices. You can use the Expert Advisor on any currency pairs, however it is recommended to choose symbols with low spread and low stop levels. The EA can work on timeframes M1 , M5, M15,

Mr. Averager MT4 is a Expert Advisor for the MetaTrader 4 trading terminal. The trading algorithm is based on the principle of position averaging. Due to averaging, the EA is not sensitive to the quality of entry points and can work almost at any time and in almost any market. The EA supports 2 trading modes: Automatic start and Manual start. In Automatic start mode, the EA independently starts a new series of orders. In Manual start mode, the first order of the series is opened manually using
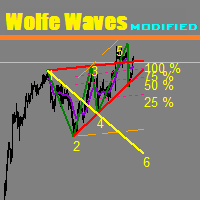
This unique indicator automatically builds Wolfe Waves.
Features Finds the points and builds the lines automatically. Efficient trading strategy. No redraws, no lags. The indicator relaunch button is located directly on the chart. The indicator has multiple configurable parameters.
Use If number 5 appears, wait till the first candle is closed behind Moving Average, then look at the three center lines showing what lot volume should be used if the fifth dot crossed the line 25%. The candle is cl

Divergence Formation Momentum (hereinafter "Diver") Classic (regular) and Reversal ("hidden") Divers - at your choice: Adjustable sizes and all parameters Flexible settings including VOID levels (alert function in place, arrows to show in which direction to trade) No re-paint / No re-draw (must set CalcOnOpenBar =false) "SetIndexBuffer" available for all variables (can be used in EA) Auto-detect 4- and 5-digit price function Light (does not over-load MT4) In order for Regular Classic Momentum Di

Divergence Formation GDP (Gaussian or Normal Distribution of Probability) hereinafter "Diver" - is used for Fisher transform function to be applied to financial data, as result market turning points are sharply peaked and easily identified. Classic (regular) and Reversal (hidden) Divergences - at your choice. Adjustable sizes and all parameters Flexible settings including VOID levels (alert function in place, arrows to show in which direction to trade) No re-paint / No re-draw (must set CalcOnOp

Divergence Formation MACD (hereinafter "Diver") Classic (regular) and Reversal (hidden) Divergences - at your choice: Adjustable sizes and all parameters Flexible settings including VOID levels (alert function in place, arrows to show in which direction to trade) No re-paint / No re-draw (set CalcOnOpenBar =false) SetIndexBuffer available for all variables (can be used in EA) Auto-detect 4- and 5-digit price function Light (does not over-load MT4) In order for Regular Classic MACD Divergence to

Divergence Formation RSI (hereinafter "Diver") Classic (regular) and Reversal (hidden) Divers - at your choice: Adjustable sizes and all parameters Flexible settings including VOID levels (alert function in place, arrows to show in which direction to trade) No re-paint / No re-draw (must set CalcOnOpenBar =false) SetIndexBuffer available for all variables (can be used in EA) Auto-detect 4- and 5-digit price function Light (does not over-load MT4) In order for Regular Classic RSI Divergence to ex

The Trend modified indicator draws trend lines with adjustable trend width, with trend breakout settings and notifications of trend breakout (Alert, Sound, Email) and of a new appeared arrow. Arrows point at the direction of the order to open (BUY, SELL).
Parameters User Bars - the number of bars for calculations. Depth (0 = automatic settings) - Search area (0 = automatic adjustment). width trend ( 0 = automatic settings) - Trend width (0 = automatic adjustment). (true = closed bars on directi

Reversal Master helps you read the current direction of price movement and spot potential reversal points on the chart. It is built for traders who want a clearer view of the market situation before making a decision. You can use it as a standalone tool, as an add-on to a ready-made trading system, or as a building block for developing your own strategies. To locate reversal points, Reversal Master evaluates several market conditions at once, since combined analysis gives a more complete picture

This indicator shows the market entry and exit points. It is good for both beginners and professional traders. The product works on any timeframe and financial instrument. The indicator is designed for scalping. It does not redraw. It is based on the divergence between two moving averages, which have a special smoothing algorithm. The first moving average is colored in Magenta . It indicates the general movement of the trend. The second moving average is colored in LawnGreen . It appears on the
Pipfinite creates unique, high quality and affordable trading tools. Our tools may or may not work for you, so we strongly suggest to try the Demo Version for MT4 first. Please test the indicator prior to purchasing to determine if it works for you. We want your good reviews, so hurry up and test it for free...we hope you will find it useful.
Attention This trading tool is specifically designed to help grid, martingale, averaging, recovery and hedging strategies. If you are not familiar with th

The indicator is based on MA with additional processing of all the current prices, as well as all Highs and Lows for an appropriate period. The product efficiently displays trend changes and tracks a trend line and color if conditions remain unchanged. The indicator has only three parameters making it easy to configure.
Parameters PeriodTrend - amount of bars used for a trend calculation PeriodAverage - indicator line averaging period Method - averaging method

The algorithm based on strict adherence to the price movement (trend) and fixing of any slightest movement. To enter into the market, it uses the instant price movement of an instrument. The EA places Take Profit and Stop Loss to lock in profits and to limit possible losses. The Trailing Stop function allows to fix any sign of market movement. Aggressive scalper can work both with a fixed lot and using percent of deposit. It uses market orders. Does not use such trading elements as Martingale o

Price Trend Light indicator is a beautiful indicator that shows purchasing areas and sales areas. This indicator is designed to follow the movement of the price which rounds on the opening price. It also provides information of trend follow on the break of the minimum and maximum. The indicator has a very simple graphic but effective, above the opening price you will have a light green color and under the opening price there is a red light. On every Break Out of the minimum or maximum sets in in

This indicator based on Alpha Trend Spotter, Moving Average, and RSI Indicators. Its Customized for H4 (Four Hour) Timeframe where the price do real swing. This indicator doesn't have setting value, just plug and play in H4 Timeframe. Best performance with pairs: EURUSD GBPUSD EURJPY GBPJPY
Entry conditions: LINE CROSS ATS < 30, HOLD and then line TOUCHING BACK TO 30 = LONG ENTRY LINE CROSS ATS > 70, HOLD and then line TOUCHING BACK TO 70 = SHORT ENTRY
Exit conditions: LONG CLOSE IF CROSS ATS
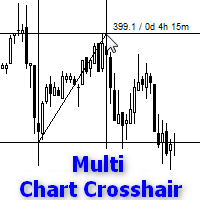
Indicator works like script and shows crosshair on all charts of any symbol. It can be used for comparison price levels and time periods on all charts of the same currency pair or for comparison candles according to time periods on charts of any symbols. You can also compare different types of charts, for instance standard chart with tick or range bar charts. Indicator can be easily attached to chart from navigator menu or using hotkey Ctrl + F, which you need to set manually. Moreover you can a

This is a grid Expert Advisor using EMA to filter a trend and CCi to enter the market. It allows you to manually filter flat and trend parts of the market or traded symbols. The lot is calculated based on the smart algorithm depending on the order location. The EA features the filter of the minimum distance between unidirectional orders calculated based on the specified percentage of the average daily candle for 21 days allowing the EA to avoid excessive load on the deposit. The profit is fixed

Reversal Breakout is a real breakout strategy. It is based on Moving Average indicator to define market trend and breakout points. Try to entry when price reverse is not good, because there are many false reversal signal, so that it is better to trade breakout at reverse point. This EA will work for all Timeframe, but I prefer to use it on H1 or above. Should use it on major pairs which are lowest Spread, and lowest Slippage: EURUSD,GBPUSD,USDJPY,GOLD,... No martingale No Grid Always use Stoplos
The indicator uses 2 Moving Average: 1 fast EMA and 1 slow EMA to define trend, reversal signal and breakout point. Reversal Signal comes on open time, it can be used as scalping signal for short time, but be careful with this signal because it may be an anti-trend signal, the indicator tries to catch reverse point. Breakout signal is where support or resistance was broken out, the reversal signal has failed. Breakout signal is stronger than the Reversal Signal. We can use support/resistance lev

The EA distinguishes a sideways trend from a directional one and changes its trading tactics. When an opposite signal appears, an opposite order is opened, covering the opposite ones. And changes the parameters opposite to close. The Expert Advisor is intended for trading only on foreign exchange market FOREX. Does not work on stock and commodity instruments. Recommended for use on variable periods M5, M15 and H1.
ADVISOR PARAMETERS: ID Expert Advisor - Magic number of the advisor. period FAST

Using high-volatility channel breakout-style trading systems has historically worked well across major currency pairs, show promise in determining the opportune time to trade the channel breakout trading strategy. This Breakout Strategy may look simple, but it is good follow trade trader strategy.
Setting: Channel Periods: default 20 BarsCount: bars count in history Alert_Settings = "+++++++++++++++++++++++" SendMailMode = true - Send email SendNotificationMode = true - Send notification to you

The indicator is based on Moving Average to define the trend, then it finds a good entry point and follows the trend. We will keep open on a new signal until the trend is changed, and all trades exit on an opposite signal. The exit point is a bit late relative to the highest profitable point (at top/bottom), but it is the best point to exit your trades. Keep the trades, which are moving the right direction to get a high profit, and stop wrong trades as soon as possible when the trend is changed

Trend Trade indicator is based on ADX indicator to define long/medium/short trend and good entry signals. The product supports virtual trade on chart to show where/when should we make an entry/exit. It works very well on D1 or above. The indicator is efficient on GOLD and CFDs. Alert_Settings = "+++++++++++++++++++++++" SendMailMode = true - Send email SendNotificationMode = true - Send notification to your phone AlertMode = true - Sound alert Show_Virtual_Trades = true - Show virtual trades Sin

i-Regression Channel generates regression channel: Linear regression channel consists of two parallel lines located at the equal distance from the linear regression trend line. The distance between the channel borders and the regression line is equal to the value of the highest close price deviation from the regression line. degree - degree of regression, changes from 1 to 61; kstd - regression channel width; bars - the number of bars for the channel calculation; shift - the channel horizontal s
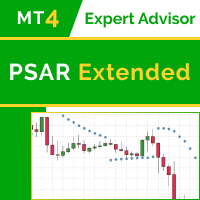
Main idea of this EA lies around the Parabolic SAR indicator. New version this Expert: PSAR Expert Extended 2 The advanced EA version includes the following changes and improvements: The free initial version has been analyzed and the EA algorithm has been improved The EA behavior has been monitored on various account types and in different conditions (fixed/floating spread, ECN/cent accounts, etc.) Cod optimization, bug fixes. The EA functionality has been expanded. Features better flexibilit

YF-Meter indicator help you to find the fastest speed up currency pairs.
While the US news are released, non-US currencies rising up or dropping down at the moment.
It is important to consider "the opportunity cost" of opening the positions.
If we can find the fastest rising up or dropping down currency pairs, that would improve our trading. This idea comes up with "Newton's laws of motion", different from the traditional volatility measurement.
After adjustment by the unique filter(the digital

Breakdown Velocity is a fully automated trading system, using which you'll never miss a trend or sharp price movement. The Expert Advisor uses custom indicators of trend growth and tick volume.
Main Features Low drawdown! Built-in money management Tight stops Protection against high level of spread Protection against slippage (to minimize losses and maximize profits) Non-grid system Not arbitrage. Does not fit results with historical data The maximum loss is no more than 60 points for a 5-digit
The indicator calculates WPR formula on volume-aware indicators Accumulation/Distribution , OnBalance Volume , or Price Volume Trend . WPR range is moved into positive domain [0..1] for convenience.
Parameters WPR - period of WPR, by default 24; Base - type of the underlying indicator: AccumulationDistribution (by default), OnBalanceVolume, or PriceVolumeTrend; Price - applied price type for OBV and PVT, by default - Close; it's ignored in case of AD;
Screenshots On the screenshots below the

The Expert Advisor opens orders from the horizontal line, the a trader can set on any level by dragging using the mouse or by changing the line properties. For example, when a horizontal line is above the current price, the EA will open a Buy order once the horizontal line is reached. And vice versa: If the line is below the current price, the EA will open a sell order once the line is crossed. A buy crossover of the line is: opening of the current candlestick below the horizontal line; the curr
The main rule of the profitable trading is opening trades in the direction of a trend. You can define the current trend using fractal analysis. The Important Zone ResSup indicator displays important price support and resistance levels on the chart. The breakthrough or bounce from those levels shows further price direction. The data panel allows you to track the current trends on all timeframes. The current timeframe's important level values are shown in the comments. The indicator can be useful

Standart göstergeler üzerinde çalışan çok çeşitli işlevlere sahip MetaTrader 4 için evrensel gösterge danışmanı. 1 Uzman Danışmanda strateji oluşturucu. Standart MetaTrader setinden çok sayıda alım satım göstergesi. 20 sinyalden 1'ini ve 20 filtreden 5'ini seçme imkanı. Gereksinimlerinize uyacak şekilde bireysel özelleştirme için yüzden fazla parametre. Her sinyal için gösterge parametrelerini özelleştirebilir, bir zaman çerçevesi seçebilir ve bir sinyal çubuğu belirleyebilirsiniz. Bağlantılar:
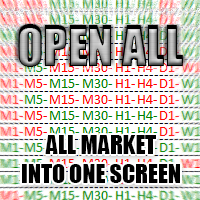
The Open All indicator uses a simple market information that is "Open Candle". This tool is able to show all the openings of all time frames in order to extract information of strength and trendy. You can display 28 instruments with relative time frame interior for a total of 252 informations. The display is fully customizable, you can choose either the symbol and enable/disable Time Frames. Using it correctly you could get valuable aid to intercept correlations and turning points in the market.
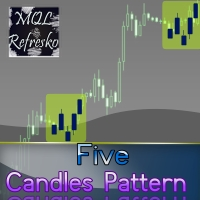
The "Five Candle Pattern" indicator is a novel way to see the market, because with it we can compare and/or seek training or the pattern of the past 4 or 5 Candles, and identify them in the same graph, to view your behavior at an earlier time. The indicator creates a pattern of those 4 or 5 candles and searches backward, identifies, and marks the same formation or pattern. With that information you adjust the strategy that is operating, or create a new one, because you can compare the past devel
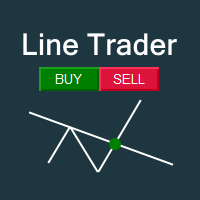
This EA you can automatically act on trend lines of your choice. You only need to draw a line and then press the buy or sell button. Suitable for traders the chart pattern (triangles, channels, spikes ...) act. The tool is also suited for quick and easy to set Pending Orders.
Input parameters Magic - Choose magic number MoneyManagement - Automatically calculated lot size, values are displayed on the lines RiskMode - Choose risk model RiskPercent or RiskMoney RiskPercent - In percent when money
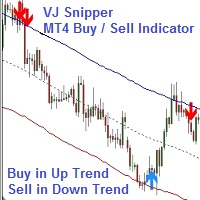
VJ Sniper - MT4 Buy / Sell Indicator: This Indicator is as simple as Buy in Up Trend & Sell in Down Trend. There are 2 Support / Resistance lines for choosing the best Entries. Background: Any in-built indicator of MT4 does not work as stand alone such as Stochastic, CCI or DeMarker etc. But combination of them with trend projection work & give the best results for Trading entries. So this Indicator is blended to give the best results whi

Trend Hunte r, Forex piyasasında çalışmak için bir trend göstergesidir. Göstergenin bir özelliği, fiyat trend çizgisini hafifçe delip geçerse, sinyali değiştirmeden trendi güvenle takip etmesidir. Gösterge yeniden çizilmez, bar kapandıktan sonra piyasaya giriş sinyali görünür.
Trend Hunter adil bir göstergedir. Sinyalin potansiyel kârını görüntülemek için farenizi gösterge sinyalinin üzerine getirin.
Kısa bir StopLoss ile ticaret yapmak için, trend boyunca hareket ederken ek gösterge sinyalle

EA Features This Expert Advisor is based on standard indicators. You can custom your best parameter for each indicator with your own settings.
Inputs Trade Settings AutoBuy : Auto Buy Trading AutoSell : Auto Sell Trading CloseAll : Close all open orders (this Symbol only) PauseTrade : EA will not open a new order but still holding all opened positions (Example: Before big news coming) ResetTime : Close all opening orders at time selection ResetHour : Close all opening orders at Hour selection R
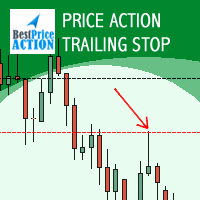
A key element of trend trading is using a trailing stop loss in place of exiting trades with a pre-determined target. This allows for a trade to continue working in the direction of the trend. In good trends this is a very efficient way of profiting from the markets. The Expert Advisor is meant for securing/locking profit as the price moves in favor of a trade. The Expert Advisor can be placed on any chart and be used simultaneously with any other Expert Advisor. You can initialize your stop los
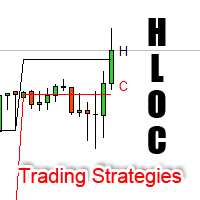
High Low Open Close Levels The indicator HLOC is a good ally to correctly identify the appropriate trend of price. The indicator is designed to be minimally invasive and it shows a visual and sound aid in order to take decision on the market. The indicator is equipped with sound alert and window alert in order to have a reminder of the price movements. We suggest you watch the video below to evaluate its operational benefits.
Input values: Show Level (true/false) TimeFramePeriod (refer to lines
Control Trading Intraday Zones shows the best candles-zones to trade intraday. Shows maximum of the day and minimum of the day zones, adaptable to each symbol, gives you a guide to know the best zones to make the best intraday trades. Indicator goes from -100 (lowest of the day) to 100 (highest of the day), when 0 is middle price of the day. For example, when price reaches high of the day the indicador will continue showing max levels even the price continue rising, because indicator limits to 1
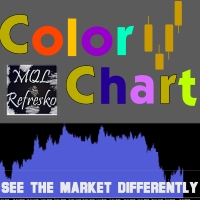
Visualize your charts differently in MetaTrader 5. The product is good for comparing the prices, since the indicator draws High, Close, HLC, etc. It is useful when applied with other indicators (like MACD). This simple indicator colors the entire space below the chart allowing you to see the market with greater clarity. You will see the actual price, trends, and the market behavior.
Indicator parameters: Applied_Price : From this option you can select the type of price you want to draw with th

The FastBoom EA finds the most probable points of price pullback/reverse and places an order. It places averaging orders if the price moves further against take profit.
Settings of the EA: Lots - initial lot; LotExponent - multiplier for following orders (Martingale). 1 - no multiplier. TakeProfit - take profit in points; Stochastic Settings
InpKPeriod - K Period of Stochastic InpDPeriod - D Period of Stochastic InpSlowing - Stochastic Slowing LevHigh - level for sell positions of Stochastic L

This strategy searches for trade opportunities based on what area the close price is, in comparison with Moving Average. In order to be triggered, a pattern between candles also must occur. The EA works well on trending markets. It has been initially developed for stock markets indices (SP500, NASDAQ, etc) on Daily chart entering long positions only. However, I refined the strategy in order to enter short positions as well. It does not use stop loss or take profit, so the losing trades outweigh
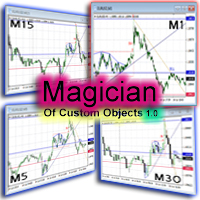
The ‘Magician of custom objects’ is a utility script tools for MetaTrader 4. After attaching the script to a chart, the custom objects in this chart are cloned to any other opened charts of the same symbol. Now, 11 custom object types are supported, including: Vertical line; Horizontal line; Trend line; Angle line; Gann line; Fibonacci line; Rectangle; Triangle; Arrow; Ellipse; Text. If you need other object types or have any question, write in the Comments section.
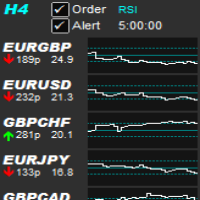
Allows symbols/currency pairs to be ordered based on a configured indicator, with the best performing symbols shown at the top. This helps you to select the symbol with better prospects from a given list of symbols. Can optionally alert when a symbol moves into the top two (configurable). Also shown is the number of pips that the symbol has moved in its current direction, allowing you to tell if you've 'missed the boat'. Further, a graph is shown, per symbol, of the indicator value over time all

This indicator allows you to see the strength of the trend on all timeframes. It can be used for all currency pairs. The indicator can be displayed in the form of a column (from left to right): status buy / sell / strong buy / strong sell, strength of the trend in percentage, pips last candle, body candle now, remaining time, and the timeframe of M1 to MN. Information contained below (from left to right): total trend percent, sell percent, buy percent.

This indicator builds so called "random walk" bands: on every bar it finds maximal or average distance between current price and multiple expanding parabolic curves starting at predefined number of bars in the past. If you like Bollinger bands or Envelopes you may find this indicator useful as well. As you may know, price movements are very similar to random walk time series (specifically, Gaussian random walk), yet they do effectively break the hypothesis of randomness. One of the features of t
The most important thing in my system of forces, is the variation and changing of these forces. It is the key to the whole system, and from this point, my second indicator called FORCES-VARIATION appeares important. The indicator is represented in a separate window in the form of the green histogram and the red curve . The parameter NPIuPeriod represents the number of bars on which we calculate the variation of buyers forces. The parameter NPIdPeriod represents the number of bars on which we cal
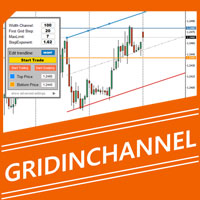
GridInChannel is a professional system of trading inside a channel using active visual control panel. The EA places a grid according to the specified parameters. It trades inside the channel which is manually plotted using a trend line. The main concept : while th price is inside the channel and the " start/stop trade " button is pressed, the EA opens an order grid in the direction of the specified channel.
Expert Advisor Features : Opening orders within the specified range . The range is set u

The EA catches the price when it moves against the trend in an effort to open an order in an opposite direction (direction of the main trend). Screenshots illustrate examples of entries and the strategy gist. The EA uses stop losses depending on values of ATR.
Settings: Lot_ - if Risk_ = 0, the EA will trade this lot; Risk_ - risk per one trade. Stop loss is taken into account; koeff_ATR - coefficient multiplied by the ATR value to calculate stop loss (the bigger the value, the bigger stop loss
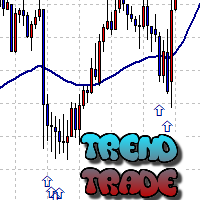
The Trend Trade indicator displays assumed turning points of the price on the chart in the direction of the trend after correction. It is based on data of the Prise Reversal oscillator with the period 6 and indicators which characterize strength and availability of the trend. When the value of Prise Reversal is in overbought or oversold area (area size is set by a user), and the current trend is confirmed, the Trend Trade indicator draws an arrow pointed to the further assumed price movement.
I

The indicator compares quotes of the current symbol and a synthetic quote calculated from two specified referential symbols. The indicator is useful for checking Forex symbol behavior via corresponding stock indices and detecting their convergence/divergence which can forecast future price movements. The main idea is that all stock indices are quoted in particular currencies and therefore demonstrate correlation with Forex pairs where these currencies are used. When market makers decide to "buy"

This is a professional multi currency tool. Its main purpose is semi-automatic Forex trading following Elder's Triple Screen strategy. Its wide functionality and ability to quickly change some essential parameters makes it an ideal market interpretation tool, which is indispensable in the common trade analysis. Its main advantage is almost unlimited number of simultaneously analyzed instruments. If the potential technical limits of your monitor resolution allow, multiple indicators can be used.

true Momentum - time-based Indicator it will inform about Momentum, a strong impulse in the appropriate direction it's based on a self-developed candle Pattern, in relation to the ATR (Average True Range)
Quick Start : the indicator is ready to use choose your personal times to trade try an indicator-preset or use an additional indicator, below the pro-settings
Filter Hours Weekdays Moving Averages Correlation Instruments - Moving Averages MACD RSI ADX PSAR Stochastic Bollinger Bands Keltner-
MetaTrader Mağazası, alım-satım robotları ve teknik göstergelerin benzersiz bir deposudur.
Yatırımcılara sunduğumuz benzersiz hizmetler hakkında daha fazla bilgi edinmek için MQL5.community - Kullanıcı Notunu okuyun: alım-satım sinyallerini kopyalama, freelancerlar tarafından geliştirilen özel uygulamalar, Ödeme Sistemi aracılığıyla otomatik ödemeler ve MQL5 Bulut Ağı.

Alım-satım fırsatlarını kaçırıyorsunuz:
- Ücretsiz alım-satım uygulamaları
- İşlem kopyalama için 8.000'den fazla sinyal
- Finansal piyasaları keşfetmek için ekonomik haberler
Kayıt
Giriş yap
Web sitesi politikasını ve kullanım şartlarını kabul edersiniz
Hesabınız yoksa, lütfen kaydolun