 MetaTrader 5
 Uzmanlar
 Göstergeler
 Kütüphaneler
 Yardımcı programlar
 Widget'lar
 Kurallar
YouTube'dan Mağaza ile ilgili öğretici videoları izleyin
Bir alım-satım robotu veya gösterge nasıl satın alınır?
Uzman Danışmanınızı
sanal sunucuda çalıştırın
sanal sunucuda çalıştırın
Satın almadan önce göstergeyi/alım-satım robotunu test edin
Mağazada kazanç sağlamak ister misiniz?
Satış için bir ürün nasıl sunulur?
MetaTrader 4 için Uzman Danışmanlar ve Göstergeler - 141
 Alım-satım robotları piyasalarda otomatik olarak işlem yapar, göstergeler ise fiyatları analiz etmek ve fiyat değişikliklerindeki kalıpları belirlemek için kullanılır.
Bu alım-satım uygulamalarıyla, MetaTrader 4'te daha bilinçli alım-satım işlemleri gerçekleştirecek ve daha fazla alım-satım fırsatı yakalayacaksınız.

Colored Trend Bars indicator is a trend indicator working with a set of algorithms and a set of indicators. Trend finds trends by using many factors while you are there. This indicator has 4 mode features. Mode 1 represents short-term trends. Mode 2 represents medium to short term trends. Mode 3 represents medium to long term trends. Mode 4 represents long term trends. Easy to use and simple indicator. The user can easily understand the trends. This indicator has 3 trend features. Up trend, down

This Expert Advisor is based on Trend Following Systems . The mechanism (stop-and-reverse) technical indicator. Based on a price and time trading system, the indicator is used for analyzing market trends. The indicator trails price as the trend extends over time. It is similar to the Moving Average, as the only difference is that the indicator moves with higher acceleration and may change its position in terms of the price. In general, the indicator moves below the prices as they go up (bull mar

Trade Trend indicator is an oscillator designed to calculate trend reversal points. A set of bar calculations and a set of algorithms to calculate trend reversals. Level probing system with high probability trends. All of these features combine to make it easier for investors to find trends.
Suggestions and Features There are two levels on the Trade Trend indicator. They are at levels of upper level and lower level. The oscillator bar should be below lower level to find the upward trend. And a

Trend Waves indicator is a trend indicator that uses Average True Range and Standard Deviation indications. It is aimed to find more healthy trends with this indicator. This indicator can be used alone as a trend indicator.
Detailed review 4 different trend colors appear on this indicator. The aqua color represents the rising trend. Dark aqua color means the train is getting weaker. pink color represents the downtrend trend. The dark pink color means the trend is weaker. Parameters Stdeviatio
The EA's algorithm determines the current state of the market - a bullish trend, bearish, or sideways movement and opens positions in the direction of the intended price movement.
In addition, at the time of making a trading decision, the adviser analyzes 4 and 5 candlestick formations for a certain period of time. If more than 2 formations coincide with a positive result, the adviser makes an entry into the market.
The SAR indicator is used as a filter. The best results are achieved on tradin
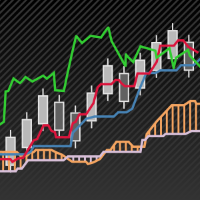
Realization of trend movement indication with points for potential stops in the TrendCloud indicator. It can be easily used as an independent trading system. You can interpret this: the location of the course above or below the shadows show the presence of a trend. The transition to the shadow warns of a possible reversal. Entering the price inside the shadow speaks in a flat motion. The indicator tracks the market trend with unsurpassed reliability, ignoring sharp market fluctuations and noises

For watch tread
https://www.mql5.com/en/signals/548990
Anubes is an Expert Adviser making you trading is very easy with low risk and little of time you can get your profit Anubes following the trend with Discipline It will be updated every 3 months to make sure that the strategy is still suitable for the current market condition Features Good at EURUSD, GBPUSD, EURAUD, GBPAUD. Over ten years of back-testing. (10,000+ deals) Do not require fast execution or low spread. EA Settings:you can

Always Strong indicator, an indicator that uses MacD and Bollinger bands. It is a coded indicator to find trends. It finds these trends by its own algorithm. This indicator requires visual monitoring. It does not give any warning because it needs visual follow-up. The main trendline should turn down to find the down trend. The main trend line should go under the white line and then go under the yellow line. The main trendline should turn upward to find the upward trend. The main trend line shoul

The EA is based on trend following strategy. By mainly using GMMA,this EA catches the trend. Trades is closed if the trend is changed according to GMMA.
Simply put,you can win big by using this EA and keep losses minimum.
What is GMMA?
GMMA means "Guppy Multiple Moving Average". This strategy utilizes 12 moving averages.
Because of that,GMMA is more robust and profitable than simple moving average strategy.
PAIR AND TIMEFRAME The EA is especially made for EURUSD and Daily chart. It is importa

THE REVOLUTION Simple Trade is suitable for all type of traders whether you are a Swing Trader, Day Trader or Scalper.
THE REVOLUTION Package consist of 3 EAs which combine into a Single EA which can create many stategies depend on the trading skills used/known by each traders. We provide AUTO_SETTING expecially for beginner or no experience investors which this AUTO_SETTING will trade to achieve 1000 Points or 10%/month, and for traders/investors who have experiences in trading can develop thei

Strong Pivot trend indicator is a trend indicator that uses standard pivot calculation and some indicators. The purpose of the indicator is to calculate the possible trends using the pivot point. And to give the user an idea about trend direction.
You can use this indicator as a trend indicator. Or with other indicators suitable for your strategy.
Features The blue bar represents the upward trend. The yellow bar represents the downward trend. The blue pivot point represents the upward trend. T

Super Trend Lines is an indicator that calculates trends using a set of channels and using a set of algorithms. This indicator helps to find trend return points. It generally represents an oscillator. This trend tracking system helps the investor to understand small or large trends and determines the direction according to it.
Time frames: M15, M30, H1
Parameters Period : general trend period. Bar : bar calculation setting Channel_Cal : channel calculation period. The smaller the value here, t

Dynamic Support and Resistance is the collective work of three traders with several decades worth of experience trading all financial markets. The math behind these levels is unlike anything ever produced in the public trading world. Dynamic S&R is a tool to measure ranging markets, trending markets, and aids in catching the turns of the trends when combined with Dynamic PriceWraps. Dynamic S&R can be used for spot FX, futures, stocks, and is incredibly useful in options trading for all produ

This Expert Advisor is using three Moving Averages to find the direction of the trend. There is three different Moving Averages that has to be in the right order and the EA is looking for this in different timeframes to make sure it's in the order to trade. Then the EA will look for both the Stochastic and RSI in different timeframes before everything is looking good. Now it will take a BUY or SELL trade, depending on the indicators. It will set the Stop Loss and Take Profit depending on the hig
小蜜蜂EA是根据MACD指标,KDj指标等多个指标产生共振,结合波浪理论,编译的一个趋势加马丁类型的EA,成功率是非常高的。
使用周期是M30以上的周期,下单的频率不高,大部分时间这款EA是出于观望状态,已有机会,稳准狠的对交易品种进行下单,
关于参数
参数设置有点复杂,但是使用者没必要害怕,我已经把参数调成了最理想的参数,下载就可直接使用,
最少资金不少于3000美金, EA is based on MACD index, KDj index and other indicators resonance, combined with wave theory, compiled a trend plus Martin type EA, the success rate is very high.
Usage cycle is more than M30 cycle, order frequency is not high, most of the time this EA is out of wait-and-see state, has the opportunity to
The Expert Advisor places a grid of limit orders above and below the current price according to the settings. After the orders are triggered, the adviser controls the current state of profit. In case of reaching the profit specified in the settings (in the deposit currency), the adviser closes market and pending orders and opens the grid again. Settings Initial trading lot - Trading lot for the first order; LotKoef - The multiplication factor for each subsequent order; The distance to the firs
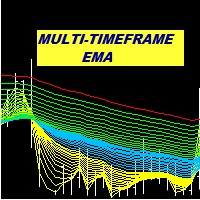
Multi Period EMA A trend indicator based on the exponential moving average. Keeping track of multiple EMA is a more effective way of detecting possible trend development. This indicator allows for the setting of as many as 6 different EMA periods. Unused period parameters can be set to zero to exclude the particular EMA from being displayed on the chart.
Features Up to 6 EMA displayed on chart. Option to select high EMA and Low EMA in order to detect crossovers Alert in event that change in sl
Relative Trend Bias
The Relative Trend Bias indicator is a simple indicator that helps you identify the current directional movement bias of a financial instrument based on the number of bars specified. Helps you identify the current trend based on a bar period of your choice Shows you level "safety zones" for reversals Shows you when the trade bias changes while the indicator is active on the chart
Indicator is forward facing. It does not backdraw/backpaint but it can be tested on the indica

Entry Point Dashboard Ultimate, MT4 ve MT5 için tasarlanmış, teknik analizi , piyasa trend analizini ve giriş noktası belirlemeyi basitleştirmek amacıyla birden fazla işlem aracını tek bir görsel panoda birleştiren çoklu zaman dilimli bir işlem panosu göstergesidir. Gösterge, seçilen zaman dilimlerinde Hareketli Ortalamalar , CCI , RSI , Stokastik , momentum verileri ve hacim koşullarını analiz ederek mevcut piyasa koşullarına ilişkin yapılandırılmış bir genel bak
Данный индикатор отмечает участки разворота тренда, в точках разворота давая сигнал на вход в рынок в виде стрелок соответствующего цвета и направления движения в виде линий, а также звукового оповещения. Основан на закономерностях рынка FOREX, точных определениях текущего экстремума и нахождения свечных моделей на вершинах/низах рынка. Универсальный алгоритм помогает определить точки разворота указывая стрелками где осуществить вход в рынок. Дополнительно Индикатор не перерисовывается. Выводит

About
Holy Renko is a trend identifier capable of identify small and long market movements. This indicator should be use in Renko Charts.
VIDEO (information and tips) [HERE] How to install Renko Charts [HERE]
Features
Developed for Renko Charts Easy to analyze Fast signals Not repaint (when candle close) Statistics panel Filters false signals
Alerts, emails and push notifications
Advantages of Renko Chart Easy to install Easy to analyze Filter out the noise of wicks Easy identification
Description
The base of this indicator is an ZigZag algorithm based on ATR and Fibo retracement. The ZigZag can be drawn like a classic ZigZag or like Arrows or needn't be drawn at all. This indicator is not redrawing in sense that the ZigZag's last shoulder is formed right after the appropriate conditions occur on the market. The shoulder doesn't change its direction afterwards (can only continue). There are some other possibilities to show advanced information in this indicator: Auto Fibo on

This indicator based on OBV. He is essentially trending , it can "feel" the trend change. The arrow-signal does not disappear and does not redraw after a bar closes. An order may be opened towards the arrow direction at the next bar after the signal appears. Using this indicator is intuitive. Once the first turquoise arrow appears, buying is preferred. Red – selling. I recommend using the indicator on the H1 timeframe. When the first hand of the opposite color appears and the hour bar clos

Extended VERSION
Ultimate solution on price action trade system Built Inside One Tool! Our smart algorithm tool will detect the price action pattern and alert upon potential with entry signals and exit levels including stoploss and takeprofit levels based on dynamic and unique calculation. This tool will also filters out market currency strength to ensure our entry are in a good currency conditions based on it's trend.
Benefit You Get
Easy, visual and effective price action detection. Gives

MaxProfitDZ Expert adviser MaxProfitDz v1.4 Recommendations Symbol: ALL PAIRS ..i Recommended EURUSD. Time Frame:1M. Brokers: ALL brokers . low spread/commission, 1:500 leverage Minimum Deposit Recommended : $500 USD
Lot Size for 500$ : 0.01 Use a broker with good execution and with a spread of 0.1-2 points. A very fast VPS is required
Parameters EA TrendON=true (Read the note ) MMType = 2 LotMultiplikator = 1 LotConst_or_not = TRUE Take profit :5-10 pips for accounts with five
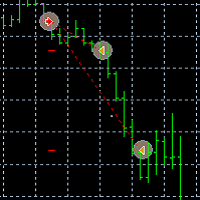
TaiChi4 Tai Chi4EA Tai Chi2EA is according to MACD indicator deviation written a trend oriented EA。 Broker: ECN broker, low communication / Commission, 1:400 leverage, non FIFO or FIFO. If you want to run in different currency pairs, please modify the parameters BM and SM。 Please use default parameters. As the world's most knowledgeable person, I've set the parameters to the optimal parameters, users can directly use, without modification.

Let´s try to make some real money!
Call me profit addicted. I thought why not try to make THE dream come reality. With discipline, a clear strategy and this indicator I focus on entering the perfect trades. This indicator is very easy to use as you will get perfect entry points for Put or Call trades.
The arrows are calculated with: - Momentum parameters - Candle stick patterns - Fundamental Price action
We recommend to combine it with Parabolic, ZigZag or Elliot waves indicator

This indicator displays Super Power Beeta trend movement.Indicator is version 2 . Features Multiplier - displays multiplier movement. Multiplier2 - displays multiplier2 movement. Trend - displays indicator trend 1 and trend 2 (true/false).
Background:color - displays background color (true/false).
separate_window - displays trend separate window.(0-1....) separate_window2 - displays trend (background color )separate window.(1-2....) X - move the trend left and right.
Y - move the trend up an

Pips collector - this indicator is a complete mechanical trading system. Pips collector itself analyzes the market for 57 characteristics, determining the direction of the trend, volatility, aggressiveness, resistance and support. After this, the Pips collector displays the signals for opening buy or sell orders. Interpretation of trading with Pips collector is very simple and suitable for both professional traders and beginners. Also, the Pips collector indicator can send signals to the trader

The EA contains a combination of several trend and anti-trend virtual strategies with averaging with different parameters. The EA is easy to use. It is enough to choose a suitable strategy for the trading pair, set the Risk parameter and you can start trading. Open the M15 chart with the pair being traded and move the EA to it. Lots will be calculated automatically based on the balance, Deposit currency and Risk parameter. Recommendations: Trading EURUSD, USDCAD, AUDNZD, AUDCAD, NZDCAD, USDJPY;

Ultimate solution on price action trade system Built Inside One Tool! Our smart algorithm tool will detect the price action pattern and alert upon potential with entry signals and exit levels including stoploss and takeprofit levels based on the time setting on each market session. This tool will also filters out market currency strength to ensure our entry are in a good currency conditions based on it's trend.
Benefit You Get
Easy, visual and effective price action detection. Gives you the a
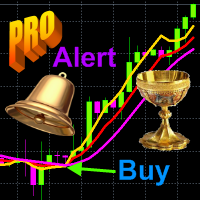
Structure of the indicator. The Cunning crocodile indicator consists of three moving averages (applied to the price Median price = (high + low)/2 ) : 1) the usual MA ( SMA , EMA , SMMA , LWMA ) or the mean <X> of the process X and her two generalizations 2) <XF> = <X / <X >> * <X> and 3) <XS> = <X * <X >> / <X> with the same averaging period. All three curves intersect at common points that (such an intersection in which the cunning crocodile, unlike the usual one, "never
The EA uses economic news trading using low, medium and high news. The EA is set for each piece of news separately. Trading is conducted on 26 currency pairs and 4 timeframes from M5-M30. The EA uses trading on such indicators as CCI, Standard Deviation, Moving Average, Relative Strength Index, Momentum and MACD . The EA looks for small price deviations by indicators and uses 3 types of economic news to confirm the position opening. Adaptive breakeven, trailing stop , and partial position cl
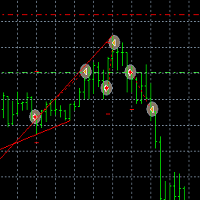
TaiChi3 Tai Chi3EA Tai Chi2EA is according to MACD indicator deviation written a trend oriented EA。 Broker: ECN broker, low communication / Commission, 1:400 leverage, non FIFO or FIFO. If you want to run in different currency pairs, please modify the parameters BM and SM。 Please use default parameters. As the world's most knowledgeable person, I've set the parameters to the optimal parameters, users can directly use, without modification. The historical data of the test may not be accurate, b

The Stochastic Standard/Hidden Divergence indicator will plot the stochastic (%K and %D), and will also identify and plot standard (regular) divergences between the indicator and the price action, OR it can be set to identify and plot hidden (reverse) divergences between the indicator and the price action. The divergences themselves are implemented as lines (default green for bullish divergence and red for bearish divergence) drawn in the indicator pane. If activated via the Inputs dialog, alert

The Momentum Standard/Hidden Divergence indicator will plot the momentum, and will also identify and plot standard (regular) divergences between the indicator and the price action, OR it can be set to identify and plot hidden (reverse) divergences between the indicator and the price action. The divergences themselves are implemented as lines (default green for bullish divergence and red for bearish divergence) drawn in the indicator pane. If activated via the Inputs dialog, alerts will be genera

The RSI Standard/Hidden Divergence indicator will plot the Relative Strength Index (RSI), and will also identify and plot standard (regular) divergences between the indicator and the price action, OR it can be set to identify and plot hidden (reverse) divergences between the indicator and the price action. The divergences themselves are implemented as lines (default green for bullish divergence and red for bearish divergence) drawn in the indicator pane. If activated via the Inputs dialog, alert

The MACD Standard/Hidden Divergence indicator will plot the MACD, and will also identify and plot standard (regular) divergences between the indicator and the price action, OR it can be set to identify and plot hidden (reverse) divergences between the indicator and the price action. The divergences themselves are implemented as lines (default green for bullish divergence and red for bearish divergence) drawn in the indicator pane. If activated via the Inputs dialog, alerts will be generated when

The CCI Standard/Hidden Divergence indicator will plot the Commodity Channel Index (CCI), and will also identify and plot standard (regular) divergences between the indicator and the price action, OR it can be set to identify and plot hidden (reverse) divergences between the indicator and the price action. The divergences themselves are implemented as lines (default green for bullish divergence and red for bearish divergence) drawn in the indicator pane. If activated via the Inputs dialog, alert

This indicator displays super power trend movement. Features Multiplier - displays multiplier movement.
Multiplier2 - displays multiplier2 movement. Trend - displays indicator trend 1 and trend 2 (true/false). separate_windor - displays trend separate window.(0-1....)
X - move the trend left and right.
Y - move the trend up and down. How to understand the status: If the Trend color is green, trend is up. If the Trend color is red, trend is down.
The arrows are calculated with: - 2 Parabolic parameters - 2 ADX parameters - 4 Stochastic parameters
We recommend to combine it with Parabolic, ZigZag or Elliot waves indicator. Always trade the trend!
If you make sure to draw your trend lines and support/resistance zones you will just have to wait for the signal to appear. Take the trade. For Binary Options it is advisable to set the expiry time to 5-15 min in M1 chart. THIS INDICATOR IS ZERO REPAINT
Best assets to trade: - EUR

The Trend Confirm indicator is a set of indicators and a set of channel movements. The purpose of the indicator is to find a healthy trend and designed to confirm these trends. There are two channels in the trend. The blue channel line is used to confirm the ascending trend. The green trend line is used to confirm the downtrend.
How to use? If the trend line in the indicator goes above the blue channel line, the trend is starting to rise. If the trend line within the indicator falls below the g

Oscillator Trend indicator macd, divergence and a set of algorithms is a trend indicator. The aim of the indicator is to generate signals with high reliability using the above-mentioned calculations.
The indicator is very easy to use. Red arrows give sale signal. The Aqua arrows give a buy signal. Thanks to the alert feature, you can easily reach the signals. It works without any setting. It can be used in all time frames. The recommended time frames are m15, m30 and h1.
Parameters Trendlines

O Giriş Noktası gösterge bir profesyonel sinyal paneli Bu, üç farklı zaman dilimine kadar çeşitli teknik göstergeyi birleştirerek tek bir sonuç üreten bir yöntemdir. Birleştirilmiş giriş sinyali . Yatırımcılar, Hareketli Ortalamalar, CCI, RSI, Stokastik, Bill Williams Hızlandırıcı ve hacim analizi için ayrı pencerelerle uğraşmak yerine, tüm bu okumaları tek bir yerde görüntüleyebilirler. Sezgisel görsel panel . Sistem her zaman dilimini bağımsız olarak ana

The Sensitive Volume indicator is an indicator designed to generate trading signals. The purpose of this indicator is to generate signals from the highest probability of trading. Using a number of price movements and a set of indicator properties to generate these signals.
Easy to use, simple and understandable to the user. With alert features, user signals can be reached quickly. Visually the user can easily recognize the signals. This indicator will not repaint. Parameters Trend_Period - pe
BinaryUniversal is a signal indicator for binary options and Forex. In its work, the indicator uses a complex algorithm for generating signals. Before forming a signal, the indicator analyzes volatility, candlestick patterns, important support and resistance levels. The indicator has the ability to adjust the accuracy of the signals, which makes it possible to apply this indicator for both aggressive and conservative trading. The indicator is set in the usual way, it works on any time period and

AlfredsSoft is a unique trading system consisting of several advisers. It was conceived as a safe portfolio for long-term investment. It includes scalp, flat and trend advisers. Not martengel, no grid, no hedging. Always uses a stop-loss and take profits, or specifies the conditions for exiting the position. Use on the EURUSD pair. Timeframe H1. Deposit 300 $ for 0.01 lot! Has successfully passed the test since 2008 with a spread (20). For better performance, use a broker with a low spread and p

This indicator shows the remaining time for the candle to close, even if the price does not change in value, the clock keeps counting backward. You can also program price alert levels using trend lines.
It can be used together with Expert Advisors and other panels, such as Controller without limit .
MT5 version
Instructions To set a price alert level, you must draw a trend line. Once the object has been drawn, it must be named so that the indicator recognizes the object. In the name, th
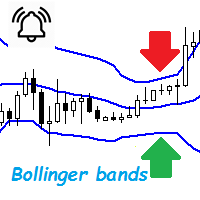
Bollinger Bands are a very common indicator in the world of online trading, this indicator gives very useful information for many forex trading strategies, but also for all other styles of strategies such as scalping and even trading medium and long term. It is calculated from a moving average calculated over n periods (20 by default). From this moving average, a standard deviation calculation is defined. By adding this standard deviation in real time to the basic moving average, we obtain the u

Yanlışlıkla fiyat sıçramalarının etkisi olmadan trend tespiti için tasarlanmış PriceRunner göstergesi. Gürültü azaltma için Fiyat Serisini ve birkaç hareketli ortalamayı kullanır. Birden çok zaman diliminde, hatta M1'de çalışır. Etkinliği artırmak için M1 grafiği için varsayılan parametrelerin kullanılması önerilir (ekran görüntülerine bakın). Diğer zaman dilimleri için ayarları değiştirebilirsiniz. Bu göstergeyi kullanma örneği: Altın Mavi'ye düşerse ve Gri altında hem altın hem de mavi olursa

This Expert Advisor trades the trends, long and short. As soon as the momentum is big enough it enters a trader. When the momentum gets weaker the trade is being closed. So the Stop Loss and the Take profit is the momentum.
It is best suited for the currency pair EURJPY in H1 timeframe.
Inputs:
Lotsize: The lotsize for the trade StopLoss: Here you can set the S/L level (default: 0 = not active)
TralingStop: Here you can set the T/S (default: 0 = not active) TakeProfit: Here you can set the T/P

3S indicator designed for trend detection without the effect of accidental price leaps. It uses Price Series and a few moving averages for noise reduction. It works on multiple timeframes, even M1. To increase effectiveness, it is recommended to use default parameters for M1 graphic (see screenshots). You can change settings for other time frames. Example of using this indicator : If Gold cross to Blue down and both gold and blue under the Gray , it could be a promising sell signal .
To
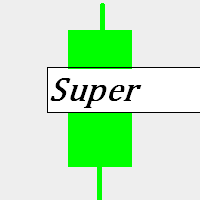
This indicator super indicator.Indicator displays trend movement. Indicator calculates automatically bars Features
FiltPer - displays indicator period. Multiplier - displays indicator multiplier. How to understand the status: If the indicator bar is higher , trend is up. If the indicator bar is lower , trend is down. IIIIIIIIIIIIIIIIIIIIIIIIIIIIIIIIIIIIIIIIIIIIIIIIIIIIIIIIIIIIIIIIIIIIII

A trending market is one in which price is generally moving in one direction. ... When trading a trend-based strategy, traders usually pick the major currencies as well as any other currency utilizing the dollar because these pairs tend to trend and be more liquid than other pairs.
Best Trend Indicator That Tells You the Direction of the Trend
Trend MagicX_v1.1 displays the trend direction, duration, intensity and the resulting trend rating for all time frames in real time. You'll see at a

The advisor algorithm calculates the correlation between the built-in algorithms for determining the patterns of price movements. When the dynamically calculated required correlation level is reached, the adviser enters the market.
Each transaction is controlled by a short trailing stop, which accompanies each market order in both zones - profitable and unprofitable.
Advisor is recommended to use simultaneously on the following trading instruments: EURUSD M5, GBPUSD M5, EURGBP M5, USDCAD M5. P
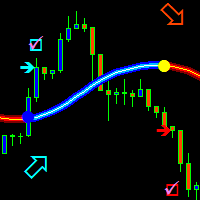
The trend is your friend! This is what this indicator is all about. Follow this famous saying and be safe.
Characteristics:
Buy/Sell signals fixed on the close of a bar. Works on all symbols and all timeframes. Clear visual market trend laser line, Buy/Sell signal arrows, market strength meter, TP1 & TP2 boxes. Visual signals when to enter, when to exit the market. No repainting. Compatible with Flexible EA for trading automation. (Ask for a free set file optimized to perform 2010-2018) Parame
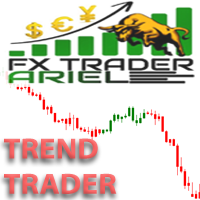
This is the FXTraderariel TrendTrader .It analysis the trend and displays it, due to changing the changing the candle color. It took me over 12 Year to develop this system. But it shows the market perfect. Very easy to follow, even for beginners.
It works on all Pairs and all Timeframes (however we advice only pro traders to trade smaller Timeframes, novice traders should stick to higher TF like H4 and D1).
Depending on the settings it and trading style, it can be used for scalping or long-ter
New Version updated(1.5) with a special trend filter!
Set file for EURUSD H1 ---> https://c.mql5.com/31/291/hendrix_ea_eurusd_h1_set_files.zip
Please Read it before start! I made an article on how to easy optimize it for your broker, pair and timeframe!
Instructions here: https://www.mql5.com/en/blogs/post/723159
Is this EA too slow for you? Take a look at the more aggressive and faster version Hendrix Turbo Grid ( https://www.mql5.com/en/market/product/38097 )
WARNING: using Hendrix EA

Sentinel Grid, is an Expert Advisor that allows you to create complex trading strategies. Things unthinkable only until some time ago. You will have total control of the operation, being able to decide to mount, for example, two equal and opposite grids to take advantage of a moment of laterality of the market, gaining if the price moves above or below the entry level. As you can opt for two Anti-Grid, always equal and opposite to take advantage of a moment of strong trend without having to gue

Price action is among the most popular trading concepts. A trader who knows how to use price action the right way can often improve his performance and his way of looking at charts significantly. However, there are still a lot of misunderstandings and half-truths circulating that confuse traders and set them up for failure. Using PA Trend Reversal will be possible to identify high probability exhaustion moves of a trend. ️ AVOID NEWS AND SPEECHES - most of the bad signals are during the news/sp

This is the FXTraderariel F.U.E.L . It scans the market for opportunities and shows a buy or sell signal.It uses price action and VIX to find the best opportunities. Depending on the settings it and trading style, it can be used for scalping or long-term trading . The indicator can be used on every time frame , but we advise to use it on H1 and H4 . Especially if you are a novice trader. Pro Traders can also you use it for scalping in smaller timeframes (M1, M5 and M15). This indicator is not a
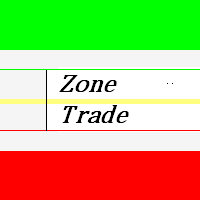
This indicator zone indicator.Indicator displays high and low zone.
Features Green color - Shows movement on the high zone.
Red colr - Shows movement on the low zone. Yellow colr - Shows movement on the zero zone.
How to understand the status:
If the bar is higher than the yellow color line , trend is up. If the bar is lower than the yellow color line , trend is down.

Lite version of Muholov Trend Trader Multicurrency trend advisor. Analyzes and trades up to 8 trading instruments simultaneously. Always follows the trend. 4 timeframes are taken for analysis: W1, D1, H4, H1. The main trend is determined by the highest selected timeframe (W1, D1, H4 - selected by a trader in the settings). Transactions open with a signal on H1. Closing orders takes place by take profit or by chains, when the specified profit of the chain is reached (specified in the settings).
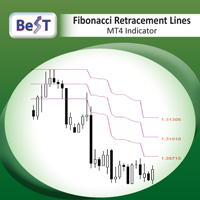
BeST_Fibonacci Retracement Lines is an MT4 Indicator that by default is based on common Fibonacci levels but it can also draw any 3 desired levels of Retracement or Support of a trending move. It can be used to identify pullback points but also additionally as a kind of a Trailing Stop . BeST_Fibonacci Retracement Lines indicator: • by default draws 38.2%, 50% and 61.8% Retracement Levels of the current price move defined using the Highest High (HH) and Lowest Low (LL) of a desired Look Back Pe

The expert implements the strategy of "catching tails", earning on inevitable corrections after the beginning of a powerful trend. For the beginning of the trend, the moment of occurrence of a strong directed candle is taken. The order is opened in the opposite direction from the trend. If the price continues to go on a trend, then the level of the planned profit is shifted by implementing a grid of warrants, waiting for an inevitable correction or reversal of the trend.
The input parameters in

The Sensitive Oscillator indicator is designed to find trends. It recognizes trends with its own algorithm and changes color. Finds trends relative to the degree of sensitivity. You can use it in all time periods. You can use this indicator alone or in conjunction with other indicators suitable for your other strategies.
Transaction strategies You can do breakout strategies with this indicator. Each time you change colors, you can enter the process. You can use it in the long run by putting sto

Gegatrade Advanced EA is a state of the art Cost Averaging system It is secured by a built-in “ News WatchDog ” that suspends trading during news events
the EA has lot of preset configuration files that can be downloaded from its Blog For full description visit the Blog : https://www.mql5.com/en/blogs/post/720582
Trading Strategy
The EA uses different strategy to each pre-set file which can all be downloaded from the Blog
Gegatrade Advanced is open for the user to define his own strateg
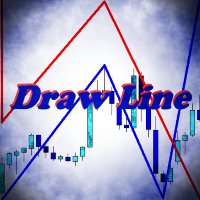
Indicator Draw Line, is a utility for drawing in the chart trend lines, connecting together and following one after another. It will be especially useful for traders who use in their trading wave analysis. Above the graph are buttons for switching the basic settings: Calling the color bar, Turning the indicator on and off, Turning the sound on and off, Clearing the chart from the created objects. With the rest of the settings will not be difficult to understand. Use your health!

Pro Strong Trend is an indicator that generates trend signal. It generates trend signal with its own algorithm. These arrows give buying and selling signals. The indicator certainly does not repaint. Can be used in all pairs. Sends a signal to the user with the alert feature.
Trade rules Enter the signal when the buy and sell signal arrives. Processing should only be initiated when signal warnings are received. It is absolutely necessary to close the operation when an opposite signal is receive
The EA uses two strategies, the first trend strategy the second reverse strategy can be enabled or disabled through the settings. The EA has been optimized for the last 10 years. The adviser uses a variety of indicators such as Bollinger Bands , Moving Average , Momentum with different settings for the most accurate signals. To close positions, stop loss and take profit are used, as well as additional methods of order modifications. Very easy to set up, does not require special knowledge. Y
MetaTrader platformunun uygulama mağazası olan MetaTrader Mağazasından bir alım-satım robotunun nasıl satın alınacağını öğrenin.
MQL5.community Ödeme Sistemi, PayPal, banka kartları ve popüler ödeme sistemleri aracılığıyla yapılan işlemleri destekler. Daha iyi bir müşteri deneyimi için satın almadan önce alım-satım robotunu test etmenizi şiddetle tavsiye ederiz.

Alım-satım fırsatlarını kaçırıyorsunuz:
- Ücretsiz alım-satım uygulamaları
- İşlem kopyalama için 8.000'den fazla sinyal
- Finansal piyasaları keşfetmek için ekonomik haberler
Kayıt
Giriş yap
Web sitesi politikasını ve kullanım şartlarını kabul edersiniz
Hesabınız yoksa, lütfen kaydolun