YouTube'dan Mağaza ile ilgili eğitici videoları izleyin
Bir alım-satım robotu veya gösterge nasıl satın alınır?
Uzman Danışmanınızı
sanal sunucuda çalıştırın
sanal sunucuda çalıştırın
Satın almadan önce göstergeyi/alım-satım robotunu test edin
Mağazada kazanç sağlamak ister misiniz?
Satış için bir ürün nasıl sunulur?
MetaTrader 4 için yeni Uzman Danışmanlar ve göstergeler - 258

Expert Advisor Description EA TugOfWar will open both buy and sell positions at different times according to the triggered signal, the most positions and in accordance with the market direction that will win and profit. Profit target per war is 1% to 5%. Warmode normal = Longterm strategy Warmode extreme = Shortterm strategy
Parameter Description StartTrade = Time to start trading / open position EndTrade = Time to end trading / open position WarMode = 1 -> Normal, 2 -> Extreme (lots of tr
FREE
Советник "Stochastic and Parabolic SAR" торгует по индикатору Stochastic Oscillator, используя фильтр в качестве индикатора Parabolic SAR,
по желанию Пользователя применяется мартингейл (количество умножения лота при серии убытков ограничивается), безубыток, трейлинг стоп, инвертирование сигнала, возможно настроить, как скальпирующий советник.
Для каждого валютного инструмента необходимо подбирать настройки.
Настройки советника: Индикатор Stochastic Oscillator: Kperiod=5; период линии K Dpe
FREE
Советник "Parabolic SAR and Fractal" торгует по двум индикаторам: 1.Parabolic SAR, 2.Fractal
Сделка на покупку: если образовался нижний фрактал и цена находится выше точек индикатора Parabolic SAR
Сделка на прордажу: если образовался верхний фрактал и цена находится ниже точек индикатора Parabolic SAR
По желанию Пользователя применяется мартингейл (количество умножения лота при серии убытков ограничивается), пирамидинг, безубыток, трейлинг стоп, возможно настроить, как скальпирующий сове
FREE

This expert works in the strategy of hedging and hedging and then add a high-precision capital management. It does not use the entire balance in the trade process, but it splits it into several parts and trades part of it according to user settings also works to open several orders at the same time, taking into account the management of capital works On all the main couples but works on only one pair of them taking into account the capital management this expert wonderful profits infinite ... Tr

Only NonFarm Payroll Trade The employment situation is a set of labor market indicators. The unemployment rate measures the number of unemployed as a percentage of the labor force. Non-farm payroll employment counts the number of paid employees working part-time or full-time in the nation's business and government establishments. The average workweek reflects the number of hours worked in the non-farm sector. Average hourly earnings reveal the basic hourly rate for major industries as indicated

Стратегия Советник открывает отложенные ордера на пробой важных уровней поддержки и сопротивления. Открытие фильтруется специальной тренд следящей функцией. При возникновении противоположных условий отложенные ордера немедленно удаляются. Работа ведётся только в направлении локальных трендов на текущем таймфрейме. Особенности Советник не использует сетку, мартингейл, тиковый скальпинг! Для увеличения доходности - периодически оптимизируйте параметры за 3 последних месяца. Или используйте предлаг

Standart "PureDailyEA" 's signal link has been working on 25 different instruments since 09.07.2019. It will be stopped after a while. https://www.mql5.com/en/signals/605823 Differences between Standart " PureDailyEa" and "PureDailyAdvanced" are: 1. Added one more input parameters for fine tuning ( optimizasyon ) 2. Only 5 currencies works together. You can add daily all 25 currencies but experts open orders ( if conditions met ) only five of them. This because margin problem in the small a
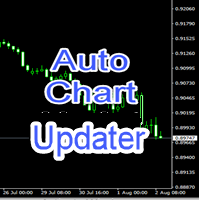
Auto Chart Updater Indicator is created to update the window chart for any indicator, expert or any trading program receive fresh data retrieval at xx period interval set by the user as a preference. It is laced with on-chart Candle clock to give the user the sense of time when the updater would refresh the chart or the remaining time for the candle/session to end. It also has an option for the user to choose when exactly does he/she wants the Updater to update the chart. The User can also selec

Dear Traders it's happy to launch this EA much as possible. You can use various settings on this EA to maximize the profits. 100USD is enough for safe trading with small lot sizes. Enjoy the EA. Dollars will come to your hand. Feel free to ask any thing about the EA. You can choose several modes to trading activities. Safe trading is included to the EA. Your Equity is on safe hand with this EA.
Trading Robot which automates your scalping and take your profitability and forex trading experience to the next level ,Computer cannot analyse market as humans do, at same time we cannot compete with them in terms of speed of execution, hft & emotionlessness . In this scalp-trading robot we have integrated human analysis with quick algorithmic execution to enter and exit trades at fraction of seconds Get More details at : https://www.noemotionfx.com/tl-scalper-ea To test , use it in dem

Это самая полная и продвинутая версия эксперта Start Trade. Отлично зарекомендовавшая себя. Ссылка: https://www.mql5.com/ru/market/product/39225 В платной версии вы получаете: более проработанную механику Траллинга ордеров. более прочная связь между параллельно открытыми валютными парами. дальнейшие обгрейды и поддержку. Коротко о главном.
Для начала торговли достаточно небольшого депозита. Идеален для быстрого разгона депозита!!! Подходит для мультивалютной торговли. Невосприимчивость к больш

The adviser works on the indicator, the martingale is used in the strategist, and when you turn it on, you can disable it in the settings. Recommended pair USDCHF
extern int Sl = 0; // SL extern int Tp = 50; // TP extern int Tral = 10; // Trailing 1 pp extern int magic = 3456346; // Magic extern double lot = 0.01; // Lot extern bool ilan_martin = true; // true or false ex
Convergence Pro is a fully automated expert adviser that uses a model of trading designed to find entries at retraces, retrace extremes, and reversals. A safe multiplier is employed in order to recover unprofitable trades and maximize profit. This EA is always trading, relying on the convergence of trend exhaustion points at multiple time frames to take advantage of reversals. Convergence Pro is currently designed to work on the M30 timeframe . Demo signal currently resides here: https://www.
FREE

Good looking overview panel for the current instrument showing: Instrumentname Flags of involved currencies for forex or indicies Bid/Ask price Spread The look and location of the panel can also be configured. Here the desctiption of the useable parameters: panelFontName : Name of the system font that is used to paint all text. panelBackgroundColor : Background color of the panel. panelNeutralColor : Color of the text within that panel. panelBorderColor : Color of the panel border panelBorderAl

This EA uses strategy which works year after year. It makes an entry in the market early enough when the trend shifts at Price action verified supports and resistance levels. why renting/Sell it when l can make enough using it? Well to be honest, am renting/selling out just to raise enough Capital for trading. Those who buy it are fortunate as it won’t be available after raising capital. Let’s discuss the Parameters to have an idea of how it trades. Name of EA =Triumph Forex Strategy Properties

Jealous about the colorful fibonacci tools in tradingview? Here is the solution for MT4! You can turn your existing charts into colorful masterpieces by adding this tool. Bring your presentations, webinars to the next level and attract more users when posting or sharing your analysis.
Simply add the indicator to the chart and your fibs will turned into the colorful ones. Don't loss your objects! They will turn back into "standard" objects when the indicator gets removed.
Watch this video to

Very often, the trader is faced with the task of determining the extent to which the price may change in the near future. For this purpose, you can use the Johnson distribution type SB. The main advantage of this distribution is that it can be used even with a small amount of accumulated data. The empirical approach used in determining the parameters of this distribution, allows you to accurately determine the maximum and minimum levels of the price channel. These values can be used in differ
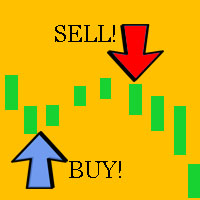
Ready trading system that gives the trader buy and sell signals. It is enough to place the indicator on the chart, it automatically analyzes the market situation, determines the direction of the trend, calculates support and resistance levels, analyzes the price movement dynamics and shows the trader on the chart in the form of arrows the moments when it is necessary to open orders and in what direction.
Trading strategies with ScalpingCircles: Trading with these signals is very simple. Add a
QGrid is a trading robot for the EURUSD currency pair and the M1 timeframe.
Trading strategy. The first order opens on two Moving Average indicators. If the order is included in the profit, then it closes, and everything starts anew. If the order is at a loss, then gradually the grid of orders opens. When the grid goes into profit, it closes and everything starts all over again.
Options. qauto = true - set parameters automatically. For optimization, set to false. qperiod1 = 14 - the period of
The high and low band points made strictly according to Dow's theory can be used to distinguish the position of support and resistance, to identify the starting point of trend, and to stop and stop loss.
Whether you are a trend trader, an day short-term trader, or a scalp trader, I believe this indicator will be of great help to you.
For example, when the price goes down through the green line, the current short trend starts, and when the price goes up through the red line, the bull trend

indicator for trading binary options and forex trading. The indicator does not redraw the readings. when trading binary options, testing was performed. This indicator showed the good results correct predictions.
Under these conditions, the eur / usd m1 chart, when a signal appears, the transaction opens in the direction indicated by the indicator for 5 candles, then the truth is (5 minutes since in us the 1-minute chart of a candlestick is 1 minute) the result was.
When trading in the forex m

Robot nest is a robot advisor working on price levels calculated using a quantum system. The advisor is made with static flexible settings, which allows you to most accurately determine the price levels. There is an opportunity to work with a change in the period of the estimated time. The Expert Advisor applies security varnishing orders and fixes the profit only with a positive balance. Suitable for any style of trading, scalping, medium and long-term trading. It is possible to use martingale

The EA is not a scalper. The EA uses a strategy based on the breakdown of local support and resistance levels, also uses the reverse and rebound from support and resistance levels. The EA is based on the original author's strategy. Real monitoring: https://www.mql5.com/en/signals/author/profi_mql Detailed description of the strategy here: https://www.mql5.com/ru/blogs/post/728430 This is a link for general discussion of the EA: https://www.mql5.com/ru/blogs/post/728430 Hidden Take profit,

Indicator patterns Price Action. The indicator uses in its work 12 patterns, a trend channel and horizontal price lines (support and resistance lines). You can work both by channel and lines, or simply by patterns. Some patterns are customizable. Below is a small manual.
Period of candles: Set the period on which the indicator will work.
Parameters of information on the chart
Consider trend and horizontal lin

Curiosity 7 The River It is an advanced trading system. This is a fully automatic Expert Advisor, which allows you to presize the trade according to the preferences of the trader. Curiosity 7 have more than 260 customization options for your trade. Different options for different styles of trade. Curiosity 7 The River is a Trend system of trade with different algorithm of trade mode. This EA using signals to place orders. Is a revolution in the customization of the trading. The algorithms d
GAP Hunter EA
The expert's trading strategy is based on finding a gap (price gap) that occurs after weekends and holidays. Basically, the majority of gaps closes on the same day or within several days, the expert tracks such price gaps and when it arrives opens an order in the opposite direction in the direction of closure.
There are settings to search for gep only on Monday, search for gep every day on the shift of days, and 0-24 gap search around the clock.
In the settings there is a sprea

Expert Pro Scalping GBPUSD works at night taking small profits! The system passes the test from 2000 to the current day! The system is long-term and will not give you a sharp increase in the deposit! The expert uses independent strategies, including trading in short-term and long-term trends! Attention, the profitability of the system is not in one year, but in a couple of decades! It is for the patient! Take a test from 2000 to the current day to understand!
The price of the adviser will gro

DailyFx - EA for scalping. Works on the principle of a smooth analysis of the market and the determination of peak wave values. With the help of three adaptation algorithms, EA systematically scans the time segments of the price chart by determining the impulse points of contact between demand and supply. The smoothed neural network algorithm, learning from historical data of price behavior, predicts its further behavior.
Trading with the indicator is very simple. To do this, simply place the

This Expert Advisor is based on the Williams percent range strategy . It was developed by Larry Williams and it compares a closing price to the high-low range over a specific period. Williams percent range can be used in various capacities that can help us determine momentum confirmations, overbought and oversold readings, strength of the trend and potential buy and sell signals.
Key Features
Timeframe: H4
Currency pairs: GBPUSD
Use only five-digit accounts
Minimum deposit: $ 100
It is recom

Quantum nest is a robot advisor using trade hedging. Refers to trend advisers, working on a quantum variable system.. The Expert Advisor applies security varnishing orders and fixes the profit with only a positive balance. Suitable for any style of trading, scalping, medium and long-term trading. It is possible to use martingale in trade. The Expert Advisor works on all market instruments of the MT4 platform. ATTENTION! First of all, before work, it is necessary to optimize the adviser on your

Stick - уникальный авторский индикатор, отображающий сигналы в направлении основной тенденции, и против нее. Благодаря разнообразию настроек и фильтров индикатор можно настроить под свой стиль торговли. Stick подходит для любого таймфрейма, валютной пары. Сигналы индикатора не пропадают ни при каких условиях. Отличительной особенностью является возможность настроить сигналы индикатора отдельно для тенденции и против нее. С помощью Stick можно открывать сделку только в направлении основного д

The Force One Scalper is a fully automated scalping Expert Advisor that you can use to backtest a 10-year of data with modelling quality of at least 90%. It uses only an entry analysis based on a proprietary multiple trades maneuver analysis and settings to detect price breakout movement. The success secrets of the Expert Advisor if back-tested and forward-tested correctly are the combination of the entry method with the Money Management and multiple exit strategies. Once opportunity level is
Strike Line is an accelerator combining in itself a large number of the best tools filtered An exclusive algorithm ...
-------------------------------------------- It is great for scalping or binary options trading this the tool does not lag he draws there is a multi currency with him very simple work use given the tool stands with additional filters for example, like makdi or bolinger waves ......

This EA works with fast and long movements. This EA is a full version with MAX Lot 1000 Only on EURUSD timeframe 1 min.
Start with 50USD or 100 USD
This EA is a mix of Team Austria and IO9 where Terminator does not need such a fast speed as IO9.
This version is, so to speak, a lite version with the limit of max 1 lot.
The first trades with it were made on an ECN account with a VPS of 23 MS.
Nevertheless, we recommend a slightly faster connection to the broker.

FXRog = Forex Running On Growth
Expert Advisor description ShortTerm : Yes MidTerm : Yes LongTerm : Yes TargetProfit : By Money (fixlot mode), value can be changed in the parameter. 3% (volumelot mode) StopLoss : By Maximum Open Position, all position will closed when maxtrade is reach, value can be changed in the parameter optimum time frame H1 eurusd
Parameter description StartTrade : begining time to start trading EndTrade : last time ea to open a position MoneyManagement : 1 = FixLot,
FREE

NearTheMarket is a fully automated trading EA with an excelent predicting criteria to enter into Market. First it opens market orders, buy or sell, with a predefined Take Profit. If after a specified time the trade is still open, the robobot deletes the Take Profit and opens a limited order with a lots amount equal to a multiple of lots of the market order. The mission of the robot is to get the PayOffPrice (average price of the net position) closer to market price. Again, if open orders are on
FREE

Pegasus Pro works on based on HFT (high frequency trading) algorithm , but it’s so sensitive, it’s 100% automatic,Pegasus Pro is capable to scalp every different situation ,Please try Backtest with the lowest spread : ( MAX 5 for majur currency ) Because the ECN accounts Types have very low spreads , Maximum Ms for VPS: 5, do not forget to get this Ms your broker's server address must be in the same place with your VPS address Live signal, https://www.mql5.com/en/signals/2256700?source=Site+S

A great indicator that allows one to spot reversals, and follow a trend easily, on any timeframe. Works on any forex pair and other instruments. Works extremely well on exotic pairs It changes colour and direction and can be set to provide an alert for both long and short trades. It can also be used to set the stop loss and manually trail the trade. The indicator can be used on different timeframes easily, and is reliable in that it does not change during slight market corrections, once a tren

This EA loads Support & Resistance Trend Lines and trade purely based on price action of Trend Reversal strategies. No effect with manual entry. It is possible to use this Expert Advisor as indicator. It also featuring safe virtual Hedging method as recovery as well MANUAL entry by using control panel. Auto Strategy: Swing Reversal Patterns and Major Trendline Breakout with trailing TP & Stop. Manual Strategy: BUY/SELL using Control Panel on chart with trailing TP & Stop. Operating Procedure U

By checking Trend direction by 3MA at trading time frame and upper time frame With Intelligence Averaging system ,This EA " FX Smart " is made. This is very constant steady monthly profits EA ,As you know well Backtest Result has no News Control. so On real will be more steady Profits and low DD M5 EURUSD Recommended. Min 500USD , 1:400
Using News Filter, Please protect unexpected entry during News , So Please add at MT4 Tools/Options/ExpertAdvisors URL: http://ec.forexprostools.com/

Daily GBPUSD trade Our strategy relies on a choppy movement on most Forex pairs during the Asian session. Most traders in London sleep when the Sun shines over the Pacific and this results to a very slow movement of GBPUSD pair between 9:00 PM GMT and 7:00 AM GMT.
Input Parameters: Auto GMT shift extern int Broker_GMT_Shift = 0;//Manual Broker GMT shift extern int London_Night = 21; //London Night extern int London_Open = 7; //London Open

Funcionamiento:
Little Shoutgun funciona de la siguente manera: En el momento en que usted ponga el EA a funcionar, éste colocara ordenes pendientes de compra hacia abajo del precio, cada 1.5 pips o 15 puntos (dependiendo del broker) y ordenes pendientes de venta hacia arriba del precio. Cerrara las operaciones con 2.8 usd de ganancia cada una hasta llegar al 25% del balance inicial; si se inicia con una cuenta de 100 el robot se reiniciara cuando el valor liquido sea igual a 125. Una vez que
This EA has been developed for EURUSD M30 timeframe, everything is tested and ready for immediate use on real account. This Expert Advisor is based on mean reversal by KELTNER CHANNEL indicator. It uses LIMIT pending orders with FIXED Stop Loss . To catch more profit there is also a TRAILING PROFIT function provided. At 9:00 pm we are closing trading every Friday to prevent from weekly gaps. !!!Adjust these times to your broker time. Preset values are for UTC+2 only!!! For every candle
RSIbot - expert adviser which based on indicator RSI. Lot for 10000USD: Lot for 5000USD: Lot for 1000USD: Lot for 100USD: high risk = 2; high risk = 1; high risk = 0.5 - 1; high risk = 0.1; medium risk = 0.5 - 1; medium risk = 0.5; medium risk = 0.1; medium risk = 0.01; low risk = 0.1; l

ADX arrow
Bu gösterge, ADX göstergesinin sinyallerini (Ortalama Yön Hareket İndeksi) grafikte nokta olarak görüntüler.
Bu, sinyallerin görsel olarak tanımlanmasını kolaylaştırır. Göstergede ayrıca uyarılar (açılır mesaj kutuları) ve e-postaya sinyal gönderme bulunur.
Parametre: Period - ortalama süresi. Apply to - hesaplamalar için kullanılan fiyat: Close, Open, High, Low, Median (high+low)/2, Typical (high+low+close)/3, Weighted Close (high+low+close+close)/4. Alert - uyarıları etkinleşt

Metatrader grafiklerinde TP ve SL çizgilerinin toplam değerini hesaplamak için zaman harcamaktan sıkıldınız mı? Aradığınız çözüm burada! Ekranınızın herhangi bir köşesinde pozisyonlarınızın toplam SL ve TP'sini kolayca takip etmenize olanak sağlayan ücretsiz MT4 göstergemizi tanıtmaktan mutluluk duyuyoruz. Özelleştirilebilir X-Y parametreleri ve renk seçenekleri ile ekranınızı ticaret tarzınıza uygun hale getirebilirsiniz. Pozisyonlarınızı takip etmek için yaşadığınız zahmet ve kafa karışıklığın
FREE

Th3Eng PipFinite PRO Indicator This product is distinct from the Th3Eng PipFinite Original, utilizing a different logic and algorithms. The Th3Eng PipFinite Pro indicator offers analysis of trend directions using custom algorithms. It provides indications of trend direction, entry points, a stop loss point, and three take profit points. The indicator also displays pivot points, dynamic support and resistance channels, and a side-box with detailed current signal information.
How to Trade with T

Arrow signal indicator for scalping Defines price reversals, kickbacks and trend changes All arrows remain in place and do not disappear Can send notifications to your phone or email Works on any currency pairs, metals and cryptocurrency Suitable for working with binary options Distinctive features Does not redraw; Defines trend changes; Sends signals to a smartphone or email; Advanced settings for fine tuning; Works on all timeframes and on all symbols; Suitable for trading currencies, metals,

Mars 7 is a Trend indicator is a powerful indicator of TREND CHANGE for any par and any timeframe. It doesn't requires any additional indicators for the trading setup.The indicator gives clear signals about opening and closing trades.This Indicator is a unique, high quality and affordable trading tool.
Perfect For New Traders And Expert Traders Low risk entries. Never repaints signal. Never backpaints signal. Never recalculates signal. For MT4 Only Great For Scalping Great For Swing Tradi
(MT4 to Telegram) - Fast and instant publication of your trade in the telegram channel (chat or personal message). F rom version 1.77 it sends Alerts of any indicators in telegram!
!!!Attention!!! If you want to test all the functions of this utility please contact me and get this advisor for 1 month for FREE! TTS can send the following messages in all languages: Opening a new position; Placing a pending order; Pending order activation; SL and TP modification; Pending order price modif

Trend Fo is a fully automated expert advisor. This expert advisor is based on Trend Trading Strategy.
This trading algorithm can be applied across any markets. When will get more buying pressure, which results in higher prices (uptrend), on the other hand,
when will get more selling pressure, which results in lower prices (downtrend) and when will trend trading stop working (sideway). For trend trading:
-high win rate
-better risk to reward
-trading with the trend
-adopt a swing trading appro

This indicator can be interpreted as a trend and channel indicator. The indicator divides the market into two parts. In one part, it is more promising to buy, the whole price zone is allocated for purchase. In the other part, for sale, there is also an entire zone. If you work with algorithms such as grids or catch-up, then this indicator is very good to use for work.

Creature - is an automated trading system - trend scalper. EA work strategy: The trades are made at rollback from main trend. Indicator Bollinger Bands is responsible for trend and channel determination. The EA opens orders at channel breakdown for definite value of points. False enters are filtered by breakdown minimal price bounce limiter resulting in loss trades cut.Orders can be closed at take-profit, trailing-stop, stop-loss and at defined time elapse. Time limit of the EA work is availabl
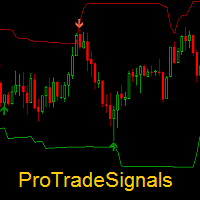
Dear traders, ProTradeSignals is a professional trading indicator. It performs Multi time frame analysis using Price- Volumes- Volatility. Main indicator alongwith its adaptive bands helps in trading in different market conditions.
Please refer to attached video for detailed information on the indicator.
If you have any further queries, feel free to write to use.
Thanks for showing interest in this indicator.
About us: We are a small team of professional traders with experience in forex- s

Update: Push to mobile notification is now added as optinal in the settings. Most traders fail to generate profit because of the lack of so-called filters and scanners. If you want to win at trading you need a solid system and also a filtering tool for some or all of your entry criteria. It is impossible to follow 24 currency pairs, all the indices, stocks and commodities without a filtering tool. Imagine you can get an email any time CCI crosses bellow 100 and 0 when the price is bellow MA5 an

A simple indicator algorithm with the highest accuracy generates input signals by intersecting lines. Strategy for trading by trend, filtering and all the necessary functions built into one tool! The principle of the indicator is to automatically determine the current state of the market when it is placed on a chart, analyze historical data, based on historical data and display instructions to the trader for further actions. The system itself shows in the form of intersection of lines when to bu

Intraday Volume Profile Forex MT4 Intraday Volume Profile - This is a visualization tool for understanding the high activity zone and low activity zone, as part of the D1 senior timeframe. The volume profile provides an excellent visual image of supply / demand at each price for the selected timeframe. Introducing POC - Point of Control, which indicates the price at which the maximum volume was sold, as well as Value Area - the area where 68% of the instrument's assets are traded. POC -
This EA has been developed for DAX (GER30) M15 timeframe. It also works very well on the same market and TF M30 and M5. So you will get 3 strategies for lower price, that means better equity curve, higher profits and lower drawdowns. Everything is tested for M15 timeframe, tests are made also for M30 and M5 TF . Strategy is based on continuation of TREND by HIGHEST channel after some period of consolidation. It uses STOP pending orders with FIXED STOP LOSS . Strategy uses also some BREAKEV
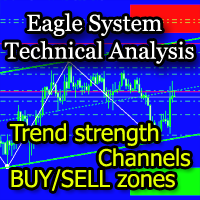
The EagleSystem indicator is a complete trading system.
The indicator algorithm determines wave movements, price channels formed, Pivot-levels, zones of intended purchases and sales (overbought / oversold zones).
The indicator can be used both independently and as an addition to any trading system.
Settings Alert for turning points - Alert when forming a point; Send Emails - Send to e-mail; Display the EagleSystem - Show price peaks; Alert at the color dot change - Alert when the dot changes

The indicator algorithm with the highest accuracy generates input signals using the arrows. Strategy for trading in a flat, all the necessary functions built into one tool! The principle of the indicator is to automatically determine the current state of the market when it is placed on a chart, analyze historical data, based on historical data and display instructions to the trader for further actions. The system itself shows in the form of arrows when to buy and when to sell.

Advisor Information: EG Connection Alert FREE every hour sends simple push notifications about the presence of a terminal connection to the server.
The utility will be useful to you if automated trading is carried out on a remote machine and there is no possibility to constantly check the operation of the terminal. Just install the adviser on any chart with any timeframe. You will receive notifications about the connection every hour. If no notifications are received, the terminal should be chec
FREE

We present you NeuroIntelligence Advisor . Advisor is recommended to use on TimeFrames (M1) and with Spread less than 13 pips. Recommended pairs for trading EURUSD, GPBUSD, USDCAD, AUDUSD, USDJPY. Options Risk- This parameter means - what risk will be involved in the transaction ( Low Risk - 3% / Mediam Risk - 10% / Deposit Overclocking - 15% ). Orders Magic Number - This parameter means what the Magic Number of open orders will be. FullRisk - This parameter increases StopLoss many times, but

*Translated from Russian using Google translator Advisor Information:
EG Connection Alert with the frequency specified by you sends Push notifications about the presence of a terminal connection to the server and a change in the deposit balance.
The utility will be useful to you if automatic trading is conducted on a remote machine or several and there is no possibility to constantly check the operation of the terminal. Just install the adviser on any chart with any timeframe. You can also ins

Magic Trend Signal Arrow is an indicator that generates trade arrows. It generates trade arrows with its own algorithm. These arrows give buying and selling signals. The indicator certainly does not repaint. Can be used in all pairs. Sends a signal to the user with the alert feature.
Trade rules Enter the signal when the buy signal arrives. In order to exit from the transaction, an opposite signal must be received. It is absolutely necessary to close the operation when an opposite signal is rec

Hello guys, This is my New EA. You can try this. But first note few things. This EA has high risk, high drawdown. So your deposit should be large enough to use this EA. This EA use only pending orders. No complex strategy. Only use this EA for positive swap charge trades . Because some orders must hold for long term for hit TP. Use minimum lot size(0.01) to trades and use a trading account that can open 1000 open position or more. minimum deposit 10000USD or if you use cent account you can sta
FREE

SrEwo Expert adviser designed and optimized for EURUSD. You may Optimize all other instruments. It is easy to use. *** It uses only M5 chart graphic and you need to use M5. ( Both test and live ) Input Parameters: Lots: Base lot amount.Expert use this amount as referance. crossfactorlimit: expert will open new order with this limit modifylimit & TP limit : order modify and another TP limit. targetprofit : expert calculates this number in its logic. crossfactor : next order lots multiply with t

Base Trading System (MTF) MULTI TIME FRAME
For Single Time Frame click here BASE TRADING SYSTEM MTF is a useful tool to trade with simple strategy. It draws automatically base up for long trade and base down for short trade. Clear trade when base is going opposite direction. User can trade by instant market entry or by pending order entry. It depends on user best strategy. input: Arrow UP, Arrow DOWN. Base Box Color- UP base box , DOWN base box, UP base shadow, Down base shadow.

Expert's signal link has been working on 25 different instruments since 09.07.2019. It will be stopped after a while. https://www.mql5.com/en/signals/605823 This expert advisor works well on daily charts. Opens a pending order based on daily price movements and may revise this pending order based on price movements during the day. It can keep the current order by following the price movements and can open two different types of additional orders as soon as it sees the opportunity. If he sees t

This dashboard is designed and simplified for use on the standard mt4 terminal. There are 1 spread columns and adjustable signal columns for 5 different timeframes. For the signals, I used a special indicator that I developed and called mars. I haven't published the Mars indicator in the market yet. You can use this indicator only as dashboard signals. I'm in preparation for an expert for the indicator, and I will publish it when it's ready. ( Published https://www.mql5.com/en/market/product/40

Marsi Expert is an effective advisor especially at low spread rates. Tested and designed on M5 & H1 chart in EURUSD. There is no input option other than lot selection and Magic number selection. The other settings will be adjusted according to the time period of the chart you will put on the Expert. Advanced versions will be updated with renewed sales price. * Must be tested on demo accounts before using in real account, due to your broker behavior.
MetaTrader mağazası, alım-satım robotları ve teknik göstergeler satmak için en iyi yerdir.
MetaTrader platformu için ilgi çekici bir tasarıma ve iyi bir açıklamaya sahip bir uygulama geliştirmeniz yeterlidir. Milyonlarca MetaTrader kullanıcısına sunmak için size ürününüzü Mağazada nasıl yayınlayacağınızı açıklayacağız.
Alım-satım fırsatlarını kaçırıyorsunuz:
- Ücretsiz alım-satım uygulamaları
- İşlem kopyalama için 8.000'den fazla sinyal
- Finansal piyasaları keşfetmek için ekonomik haberler
Kayıt
Giriş yap
Gizlilik ve Veri Koruma Politikasını ve MQL5.com Kullanım Şartlarını kabul edersiniz
Hesabınız yoksa, lütfen kaydolun
MQL5.com web sitesine giriş yapmak için çerezlerin kullanımına izin vermelisiniz.
Lütfen tarayıcınızda gerekli ayarı etkinleştirin, aksi takdirde giriş yapamazsınız.