YouTube'dan Mağaza ile ilgili eğitici videoları izleyin
Bir alım-satım robotu veya gösterge nasıl satın alınır?
Uzman Danışmanınızı
sanal sunucuda çalıştırın
sanal sunucuda çalıştırın
Satın almadan önce göstergeyi/alım-satım robotunu test edin
Mağazada kazanç sağlamak ister misiniz?
Satış için bir ürün nasıl sunulur?
MetaTrader 4 için teknik göstergeler - 108
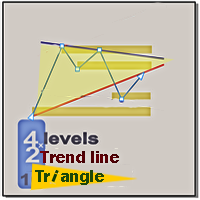
To download the one-month demo version of the indicator, refer to the following link https://s21.picofile.com/file/8445191876/L_TL_T_exp_2022_02_02.ex4 Supply and demand In all indicators that have the task of drawing support and resistance, the number of levels is so high that it causes a trader to make a mistake. We draw the last 4 important and valid levels for you using the Price Action method These surfaces are not easily broken and their breaking is done with long and powerful candlest
Warning: Our product works with 28 symbols. The average accuracy level of the signals is 99%. We see signals below 15 pips as unsuccessful.
Signal Plus indicator is designed for signal trading. This indicator generates trend signals.
It uses many algorithms and indicators to generate this signal. It tries to generate a signal from the points with the highest trend potential.
This indicator is a complete trading product. This indicator does not need any additional indicators.
The indicator

Warning: Our product works with 28 symbols. The average accuracy level of the signals is 99%. We see signals below 15 pips as unsuccessful.
Technique Signal indicator is designed for signal trading. This indicator generates trend signals.
It uses many algorithms and indicators to generate this signal. It tries to generate a signal from the points with the highest trend potential.
This indicator is a complete trading product. This indicator does not need any additional indicators.
The indi

Unknown Star is a Forex indicator that performs mathematical calculations, predicting market changes and greatly facilitating the calculation of prices in the future. The mission of market indicators does not end with price predictions. It informs the trader about important changes - including the second when the price gains or exceeds the value. The work of Unknown Star frees the trader from making calculations with his own hand. The market participant can only correctly assess the indicator's

The Judge indicator shows potential market reversal points. The indicator shows favorable moments for entering the market. The indicator's smart algorithm detects the trend, filters out market noise and generates input signals. The indicator can be used as the main one for determining the trend. The indicator can work both for entry points and as a filter. Uses two parameters for settings. The indicator uses color signaling: blue - when changing from descending to ascending, and red - on the con

Gartley Hunter - An indicator for searching for harmonic patterns (Gartley patterns) and their projections. The indicator is equipped with a system of alerts and push notifications. Manual (Be sure to read before purchasing) | Version for MT5 Advantages
1. 12 harmonic patterns: 7 classical and 5 exotic. New patterns will be added as the indicator develops. 2. Constant automatic search for harmonic patterns. The indicator is capable of finding from the smallest to the largest patterns. 3. Automa

The principle of operation of the Channel Intellect indicator is to work inside the channel. But the parameters and width of the channel are selected in such a way that when the channel is broken and the trend moves, there will be a close in the red and these disadvantages are balanced enough, which is shown on the chart by the inscriptions near the arrows. You can see that the arrow signal does not appear every time the channel is broken. Because the indicator has a volatility filter that has

Distinctive is a forex trending arrow indicator for identifying potential entry points. I like it, first of all, because it has a simple mechanism of work, adaptation to all time periods and trading tactics. Created on the basis of a regression channel with filters. Plotting the Lawrence indicator signals on a price function chart using a mathematical approach.
How it works - when the price breaks out in the overbought / oversold zone (channel levels), a buy or sell signal is generated. Everyt

AnalizatorMTF is an oscillator indicator, a more progressive version of the indicator, with easy customization and ease of use. The following levels are used to identify signals: 0; 0.75 / -0.75; 0.9 / -0.9, as well as the configuration of the indicator curve itself. The difference from other similar indicators is in the pointers of entry points in the form of arrows of the corresponding direction and color and the possibility of displaying higher timeframes on lower ones.
The indicator can be

AnalizatorSSRC is an oscillator indicator that is easy to set up and easy to use. The following levels are used to identify signals: 0; 0.75 / -0.75; 0.9 / -0.9, as well as the configuration of the indicator curve itself.
Its main difference is the absence of a signal line and signals associated with its intersections. The indicator can be used as part of various strategies. Like other oscillators, it shows trend and flat zones, as well as oversold and overbought areas.

The Wonderful trend technical indicator is used to analyze price movements in the Forex market. It is very practical in that it forms arrows in places where buy signals appear, or, conversely, sell signals. The indicator helps to analyze the market at a selected time interval. He defines the mainstream. The Driver trend indicator makes it possible to classify the direction of price movement by determining its strength. Solving this problem helps investors enter the market on time and get a good

Hacksaw is a trend indicator used in the Forex markets. Sharp price fluctuations are ignored, as well as noise around average prices. Signal points, where the color changes, can be used as potential market reversal points. The advantage of the indicator is its simplicity of settings and a call to action.
Naturally, do not forget that any indicator is only an assistant, and not a magic tool, by the will of which you will become fabulously rich.
Unfortunately, many novice traders forget about t

The trend step indicator Cattivo analyzes the state of the market, the phase of its movement and largely determines the success of a trader in his difficult work. Cross points of the Cattivo technical indicator can be used as potential market reversal points. Thus, all intersection points will be optimal points at which the movement changes taking into account the indicator period.
Many newbies who first enter the market are often more fortunate than a professional who has spent years learning

Auto Fibonacci Button The Fibonacci retracement is a popular and reliable technical analysis tool for traders to determine support and resistance areas. It employs the "Golden Ratio," a mathematical pattern seen throughout nature and even the universe, to forecast particular levels of support level and resistance level. This tool is generated in technical analysis by dividing the vertical distance between two extreme points on the chart (typically a peak and a low) by the important Fibonacci

I recommend you to read the product's blog (manual) from start to end so that it is clear from the beginning what the indicactor offers. This multi time frame and multi symbol supply and demand zone dashboard indicator sends alerts when the price has reached a supply/demand zone. It is also possible to use it to be alerted about regular double tops/bottoms instead of zones. It can be used with all time frames from M1 to MN. It is possible to use RSI, divergence (MACD, OsMA, RSI or Awesome) a

The “Market maker move" indicator is written for trading GOLD on M5 The indicator perfectly confirms the rebound or breakdown of the support and resistance levels. The indicator does not lag, does not redraw, and does not change values during testing. With proper use of the “Market maker move" indicator, you can trade almost without drawdown. To do this, you just need to plot the support and resistance levels on the chart. The “Market maker move" indicator is a powerful assistant for trading. Th

The indicator implements a kind of technical analysis based on the idea that the market is cyclical in nature. Tracks the market trend with good reliability, ignoring sharp market fluctuations and noise around the average price. Thus, all intersection points will be optimal points at which the movement changes taking into account the indicator period. It catches the trend and shows favorable moments of entering the market with arrows. Crossing points can be used as potential market reversal poin

Determining the market trend is an important task for traders. The Inside indicator implements an improved algorithm for visualizing the market trend. The main purpose of the indicator is to evaluate the market on small timeframes (i.e. M1, M5 and M15) for scalping. If you are a scalper looking for a reliable indicator to improve the quality of your trading, Inside is what you need. The indicator works in a separate window, showing red and green bars on the histogram. Two consecutive green (red

Greetings to you!
I want to present to your attention a new product. It's not just an indicator - it's a whole system: a mix of several CCI oscillators , a signal moving average (MA) , an additional oscillator index (optional) and matrix calculations .
You don't have to do a complex analysis of the indicator. This system is equipped with arrows notifying about entering the position. It have are signals that will allow you not to follow the chart, in fear of missing the entrance to the mark

[ MT5 Version ] How to trade using the Fear and Greed Indicator: Click here Uncertain about when to take total or partial profits? The Fear and Greed is your reliable companion for making confident trading decisions. This innovative tool offers unparalleled insights into market sentiment, helping you identify key pivot zones and optimize your trading strategy. Why Choose Fear and Greed? Revolutionary Market Insight: Sentiment Analysis: The first indicator for that reveals the market's Fear and

The correlation coefficient reflects the relationship between two values. It shows the dependence of changes in one value on changes in another. For example, from changes in the price of EURUSD and EURNZD. The correlation coefficient in trade, currency relations is constantly changing. Special indicators of correlation help to define it, trace changes, draw correct conclusions. One of them is the Hubbles Correlator indicator. The indicator allows you to simultaneously display several other char

Colored candlesticks showing the trend based on two moving averages and the slope of the slow moving average. For long term trends use Period2 = 200. Convenient to filter trends according to your trading strategy The time unit also depends on your trading style Gives you a signal for each trend, displayed on the screen coloring the candlesticks. No sound signal; no push notification; these functions will be there in the next updates

A technical indicator that calculates its readings based on trading volumes. It has an oscillatory line that follows the change in volumes.
Large arrows on the line indicate reversal values. A channel is built around the line with small arrows showing the strengthening of price movement in the direction of increasing volumes.
The indicator does not redraw values. Works on any instrument and timeframe. It can complement any trading strategy by finding a trend or make entries in the direction of a

the indicator will show signal arrows on the graph at the crossing two EMA it has push and audible alerts. By crossing above each others , a blue arrow will come out for the BUY, at the same time an audible signal will sound. By crossing Below each others, a red arrow will come out for the SELL, at the same time an audible signal will sound. Possibility to deactivate push and audible alerts.

the indicator will show signal arrows on the graph at the crossing of Awesome Oscillator base level it has push and audible alerts and Email alert. By crossing above base level , a blue arrow will come out for the BUY, at the same time an audible signal will sound. By crossing Below base level, a red arrow will come out for the SELL, at the same time an audible signal will sound. Possibility to deactivate push and audible alerts. MT5 version : Buy the 'Awesome cross MT5' Technical Indicator fo

the indicator will show signal arrows on the graph at the crossing of MACD level it has push and audible alerts. By crossing from low to high level 0, a blue arrow will come out for the BUY, at the same time an audible signal will sound. By crossing from low to high level 0, a red arrow will come out for the SELL, at the same time an audible signal will sound. Possibility to deactivate push and audible alerts.
MT5 : Buy the 'MACD Arrow' Technical Indicator for MetaTrader 5 in MetaTrader Marke
Forex indicator for day trading for beginners. This indicator shows with arrows when the price turns in the other direction. At this moment, you can conclude deals. The indicator trades on H1, H4 timeframes. The indicator also shows the trend direction with lines. During the day, you can open deals in the direction of the trend and set a minimum 15-20 points of TakeProfit. When one deal is closed by take profit, you immediately open another deal in the direction of the indicator line.
How the D

High Probability Reversal Indicator The indicator looks for trend exhaustion areas, and plots Buy/Sell arrow after confirmation of trend exhaustion. Signals can also be shown as popup alerts, or be sent as e-mail or mobile phone notification. Trades can be taken on breakout of the signal candle. Inputs
Signal Type: Aggressive/Normal History Bars : Can be set to 0 (zero) to show all historical signals, or can be set to a limited number of bars for faster execution. Show Alert : True/Fal

Meta Trend Indicator is an efficient way to forecast and detect the trend in any market. It reveals the trend, support and resistance levels, volatility and the maximum potential target, all in one indicator. To adapt to the price and to decrease consecutive trend failures, the internal trend detector algorithm studies the market and dynamically chooses the right values for the internal parameters. This indicator is a perfect trend filter for any strategy or expert advisor. Features Super Adapti

the first release of the new year's special promo price.normal price 150 USD. important user guide is here https://heyzine.com/flip-book/62a16c6955.html indicator to speed up finding support and resistance price.very easy to use very neat interface.doesn't display unnecessary confusing things.uses basic trading strategies for professional traders.....happy trading if something is still not clear,please contact me personally,i will reply later

Qv² OBOS is an indicator that aims to identify overbought and oversold regions considering price standard deviation and volume analysis.
Oversold signals are indicated by arrows pointing upwards.
Overbought signals are indicated by arrows pointing downwards. Can be used in all timeframes. Can be used on all pairs. I use in H1 Important note, the histogram is displayed to improve the trader's analysis. But the signs of overbought and oversold are the arrows as mentioned above.
Important note:

Канальный индикатор "Snake" . Отлично показывает точки входа и выхода.
Не перерисовывает!
Хорошо подойдет для стратегий с сетками (усреднения), стратегий с пирамидами (стратегий добора), обычной торговли по тренду, торговли на коррекции.
Для любых типов инструментов: валюты, нефть, металлы, криптовалюты. Для любых таймфреймов: от M1 до D1 . Для любых стилей торговли: скальпинг, интрадэй, свинг, долгосрок .
Используйте в сочетании с трендовым индикатором, чтобы исключить риски входа про

Нестандартный индикатор определения текущего тренда. Альтернативный подход к определению текущей рыночной тенденции. В основе лежит уникальный алгоритм. Не используются скользящие средние , осцилляторы , супер-тренды и прочие стандартные индикаторы.
Для таймфреймов: от M15 до D1 . Для стилей торговли: интрадэй, свинг, долгосрок .
Может стать готовой торговой стратегией совместно с любым канальным индикатором. Например таким, как индикатор "Snake" . Внимание! Это индикатор, а не советник,
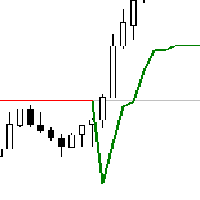
Based on supertrend indicator ,
get alert based on trend change of very popular SUPERTREND indicator..
Supertrend indicator can be used for both trend change setups or inline trend confirmation can be seen as trend continuation. providing as better entries and exits. or you can use supertrend indicator also as dynamic support and resistance zone.
When applied to chart Dashboard will scan and show current position of price with respect to supertrend indicator , and you will be able to get

The Qv² Trend is an indicator that aims to identify trends.
Buying trend signals are indicated by arrows pointing up.
Selling trend signals are indicated by arrows pointing down.
It can be used in all deadlines.
It can be used in all pairs.
I use it on the H1 with a period of 24.
Important note: I recommend using it in markets that naturally show trends. For in range markets I present my other indicator on this link OBOS
Fibonacci Breakout, Fibonacci düzeltmesini kullanan bir ticaret stratejisidir. Bu teknik aslında trendin başlangıcına girmemizi sağlayan bir tekniktir. Yeni başlayanlar için bile anlaşılması çok kolay. Strateji, otomatik özel fibonacci'nin görünmesini beklemeniz ve ardından bekleyen siparişinizi manuel olarak vermeniz, zararı durdurmanız ve Fibonacci seviyesinde kar elde etmenizdir. Fiyat başarılı bir yeniden test yaptığında pozisyon açılacaktır. Fibonacci Breakout Forex, Crypto ve hisse senetl

Coral Trade Planner is a 3-in-1 tool for making smart trades. The Lot Size Calculator lets you determine the appropriate lot size based on risk, and see the impact on your risk as you change the stop loss distance and/or lot size. The Trade Planner is an innovative tool for visualizing your planned trades on the chart, and gives you immediate feedback on the value of the trade (both the risk of hitting your stop loss and the reward of hitting your take profit). Both Market and Pending order

QV2 MA is an indicator that displays the results of two smoothed moving averages applied to Candles. Item 01 - Buy signal: Candle show color Aqua when the 4-period smoothed moving average is expanding and above the 24-period smoothed moving average. Item 02 - Sell Signal: Candle show color HotPink color when a 4-period smoothed moving average is expanding and below the 24-period smoothed moving average. Item 03 - The gray candle is an undefined region.
When the candle is gray, there are two rec
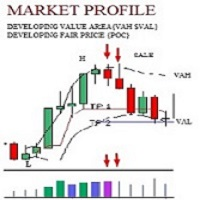
Turkish "Rusça yazın 'ÖNEMLİ UYARI – LİSANS VE AKTİVASYON GEREKLİ' Aktivasyon Talimatları: Satın alma işleminizi tamamladıktan sonra, lütfen hemen bizimle iletişime geçerek lisans anahtarınızı, şifrenizi veya aktivasyon detaylarınızı alın. Bunlar olmadan yazılım çalışmayacaktır. Sorunsuz bir aktivasyon süreci sağlamak ve sorularınıza yardımcı olmak için buradayız. Çok Dilli Özelleştirme Trading deneyiminizi geliştirmek için yazılımı birden fazla dilde tamamen özelleştirme imkanı sunuyoruz
This is a custom RSI of MA indicator consisting of 8 indices: AUDindex, NZDindex, CADindex, EURindex, CHFindex, GBPindex, USDindex and JPYindex. It can run on Forex brokers' servers having 28 currency pairs. No repaint.
How to Use When one of the 8 indices turns upwards, sell the strongest pair. When one of the 8 indices turns downwards, buy the lowest pair.
+ For newbies: Best trading has been detected on H1 chart in Euro session and US session to avoid sideways market Or use timeframe M5/M15

sarangani venom is 100% profitable, easy to use indicator, a chart without indicator is stressful and will lead you to many losses, this indicator is pleasing to the eye that will gives you more confident to trade when there is signal, your computer will gives sound and the spider will animate, it can be used to all time frame and to all currency, you have many options, when the candlestick touches to upper line it is buy, when it touches to lower line it is sell, when the rope is pull to buy ar

Xmaster göstergesinin yeni, daha doğru versiyonu. Dünyanın dört bir yanından 200'den fazla tüccar, en etkili ve doğru formülü elde etmek için bu göstergenin farklı kombinasyonlarının 15.000'den fazla testini bilgisayarlarında gerçekleştirdi. Ve burada size doğru sinyalleri gösteren ve yeniden boyamayan "Xmaster formül göstergesi forex yeniden boyama yok" göstergesini sunuyoruz. Bu gösterge aynı zamanda tüccara e-posta ve push yoluyla sinyaller gönderir. Her yeni tick'in gelmesiyle birlikte, 75'

Forex indicator " iron condor strategy " allows you to apply a very well-known strategy of options in the forex market. With the help of this indicator, you will know when to open a buy deal and when to open a sell deal. The "iron condor strategy" indicator shows you this information using the arrows on the chart. This will allow you to get information in which direction you need to open a deal by looking at the indicator signals in 5 seconds. Instead of analyzing the chart for an hour, now you
Waddah Attar Statistical Predictor
This indicator show you the Statistical Forecast for any symbol. it depends on a history data . the result show on a new day and still with no change until end of the day . with this indicator you can : know the main direction . know the range of the movement . know high and low in the current day . use indicator levels in any expert you made to auto trade .
Preferably used with main symbols like EURUSD, GBPUSD, AUDUSD, NZDUSD, USDJPY, USDCHF, USDCAD, Gold, S

Possible Price reversals levels - based on Fibonacci + Support + Resistance Levels Auto levels drawn based on input index (Bars Count ) ---->>> Price Over 50% Fibo line ---> UP TREND ---> BUY when price drop near Support Lines ---->>> Price Down 50% Fibo line ---> DOWN TREND ---> SELL when price goes up near Resistance Lines
--->>> The more close price levels ----> the more possibility for price reversals --->>> are you a scalper --> try it on M1 charts with big index like 5000 bars or

A trend indicator is a hybrid of several indicators that process data sequentially with signaling a trend change. Advanced net price action calculation to find LH and HL breakouts. Finishing the indicator data will give you excellent pivot points in the market. LH and HL signals can also be used for breakouts of the training. The indicator has proven itself well in a strategy based on impulse levels and false breakouts. When a breakout occurs, it indicates a strong reversal. A good filter for mo

Bella is one of the most popular indicators that allows you to timely identify a trend reversal, get an early entry point and pinpoint the place of profit taking. The Bella indicator implements the main idea of the trader and generates a point of entry into the market in the direction of the trend.
Bella is used when there are additional indicators. To filter such signals, you can use the same indicator on older timeframes. Thus, the work with the indicator is improved, while maintaining its

Here is a sensitive indicator for Dublgis professionals. It is built on completely new algorithms and is more efficient, on any timeframes, since it filters random price movements. Finds and visually displays price reversal points. This tool can be used as confirmation when making a deal, as well as to determine the direction of the trend and its strength. The indicator was developed as a complement to a number of our other trading tools.

The Context Aviation indicator analyzes the price behavior and if there is a temporary weakness in the trend, you can notice this from the indicator readings, as in the case of a pronounced change in the trend direction. It is not difficult to enter the market, but it is much more difficult to stay in it. The Context Aviation indicator makes it much easier to stay in trend! This indicator allows you to analyze historical data and, based on them, display instructions for the trader for further a
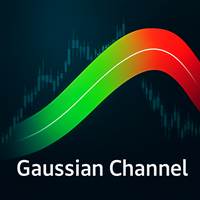
MT5 Version
Gaussian Channel MT4 Gaussian Channel MT4 is the first indicator in the market that uses Ehlers Gaussian Filter methods to define trends. Nowadays, this Gaussian Channel is highly known as a method to support HOLD techniques in crypto. If the price is above the channel the trend is strong, if it comes back to the channel this can react as a resistance and indicate the beginning of a bear market (or Winter) if the price breaks below it. Eventhough the use of this channel focuses on h

The advantage of working with the Brian signal indicator is that the trader does not need to conduct technical analysis of the chart on his own. The tool generates ready-made signals in the form of directional arrows. This tool is an arrow (signal) one and works without redrawing.
Its signals are based on a robust algorithm. When used simultaneously on multiple timeframes, this indicator will truly "make the trend your friend". With it, you can follow trends on multiple timeframes in real time

重力拋物線系統 (Mostafa System)
輕鬆判別趨勢走向
提示完美進場點位
交易輔助清單
順勢交易系統
系統介紹:
重力拋物線系統,使用多項式非參數回歸方法計算拋物線重心及趨勢方向,而價格有非常高的機率會按照拋物線的趨勢方向前進,在依個上升趨勢拋物線中,綠線將會是我們第一個進場點,橘線會是第二個進場點,止損位置僅需要放置在橘線下方。此系統可大幅增加趨勢交易的勝率,交易者可清楚分辨當前交易方向,以及系統建議的進場位置。
影片教學:
UncleForex 外匯大叔 ( https://youtu.be/G4Xahx2Mivg )
今天大叔跟大家分享一套由歐洲的分析師,同時也是交易冠軍的 Mostafa Belkhayate 大師所創建的重力拋物線系統策略。
在交易的道路上我們時常聽到"順勢而為" ,按著趨勢方向去交易,然而大部分的交易者很難了解當下的盤面,到底是上升趨勢還是下降趨勢呢? 而重力拋物線系統,卻可以一眼輕鬆辨別趨勢?!
且還能找到最佳的進出場點位!趕緊觀看影片了解吧 ~

Diamonds Min5 - DM5-
DM5 is an indicator that suggests entering levels (sell or buy) ,it always follow the trends using parabolic sar , working on is so easy, you need just to attach it to the chart and all the magic will show , this indicator does not repeat itself or redraw signals .
After months of testing, it provides a very good result it works on all pairs with no excaption

Super Signals Channel Indicator
Its channel is a non-repaint indicator that reacts more with recent price movements. For this reason, the Super Signals Channel Indicator is a better match for short-term or day trading strategy. The Super Signals Channel only plots swing trading opportunities. So most of its trade signals appear during consolidation or sidelined periods of the market. Super Signals Channel Indicator for MT4 Explanation The green band below the price shows the dynamic support le

Qv² Stdev is indicator developed based on standard deviation of prices and trading volume.
Buy signals are indicated by arrows up.
Sell signals are indicated by arrows down.
An important detail is that the Qv² Volume has two bands, an upper and a lower, both of which serve as a target for take profit.
It is recommended to use it in H1
Can be used in all pairs (I use in Gold).
Good Business, in the trending market To find out some more about my work please click here

超級剝頭皮系統 (Super Golden System)
短線交易的系統
超快速進出場獲取利潤
系統自帶提示功能
自動分析出場位置
系統介紹:
由Jasonforex團隊編寫的價格判斷系統 , 分析當前週期趨勢方向,並結合Parabolic SAR 中短期指標技術,確認明確的反轉位置 , 及推薦出場位置 , 形成高勝率的短線交易模式 ,超級 剝頭皮系統在符合進場條件時,會在MT4上即時通知提示,提醒最佳的短線交易機會。
進出場設定位置:
買單(BUY)
TP(止盈價位): 箭頭或提示訊息出現,當前價位 + GoldenK-TP * 自定義倍數
SL(止損價位): 當前價位 - GoldenK-TP * 自定義倍數
賣單(SELL)
TP(止盈價位): 箭頭或提示訊息出現,當前價位 - GoldenK-TP * 自定義倍數
SL(止損價位): 當前價位 + GoldenK-TP * 自定義倍數
參數設定: 1. ShowArrows: 買單及賣單箭頭訊號提示
2. alertsOn: 所有通知訊息總開關(Message訊息/Soun
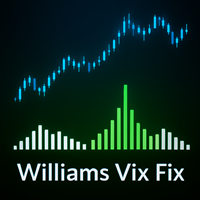
MT5 Version
Williams Vix Fix MT4 Need help trying to time the bottoms in the market? Williams Vix Fix MT4 is based on the volatility of the market and grants a huge support for finding out when a correction is comming to its end. TRY IT FOR FREE NOW! Williams Vix Fix MT4 derivates from Larry Williams's VixFix indicator addapted for fitting every asset class . VIX reprensents the fear and greed in the market based on its volatility. A high VIX value shows fear in the market, this is usually a

Trend Indicator, a revolutionary trend trading and filtering solution with all the important trend tool features built into one tool! The Step Success indicator is good for any trader, suitable for any trader for both forex and binary options. You do not need to set up anything, everything is perfected with time and experience, it works great during a flat and a trend.

Piccoline is a very interesting trend indicator. The Piccoline indicator helps to identify either a new or an existing trend. One of the advantages of the indicator is that it rebuilds rather quickly and reacts to various changes in the chart. Of course, it depends on the settings, namely, the specified CalcBars period. The larger it is, the smoother the trend line will be. The shorter the period, the more market noise will be taken into account when forming the indicator.
The indicator wa

WIth this indicator you can find Engulfing pattern that touch bollinger bands + optional moving average rule. For bearish engulf to form, second body (bearish) must be bigger than first (bullish) and one of them must be touching upper bollinger band with closed price. For bullish engulf to form, second body (bullish) must be bigger than first (bearish) and one of them must be touching lower bollinger band with closed price. You can also use moving average rule, so bearish engulf must be below MA

WIth this multi time frame and pair Scanner, you can find Engulfing pattern that touch bollinger bands + optional moving average rule. For bearish engulf to form, second body (bearish) must be bigger than first (bullish) and one of them must be touching upper bollinger band with closed price. For bullish engulf to form, second body (bullish) must be bigger than first (bearish) and one of them must be touching lower bollinger band with closed price. You can also use moving average rule, so bearis
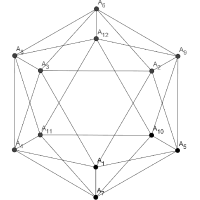
Extremums Max is an indicator of trend and trading signals, based on the principle of a combined analysis of calculated reference points within the channel as well as overbought and oversold levels.
The indicator forms arrows (by default, red and blue). The indicator is set in the usual way to any trading symbol with any time interval.
Indicator Benefits High accuracy; Work with any trade symbols; It works at any time intervals; Not redrawn. Input parameters Period - indicator period; Level
ABSOLUTELY DO NOT REPAINT, 100% GUARANTEED!!
With this indicator you will be able to identify the trend of the financial pairs in which it is loaded. By means of a graph of arrows that definitely do NOT repaint, this indicator shows you where the current trend is going.
It also has the plus that you can view the trend in the different time periods (as you can see in the screenshots) in a top bar where you can see the different time periods in green (bullish) or red (bearish) depending on the c

You can use the Viking Trend indicator as the main one to determine the trend. The indicator can work both for entry points and as a filter. This is a hybrid trend indicator, as it is based on the signals of elementary indicators and a special algorithm for analysis. The indicator reflects information in a visual form; it can be used both for pipsing on short periods and for long-term trading. The indicator does not redraw and does not lag. Take Profit is bigger than Stop Loss! Works on all curr
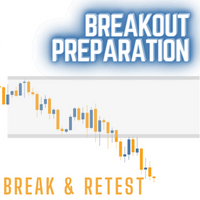
Breakout Preparation Choppy movement up and down on the opening range everyday. Trading breakouts on London session and New York session is recommended. Setting a bounce for a certain time zone and trade when the bounce reveals a break through. Input Parameter Indicator Name Days to Show Start Time to Analysis End Time to Analysis Bounce Show till Time Chart Setting Color Scheme Selection
Happy Trading and thanks for support.

The intelligent algorithm of the Calc Flagman indicator determines the trend well, filters out market noise and generates entry and exit levels. The indicator shows potential market reversal points. Works on all currency pairs and on all timeframes. Ready trading system. Uses only one parameter for settings. Simple, visual and effective trend detection. The indicator does not redraw and does not lag. You can set up message alerts as sound or email.
The principle of this indicator is very simple: detecting the trend with Moving Average, Predicting BUY and SELL signals with arrows, alerts and notifications. The parameters are fixed and automatically calculated on D1 timeframe. You can trade with small timeframe or using Dash DIY Ai Robot, Dash Smart Majors Strategy for autotrading on any timeframe and any currency pairs. You can download template and the presets file for autotrading with Dash Smart Majors Strategy . Example: If you install i
The principle of this indicator is very simple: detecting the trend with Moving Average, Predicting BUY and SELL signals with arrows, alerts and notifications. The parameters are fixed and automatically calculated on M30 timeframe. You can trade with small timeframe or using Dash DIY Ai Robot, Dash Smart M30 Strategy for autotrading on any timeframe and any currency pairs. You can download template and the presets file for autotrading with Dash Smart M30 Strategy . Example: If you install indica

Top Trader Indicator
This is an arrow reversal indicator. This is with deviations and arrows. Trade a blue arrow for buy and trade a red arrow for sell. Change the time period and the deviations of the bands. This is similar to others but these arrows don't repaint. Load in back tester and study which periods and deviations work the best. It works on all time frames. 15 min to 1 hr would give good results for take profits. Try according to your own risk management.

Result look on https://t.me/BonosuProBinary Pair : All Forex Pairs Time Frame : M1 Expaired : 1-2 Minutes Trade Time Once Time a Day Backtester, Alert Avaliable Average Signals Generate 5 - 20 Signals All Pair A Day Broker Time Zone GMT+3 Default Setting [Example Broker GMT+3 : Alpari, FBS, XM] Support Broker : Deriv, IQOption, Alpari, Binomo, Olymtrade, Qoutex, GCoption, etc Support Auto Trading : MT2 Trading, Binary Bot, Intrade Bot, Binomo Bot, Olymptrad Bot, MX2 trading, Price Pro, etc Ind
MetaTrader mağazası, alım-satım robotları ve teknik göstergeler satmak için en iyi yerdir.
MetaTrader platformu için ilgi çekici bir tasarıma ve iyi bir açıklamaya sahip bir uygulama geliştirmeniz yeterlidir. Milyonlarca MetaTrader kullanıcısına sunmak için size ürününüzü Mağazada nasıl yayınlayacağınızı açıklayacağız.
Alım-satım fırsatlarını kaçırıyorsunuz:
- Ücretsiz alım-satım uygulamaları
- İşlem kopyalama için 8.000'den fazla sinyal
- Finansal piyasaları keşfetmek için ekonomik haberler
Kayıt
Giriş yap
Gizlilik ve Veri Koruma Politikasını ve MQL5.com Kullanım Şartlarını kabul edersiniz
Hesabınız yoksa, lütfen kaydolun
MQL5.com web sitesine giriş yapmak için çerezlerin kullanımına izin vermelisiniz.
Lütfen tarayıcınızda gerekli ayarı etkinleştirin, aksi takdirde giriş yapamazsınız.