 MetaTrader 5
 Uzmanlar
 Göstergeler
 Kütüphaneler
 Yardımcı programlar
 Widget'lar
 Kurallar
YouTube'dan Mağaza ile ilgili öğretici videoları izleyin
Bir alım-satım robotu veya gösterge nasıl satın alınır?
Uzman Danışmanınızı
sanal sunucuda çalıştırın
sanal sunucuda çalıştırın
Satın almadan önce göstergeyi/alım-satım robotunu test edin
Mağazada kazanç sağlamak ister misiniz?
Satış için bir ürün nasıl sunulur?
MetaTrader 4 için yeni Teknik Göstergeler - 99
 Aşağıda listelenen teknik göstergelerden gelen sinyaller, MetaTrader 4 platformunda işlemler açılması ve kapatılmasında çok önemli bir rol oynar.
Göstergeler, fiyat değişikliklerini tahmin etmeyi amaçlayan, finansal sembol fiyatının matematiksel dönüşümüdür.

Hareketli Ortalama (MA) göstergesinin çok para birimi ve çok zaman çerçeveli modifikasyonu. Kontrol panelinde göstergenin mevcut durumunu görebilirsiniz - Hızlı MA ve Yavaş MA'nın kırılmaları ve dokunuşları (fiyata göre) ve ayrıca MA çizgilerinin birbirleri arasındaki kesişimi (hareketli ortalama geçiş). Parametrelerde istediğiniz para birimini ve zaman dilimlerini belirleyebilirsiniz. Ayrıca gösterge, fiyatın çizgilere temas etmesi ve geçişleri hakkında bildirimler gönderebilir. Noktalı bir hü
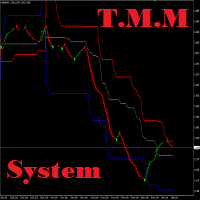
T.M.M Channel System , özel trend filtresi fiyat kanal göstergesini kullanarak Trend ile ALIŞ ve SATIŞ sinyallerini sağlayan bir forex ticaret sistemidir. Bu göstergenin yalnızca iki parametre kullanılarak herhangi bir pazara uyarlanması kolaydır. Bu kanal göstergesi yeniden boyanmaz! Kanal göstergesi H4 grafiklerinde işlem yapmak için önerilir ancak herhangi bir zaman diliminde de kullanılabilir. Satın aldıktan sonra kanal göstergesini indireceksiniz. Satın alma sonrasında ok göstergesi tarafın

Forex göstergesi, tüccara fiyat hareketinin yönünü grafik üzerinde bir çizgi şeklinde gösteren bir ticaret sistemidir. Kırmızı çizgi aşağı trend hareketini, mavi çizgi ise yükseliş trendini gösterir. Bu gösterge, bir scalping sistemi ile ticaret yapmak için uygundur. Çizgi mavi olduğunda ve fiyat çizginin altında olduğunda satın alırız. Fiyat çizginin üzerine çıktığında emri kapatın. Hat kırmızı olduğunda ve fiyat çizginin üzerinde olduğunda satıyoruz. Fiyat çizginin altına düştüğünde anlaşmayı

NOT: Bu ikili opsiyon göstergesinin ex4 kopyasını 2022'de bir arkadaşıma satarak bir hata yaptım. Daha sonra onu decompile edip farklı isimler altında telegram ve diğer ticaret platformlarında satmaya başladı. Ürünümün açıklamasını değiştirme zahmetine bile girmedi; sadece kopyalayıp yapıştırdı. Karşılığında size bu göstergeyi bedava veriyorum ki bana ait olanı başka kimse size satmasın. Tek yapmanız gereken bana 5 yıldızla geri ödeme yapmak.
Göstergeyi kullanarak ikili opsiyon ticareti yap

Investment Castle Trend Lines — Price Action, Drawn for You
Good trading starts with reading the trend — supply and demand, rising and falling channels, trend lines and engulfing candles. Investment Castle Trend Lines brings that price-action picture together on your chart automatically, so you can catch the trend with less guesswork and less stress.
What it does for you Automatic trend lines: the prevailing trend lines are drawn for you — no manual plotting. Price-action context: see structur
FREE
Üstün destek ve direnç - farklı göstergelerin en iyi kombinasyonu, piyasadaki en iyi ürünü yaratmamızı sağladı!
Ve işte Premium destek ve direnç!
Ticarette size yardımcı olacak kullanışlı ve esnek bir araç!
Fiyatın destek ve direnç seviyelerinden nereye gideceğini gösteriyor!
Mavi al Kırmızı sat okları bu konuda size yardımcı olacaktır!
Uyarı, size kolaylık sağlamak için göstergede zaten yerleşiktir!
"Kendi" sinyalini kaçırmamak için uyarı!
Zaten sizin için yapılandırılmış!
Tüm zaman di

Klaus is an arrow indicator for identifying potential entry points. I like it, first of all, because it has a simple mechanism of work, adaptation to all time periods and trading tactics. Suitable for trading on small timeframes because it ignores sudden price spikes or corrections in price movement by reducing market noise around the average price. Forex indicator Klaus is a real trading strategy with which you can achieve the desired results. As soon as the Klaus indicator is installed, the m

The Private indicator displays information in a visual form. You can trade in any currencies, because the strategy is universal and shows entry signals, relying on price patterns. It smooths out price fluctuations when generating a signal by averaging the data and the signal only at certain moments! In those moments when you need to make a decision to enter a position and give the trader a direction. The indicator can work both for entry points and as a filter. The indicator gives the trader th
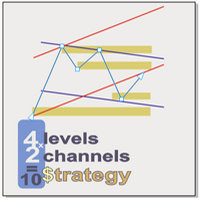
Supply and demand In all indicators that have the task of drawing support and resistance, the number of levels is so high that it causes a trader to make a mistake. We draw the last 4 important and valid levels for you using the Price Action method These surfaces are not easily broken and their breaking is done with long and powerful candlesticks Sometimes traders draw levels and wait for the price to reach those levels, but new levels may be created between the previous two levels in the f
The indicator shows De Mark patterns and gives trading signals in the form of arrows and alerts. Shows De Mark lines on the history of quotes. Has a multiframe., Can show DeMark patterns of higher timeframes on lower timeframes. Has a switchable function for displaying fractals. Trading signals are accompanied by sound alerts, as well as sending them to mail and mobile devices.

TrendControl is an arrow indicator of technical analysis for determining a trend, which can adjust to the price, is a graphical plot calculated using mathematical formulas, the initial data for which is a price chart. The indicator shows the direction of the trend, takes into account the minimum and maximum values of the extreme candles on the chart, then brings them to the average and compares them with the past data.
The principle of operation of the indicator is to automatically determine

VictoryTMA (Triangular Moving Average) is a channel indicator without redrawing, built on the basis of moving averages. The key difference of the VictoryTMA indicator from other channel indicators (for example, from the same Bollinger) is that VictoryTMA does not take into account simple moving averages, but twice smoothed, which, on the one hand, allows you to more clearly determine the market movement, but the other hand, makes the indicator less sensitive.

Investment Castle Engulfing — Never Miss an Engulfing Candle
Whether you scalp or trade the daily, bullish and bearish engulfing candles are some of the most reliable signals — but spotting them across timeframes is tedious and easy to miss. This indicator finds them for you, including an engulfing candle forming on a higher timeframe while you trade a lower one.
What it does for you Automatic engulfing detection: bullish and bearish engulfing candles are flagged for you. Multi-timeframe aware
FREE
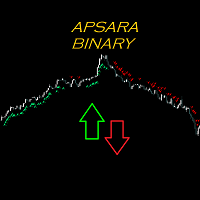
This indicator allows you to trade binary options and specially programmed to get the momentum to follow the trend that is happening in the live market. This indicator is based on trend strength, price correction and advanced technical analysis,this is 100% NO REPAINT. This indicators specifically for manual trading, I suggest using a platform that uses an expiration time Timeframe : M1 or M5 Expired Time : 1 Candle Pair : Any ( even better in the CAD market ) Time Session : Europe and NewY
The indicator shows entry points taking into account the trend, has flexible settings for filtering and aggressiveness of signals. The trend is set using four configurable movings with a rising period. Signals are filtered at the best price to enter. There are switches for this. The indicator does not redraw signals on history, gives sound signals and supports sending messages to mail and Push messages to mobile devices.
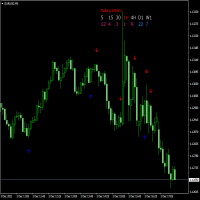
The RAILS indicator is the identification of the candlestick analysis pattern - Price Action. It signals an imminent price reversal or pullback. The main feature is the identification of candle combinations. In this case, the indicator is looking for two adjacent candles that are directed in different directions. In the upper part there is an information panel where information about different timeframes and identified "Rails" paptterns. There is also information - how many bars to that the pat
The indicator may be of interest to traders who use Fibonacci and Gann levels in their trading. The construction of levels is set by the range of the previous day. It is possible to set colors and styles of all lines in the indicator. It is possible to switch the view mode using buttons on the chart. The indicator practically does not load the terminal as it is recalculated either on a new bar or when switching buttons.
The indicator calculates the probability of a price reversal for a given size of price movement based on historical data. Made in a multicurrency version. When the price reversal probability specified in the properties is reached, the indicator emits a sound signal. It can display a table of the probability of reversals for several specified price movements for all instruments. Has the function of recording statistics of historical data in a CSV file, for viewing in Excel.

MYEWO göstergesi, grafiğinizdeki kısa vade yönünü bulmanıza yardımcı olan bir araçtır. Varsayılan giriş değerleri bu göstergedeki sık kullanılan değerlerdir. Kendi değerlerinizi kendi trend algılamaya ve çiftlerinize göre bulabilir ve kullanabilirsiniz.
Tavsiyem, ana grafikteki uzun vadeye olan trendini (200 ve daha yüksek uygun olabilir) anlamak için hareketli bir ortalama kullanmaktır. M5 grafikleri, kullanacağınız scalping tarzı ticaret işlemlerini basitleştirecektir. Genellikle MYEWO gösterg
Nobilis AI. Интеллектуальная торговая система.
это готовая торговая система для работы на любом инструменте и любом таймфрейме.
Полностью готова для ручной торговли и использовании в роботах Канал не перерисовывается Сигналы не перерисовываются Интеллектуальный расчет сигналов под каждый инструмент и таймфрейм Рассчитывает и показывает торговые позиции Подбирает наилучшие торговые параметры 10000 активаций
Удобно работать на всех таймфреймах от M1 до W1.
Протестировано на металлах, валютных
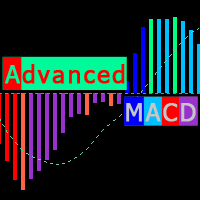
Modified MACD, for technical analysis of charts, with color backlight of histogram signals. The indicator highlights, the direction of the histogram movement, the change in the direction of the histogram movement, the histogram peaks, the interaction of the histogram and the signal curve. Also, the indicator makes it easier to find convergences / divergences between bars and the histogram (which serve as a powerful signal in some trading systems using the MACD indicator). Color designation of Ad

Hi, You can find the perfect buy sell signal with this indicator including trend line. This indicator providing signal based on some calculation of multiple moving averages. it gives arrow for buy and sell signal with color change in trend line. all the colors can be customize. For exit point you can use RSI indicator(14) along with this. I am attaching image for for your reference. Best Pair for this indicator :- EURUSD , USDCHF. Basic details of entry and exit :- Buy Entry :- Enter in the mark
Gamma Signal - индикатор предназначенный для поиска локальных экстремумов, определения текущей тенденции. В расчетах индикатора используется авторская методика. С помощью индикатора можно определять места возможного разворота цены желательно в направлении тенденции, но также с достаточной точностью и против нее. Также с помощью индикатора можно определять текущую тенденцию. Индикатор подходит для любых валютных пар, но для адекватного отображения показания необходимо, чтобы было достаточно ист
ContiStat restricted - Free DEMO version of the ContiStat indicator
Free version of the indicator is ment as DEMO of full paid version. Full functionality is available, however The indicator work only on M30 chart period . Find the ContiStat indicator for full functionality
Brief description The ContiStat indicator calculate statistic frequency of green (up) and red (down) movement in the chart and determine movement dynamics (silver curve). There are two key parameters to understand the ContiS
FREE
Big Trend Signal indicator is designed for trend and signal trading. This indicator generates trend signals. It uses many algorithms and indicators to generate this signal. It tries to generate a signal from the points with the highest trend potential. This indicator is a complete trading product. This indicator does not need any additional indicators. You can only trade with this indicator. The generated signals are displayed on the graphical screen. Thanks to the alert features you can ge
Safe Signal Arrows indicator is designed for trend and signal trading. This indicator generates trend signals. It uses many algorithms and indicators to generate this signal. It tries to generate a signal from the points with the highest trend potential. This indicator is a complete trading product. This indicator does not need any additional indicators. You can only trade with this indicator. The generated signals are displayed on the graphical screen. Thanks to the alert features you can

Perfect Trade System indicator is designed for trend and signal trading. This indicator generates trend signals. It uses many algorithms and indicators to generate this signal. It tries to generate a signal from the points with the highest trend potential. This indicator is a complete trading product. This indicator does not need any additional indicators. You can only trade with this indicator. The generated signals are displayed on the graphical screen. Thanks to the alert features you ca
Real Signal System indicator is designed for trend and signal trading. This indicator generates trend signals. It uses many algorithms and indicators to generate this signal. It tries to generate a signal from the points with the highest trend potential. This indicator is a complete trading product. This indicator does not need any additional indicators. You can only trade with this indicator. The generated signals are displayed on the graphical screen. Thanks to the alert features you can
This Pro Trade Signal Arrow indicator is designed for trend and signal trading. This indicator generates trend signals. It uses many algorithms and indicators to generate this signal. It tries to generate a signal from the points with the highest trend potential. This indicator is a complete trading product. This indicator does not need any additional indicators. You can only trade with this indicator. The generated signals are displayed on the graphical screen. Thanks to the alert features y

Perfect Real Trade System indicator is designed for trend and signal trading. This indicator generates trend signals. It uses many algorithms and indicators to generate this signal. It tries to generate a signal from the points with the highest trend potential. This indicator is a complete trading product. This indicator does not need any additional indicators. You can only trade with this indicator. The generated signals are displayed on the graphical screen. Thanks to the alert features y

Pro Trend Tracking indicator is designed for trend and signal trading. This indicator generates trend signals. It uses many algorithms and indicators to generate this signal. It tries to generate a signal from the points with the highest trend potential. This indicator is a complete trading product. This indicator does not need any additional indicators. You can only trade with this indicator. The generated signals are displayed on the graphical screen. Thanks to the alert features you can
Advanced Entry Signal Arrows indicator is designed for trend and signal trading. This indicator generates trend signals. It uses many algorithms and indicators to generate this signal. It tries to generate a signal from the points with the highest trend potential. This indicator is a complete trading product. This indicator does not need any additional indicators. You can only trade with this indicator. The generated signals are displayed on the graphical screen. Thanks to the alert feature

Gvs Undefeated Trend indicator is designed for trend and signal trading. This indicator generates trend signals. It uses many algorithms and indicators to generate this signal. It tries to generate a signal from the points with the highest trend potential. This indicator is a complete trading product. This indicator does not need any additional indicators. You can only trade with this indicator. The generated signals are displayed on the graphical screen. Thanks to the alert features you ca
Super Strong Trade Signals indicator is designed for trend and signal trading. This indicator generates trend signals. It uses many algorithms and indicators to generate this signal. It tries to generate a signal from the points with the highest trend potential. This indicator is a complete trading product. This indicator does not need any additional indicators. You can only trade with this indicator. The generated signals are displayed on the graphical screen. Thanks to the alert features

Super Cross Trend Tracking indicator is designed for trend and signal trading. This indicator generates trend signals. It uses many algorithms and indicators to generate this signal. It tries to generate a signal from the points with the highest trend potential. This indicator is a complete trading product. This indicator does not need any additional indicators. You can only trade with this indicator. The generated signals are displayed on the graphical screen. Thanks to the alert features

Strong Runner Trade System indicator is designed for trend and signal trading. This indicator generates trend signals. It uses many algorithms and indicators to generate this signal. It tries to generate a signal from the points with the highest trend potential. This indicator is a complete trading product. This indicator does not need any additional indicators. You can only trade with this indicator. The generated signals are displayed on the graphical screen. Thanks to the alert features
Brief description The ContiStat indicator calculate statistic frequency of green (up) and red (down) movement in the chart and determine movement dynamics (silver curve). There are two key parameters to understand the ContiStat principle: Block height and Block count . The ContiStat engine convert instrument price chart move to Blocks of constant height (price) regardles of how much time it take. Example 1: Block height is set to 50. DE30 index price make move from 15230 to 15443 in an hour. 4 g
Pro Trend Signal System indicator is designed for trend and signal trading. This indicator generates trend signals. It uses many algorithms and indicators to generate this signal. It tries to generate a signal from the points with the highest trend potential. This indicator is a complete trading product. This indicator does not need any additional indicators. You can only trade with this indicator. The generated signals are displayed on the graphical screen. Thanks to the alert features you

This indicator Super Neuro Trend indicator.Indicator displays trend movement. Indicator helps to buy and sell. Features FiltPer- displays indicator period. deviation - displaus indicator deviation. Trend - displaus indicator trend.( true,false) Rectangle - displaus indicator rectangle. (true,false)
How to understand the status: If the trend color is green, trend is up. I f the trend color is red, trend is down. I f the trend waiting,trend waiting.
///////////////////////////////////////////
SF TREND SIGNAL - уникальный индикатор использующий несколько входных данных для определения тенденции, и сигнала для входа в сделку, в ее направлении. Подходит для любой валютной пары, любого таймфрейма, и не меняет свои показания. Индикатор очень прост в настройке, что является хорошим преимуществом для исследований.
Параметры индикатора Основные настройки ( Main Settings ): SlowPeriod - период для расчета тенденции. FastPeriod - период для расчета сигнала. SlowSmooth - сглаживание значени

The indicator determines the trend and its direction. At the same time, it shows
the oversold and overbought zones. Thus, it determines the most profitable
places to open a position. The indicator can be used as a filter and complement
to any strategy. It can also be used as an independent tool.
Advantages
The indicator does not redraw the values. Works on all available tools. Works on all periods. It has a minimum of settings. The ability to use it as a primary and auxiliary indicator.
P

Alan Hull's moving average, more sensitive to the current price activity than the normal MA. Reacts to the trend changes faster, displays the price movement more clearly. My HMA indicator is the developed state of the standard HMA indicator. The indicator is Non Repaint Version. The indicator shown in a separate window is worth the value of -1 to 1. Default entries will give better results in the M15 chart for the parities. With different entry values, you can also get better results in differen
This indicator Mega Super Neuro Trend indicator.Indicator displays trend movement. Indicator helps to buy and sell.Trend1= line1 > < line1,trend2=line1 > < line2,trend3 = line1,line2 > < line3. Features Trend - displaus indicator trend.( true,false)
How to understand the status: If the trend color is green, trend is up. I f the trend color is red, trend is down.
///////////////////////////////////////////////////////////////////////////////////////////////////////////////////////////////////
53% OFF until December 31 (Normal price $125)! Don't miss the opportunity to have this invaluable tool! This is a totally automated multi timeframe support and resistance levels finder on every MT4 chart. No manual work! Just drop this indicator on a chart and you will have the S/R levels always up to date. It is very convenient and helps the trader to anticipate possible stalls and reversions in price movements. The levels are displayed as lines and each timeframe has a different color.
The
Alpha Signal - индикатор предназначенный для поиска локальных экстремумов, определения текущей тенденции. В расчетах индикатора используется авторская методика. С помощью индикатора можно определять места возможного разворота цены желательно в направлении тенденции, но также с достаточной точностью и против нее. Также с помощью индикатора можно определять текущую тенденцию. Индикатор подходит для любых валютных пар, но для адекватного отображения показания необходимо, чтобы было достаточно ист
Beta Signal - индикатор предназначенный для поиска локальных экстремумов, определения текущей тенденции. В расчетах индикатора используется авторская методика. С помощью индикатора можно определять места возможного разворота цены желательно в направлении тенденции, но также с достаточной точностью и против нее. Также с помощью индикатора можно определять текущую тенденцию. Индикатор подходит для любых валютных пар, но для адекватного отображения показания необходимо, чтобы было достаточно исто
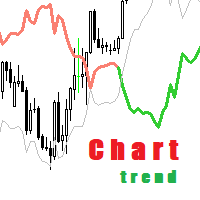
Определения текущей тенденции одна из самых важных задач трейдера не зависимо от стиля торговли. Индикатор Chart Trend поможет с достаточно высокой вероятностью это сделать. Chart Trend - индикатор распознавания тенденции, использующий авторский алгоритм расчета. Индикатор подходит для любой валютной пары, любого таймфрейма, и не меняет свои показания.
Параметры индикатора Основные настройки ( Main Settings ): HistoryBars - количество баров для отображения. CalcMode - выбор метода ра

Определения текущей тенденции одна из самых важных задач трейдера не зависимо от стиля торговли. Индикатор Good Ribbon поможет с достаточно высокой вероятностью это сделать.
Good Ribbon - авторский индикатор основан на усреднении ценовых значений по уникальной методике. Индикатор подходит для любой валютной пары, любого таймфрейма, и не меняет свои показания.
Параметры индикатора Основные настройки ( Main Settings ): HistoryBars - количество баров для отображения. IndicatorID - иденти

Pro Price Trading indicator is designed for trend and signal trading. This indicator generates trend signals. It uses many algorithms and indicators to generate this signal. It tries to generate a signal from the points with the highest trend potential. This indicator is a complete trading product. This indicator does not need any additional indicators. You can only trade with this indicator. The generated signals are displayed on the graphical screen. Thanks to the alert features you can g
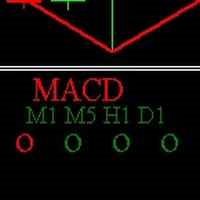
This indicator shows in a subwindow the trend in M1, M5, H1, D1 timeframes based on MA, MACD, Stochastic This way you could see in once in different timeframes what happening. This is my first free indicator. Please follow I will put here some more. Thank you for you attention. . . . . .
lfknglkslksnlgslgnsflgjrpoesv ,msv lkrjpfjésmdg sd.npo4wsmdglknsp4jwpkeégmfs.lkmp Thank you
FREE
MT4 için Para Birimi Gücü Göstergesi , yeni başlayan veya uzman tüccarlar için yenilikçi bir çözümdür! Fiyat hareketi ile birleştirdiği ve 8 ana para biriminin olağan 28 kombinasyonu dışında herhangi bir sembol/çift üzerine uygulanabildiği için para birimi gücü kavramını tamamen yeni bir seviyeye taşıyor. Bu, tüm para birimleri, majör, minör ve egzotikler, emtialar ve kriptolar (endeksler değil) dahil olmak üzere herhangi bir çiftin gücünü veya zayıflığını takas edebileceğiniz anlamına gelir. H
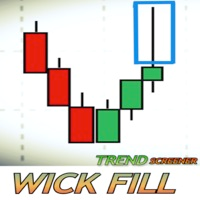
Ticarette fitil nedir? Bu Screener nasıl çalışır? Bir mum çubuğundaki fitil, fiyattaki bir reddi yansıtır. Bu Screener, doldurulma potansiyeli yüksek olan fitilleri belirlemeye çalışıyor. Bu Screener, trend piyasasında meydana gelen fitillere odaklanmıştır.
Screener, canlı olarak işlem gören potansiyel fitillerin genel bir görünümünü sunan bir gösterge tablosu görüntüler. Zaman dilimine göre düzenlenen TÜM çiftleri / enstrümanları gösterir. Satın alma fırsatları "UP-W.'' olarak adlandırılır. G
Çoklu zaman dilimi desteği, özelleştirilebilir görsel sinyaller ve yapılandırılabilir uyarı sistemi ile Money Flow Index (MFI) göstergesi.
Freelance programlama hizmetleri, güncellemeler ve diğer TrueTL ürünleri MQL5 profilinde mevcuttur.
Geri bildirim ve değerlendirmeleriniz çok değerlidir!
MFI Nedir? Money Flow Index (MFI), belirli bir dönem boyunca bir menkul kıymete giren ve çıkan para akışının gücünü ölçen, hacimle ağırlıklandırılmış bir momentum osilatörüdür. RSI'ya benzer şekilde çalış
FREE

This indicator is based on Bulls and Bears oscillators, both exposed on Dr. Alexander Elder's book: "Come into my trading room". "Elder Ray" was made with the purpose of identify bulls and bears pressure in the markets. The indicator is basically the union of this two mentioned oscillators but on an efficient way to facilite getting price patterns, divergences, etc. Default parameter is EMA 13.
FREE

Trade Invest Pro - Kripto para dünyasında patron!
Bu gösterge kripto para ticareti için idealdir!
Trade Invest Pro üzerinde çalışmak yarım yılımızı aldı!
Ama boşuna değil! Şimdi sadece destek yakınında doğru sinyaller - direnç seviyeleri!
İkili opsiyonlar için m5 m15 zaman dilimlerinde kendini iyi gösterdi!
İsteğe bağlı olarak, m30 ve daha fazlası için forex için yapılandırılabilir!
Haberlere iyi tepki veriyor!
boyamaz! ve programdan kaybolmaz!
Kırmızı ok göründüğü anda, düşüş için bir

The Control indicator is used in the Forex markets. One of the main definitions for monitoring the currency market is a trend that is why the Control indicator was created in order to display the trend in a visual form. You should use the indicator as an additional one, that is, you need to use this indicator, for example, for the perfect display of price movements!
Control is a trend indicator, a technical analysis tool that helps to determine the exact direction of the trend: either the upwa

The Avengers trend indicator is used to determine the strength and direction of a trend and to find price reversal points. The indicator is used in the forex markets. Created to visualize the trend. One of the main definitions for monitoring the currency market is trend. Flexible settings of the Avengers trend indicator allow you to receive more accurate signals for opening positions.
The trend can be ascending (bullish trend) and decreasing (bearish trend). In most cases, the trend grows for

Looking for a quality pivot point indicator? So Prosecution is what you need! To identify pivot points, the Prosecution indicator analyzes many conditions, as the aggregate analysis provides a more accurate picture of the market situation.
What are pivot points? Pivot point analysis is often used in conjunction with the calculation of support and resistance levels, as is the case with trend line analysis. When analyzing pivot points, the first support and resistance levels are calculated using
Magic Levels for MT4 by Jeanne Soft The Magic Levels indicator was created to solve three important tasks of successful trading: 1) construction of the nearest support and resistance levels for the selected timeframe, 2) timely identification of situations when the instrument is overbought or oversold, 3) indication of the probable trend reversal points. The indicator allows you to significantly save time analyzing the current situation on the selected instrument and contributes to making the ri
The SmartZigZag indicator is a generated system for successful trading, consisting of two indicators - a modified ZigZag and a trend indicator. The system automatically determines the expected reversal levels of the chart price, and also, using the Alert function, gives signals about a favorable situation for buying or selling. Has simple and straightforward settings. It can work in all foreign exchange and non-foreign exchange markets. Any timeframe.
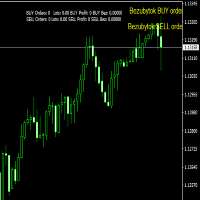
The Breakeven indicator is based on determining the breakeven levels of orders for a given instrument.
The indicator draws the breakeven level of BUY orders, the breakeven level of SELL orders.
If the number of lots between BUY orders and SELL orders between each other, the indicator draws the ALL breakeven level.
Drawing of levels is disabled in the indicator menu.

VWAP Bands gives you the regular Volume-Weighted Average Price and also the deviation bands.
Use this indicator to see the possible amount of market movement, find support and resistance lines, find good spots for entry and exit, and the most important feature is to find possible pivot points.
This indicator has been mathematically improved by Rira team. The calculation begins at the start of each trading day
Price reach indicator. It also serves as the perfect term for supports and resistance. I use it in two experts. The basic tool for professional trading. The indicator analyzes the last 500 bar and uses this to determine the levels ( but it doesn't predict the future ) . Personally, I use it on TF H1. It is very simple. Four lines on chart and that's all. Only two input parameters. Thousands of indicators. Why this? Is good ? No! Is very good. Please test the indicator prior to purchasing.
The indicator highlights the value in "over Sold" and "over Bought" zones. in addition, arrow indicates the return of the value from the extreme zone. Indicator can be easily customized by the user including change of colors, with, levels and arrows. Combination with other market signals and analysis is necessary and provides more stable results. Alert is also available for user.
FREE
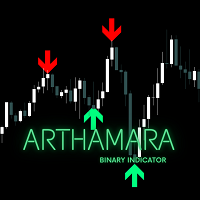
This indicator allows you to trade binary options . based on Bollinger bands and advanced technical analysis, this indicator is 100% NO REPAINT. This indicator is specifically for manual trading Timeframe : M5 / M15 or Higher Expired Time : 1 Candle Pair : Any Arrow Type : Current bar Alert : Current bar / Close Bar INDICATOR PARAMETER BBands Period ( Custom BBands Indicator) BBands Price BBands Deviation Signal Filter ( Level 1 - 3 ) you can use Supply n demand zone , SnR indicator , Auto
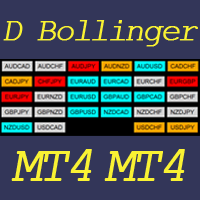
This indicator helps to visualize the Bollinger Band status of 28 pairs. With the feature of color panel, alert, and notification features, user can catch the potential Bollinger Bounce opportunities from 28 main pairs on one Dashboard quickly. Dashboard Bollinger Band is an intuitive and handy graphic tool to help you to monitor all 28 pairs and provide trading signals based on the Bollinger Bounce Rules (Overbought/Oversold and Bollinger Band Cross). COLOR LEGEND:
clrOrange: price is above the
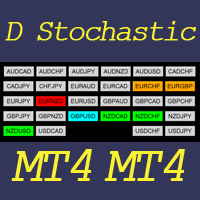
This indicator helps to visualize the Stochastic status of 28 pairs. With the feature of color panel, alert, and notification features, user can catch the potential buy and sell opportunities when the 28 main pairs cross the oversold/overbought area on one Dashboard quickly.
Dashboard Stochastic is an intuitive and handy graphic tool to help you to monitor all 28 pairs and provide trading signals based on the Stochastic Classic Rules (Overbought/Oversold and Stochastic Cross).
COLOR LEGEND: cl
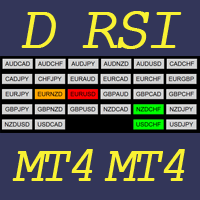
This indicator helps to visualize the RSI status of 28 pairs. With the feature of color panel, alert, and notification features, user can catch the potential buy and sell opportunities when the 28 main pairs cross the oversold/overbought area on one Dashboard quickly. Dashboard RSI is an intuitive and handy graphic tool to help you to monitor all 28 pairs and provide trading signals based on the RSI Rules (Overbought/Oversold and Stochastic Cross). COLOR LEGEND:
clrOrange: RSI signal is above th
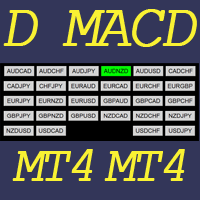
This indicator helps to visualize the MACD status of 28 pairs. With the feature of color panel, alert, and notification features, user can catch the potential buy and sell opportunities when the 28 main pairs’ fast EMA cross the slow EMA on one Dashboard quickly. Dashboard MACD is an intuitive and handy graphic tool to help you to monitor all 28 pairs and provide trading signals based on the MACD Rules (Fast EMA Cross Slow). COLOR LEGEND: clrRed: MACD fast EMA down cross MACD slow EAM and MACD f
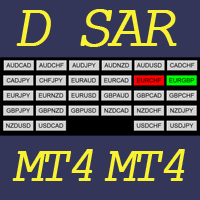
This indicator helps to visualize the SAR status of 28 pairs. With the feature of color panel, alert, and notification features, user can catch the potential buy and sell opportunities when the 28 main pairs’ SAR dots are switching between the above/below of candles on one Dashboard quickly. Dashboard SAR is an intuitive and handy graphic tool to help you to monitor all 28 pairs and provide trading signals based on the SAR Rules (SAR dots are switching between the above/below of candles). COLOR
MetaTrader Mağazasının neden alım-satım stratejileri ve teknik göstergeler satmak için en iyi platform olduğunu biliyor musunuz? Reklam veya yazılım korumasına gerek yok, ödeme sorunları yok. Her şey MetaTrader Mağazasında sağlanmaktadır.

Alım-satım fırsatlarını kaçırıyorsunuz:
- Ücretsiz alım-satım uygulamaları
- İşlem kopyalama için 8.000'den fazla sinyal
- Finansal piyasaları keşfetmek için ekonomik haberler
Kayıt
Giriş yap
Web sitesi politikasını ve kullanım şartlarını kabul edersiniz
Hesabınız yoksa, lütfen kaydolun