 Tüm siparişler
 Kurallar
Bir alım-satım robotunun nasıl sipariş edileceğini izleyin
Bir sipariş vermeden veya bir siparişe başvurmadan önce Kuralları okuyun
Bir MQL5/MQL4 Alım-Satım Robotu Nasıl Sipariş Edilir?
Bir robot sipariş etmek için örnek Gereklilikler Şartnamesine bakın
Kategorideki yeni siparişler:
30 - 35 USD
30+ USD
100+ USD
30 - 150 USD
İş tamamlandı
Tamamlanma süresi: 3 saat

Müşteri tarafından geri bildirim
Great dev, delivered fast + good communication
Geliştirici tarafından geri bildirim
Very nice working experience
Şartname
Link to External Description:
Here is the Pinescript code below:
Key Task is to convert from the standard RSI indicator:
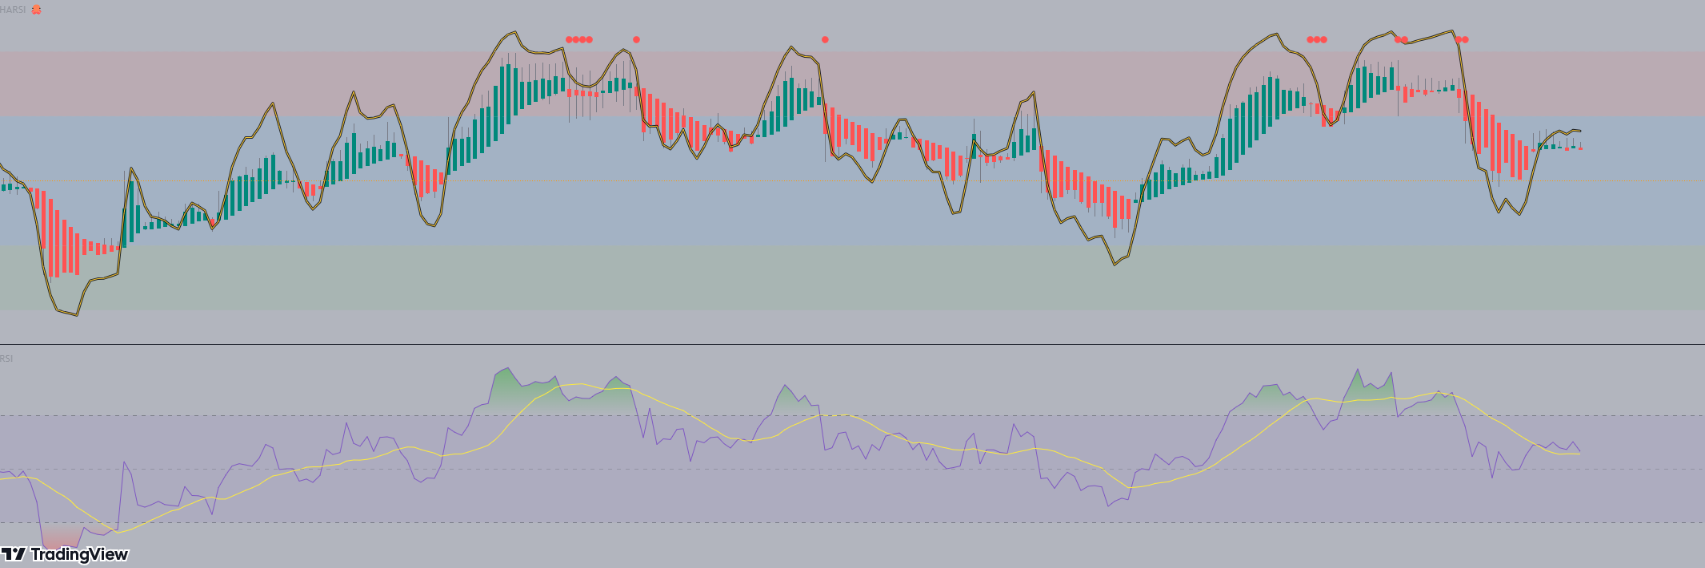
Steps:
1) Deliver in a quick timeframe - should be straight forward (within 24 - 48 hrs max)
2) May extend to add it in an EA (after the source code is shown). But for now it is just making the indicator the same as the Pinescript version
See the code below:
// This source code is free to use, copy, and alter in any way you choose.
// ...but credit is always nice :)

//@version=4
//@author=JayRogers

study( "HARSI", "HARSI 🐙", false, format.price, 2 )

////////////////////////////////////////////////////////////////////////////////
//                                                                            //
// ====== ABOUT THIS INDICATOR                                                //
//                                                                            //
//  - RSI based Heikin Ashi candle oscillator                                 //
//                                                                            //
// ====== ARTICLES and FURTHER READING                                        //
//                                                                            //
//  - https://www.investopedia.com/terms/h/heikinashi.asp                     //
//                                                                            //
//    "Heikin-Ashi is a candlestick pattern technique that aims to reduce     //
//    some of the market noise, creating a chart that highlights trend        //
//    direction better than typical candlestick charts"                       //
//                                                                            //
// ====== REASON FOR STUDY                                                    //
//                                                                            //
//  - Mostly experimental. I wanted to see if I could translate RSI into a    //
//    Heikin Ashi function and retain it's oscillating nature. That goal      //
//    was met more easily than I anticipated with quite delightful results.   //
//                                                                            //
// ====== DISCLAIMER                                                          //
//                                                                            //
//    Any trade decisions you make are entirely your own responsibility.      //
//    I've made an effort to squash all the bugs, but you never know!         //
//                                                                            //
////////////////////////////////////////////////////////////////////////////////

////////////////////////////////////////////////////////////////////////////////
//                                                                            //
//                           ====== TOOLTIPS ======                           //
//                                                                            //
////////////////////////////////////////////////////////////////////////////////

string TT_HARSI = "Period for the RSI calculations used to generate the"        +
                  "candles. This seperate from the RSI plot/histogram length."

string TT_PBIAS = "Smoothing feature for the OPEN of the HARSI candles."        +
                  "\n\nIncreases bias toward the prior open value which can"    +
                  " help provide better visualisation of trend strength."       +
                  "\n\n** By changing the Open values, High and Low can also"   +
                  " be distorted - however Close will remain unchanged."

string TT_SMRSI = "This option smoothes the RSI in a manner similar to HA"      +
                  " open, but uses the realtime rsi rather than the prior"      +
                  " close value."

string TT_STOCH = "Uses the RSI generated by the above settings, and as such"   +
                  " will be affected by the smoothing option."

string TT_STFIT = "Adjusts the vertical scaling of the stochastic, can help"    +
                  " to prevent distortion of other data in the channel."        +
                  "\n\nHas no impact cross conditions."

////////////////////////////////////////////////////////////////////////////////
//                                                                            //
//                            ====== INPUTS ======                            //
//                                                                            //
////////////////////////////////////////////////////////////////////////////////

// -- Candle config

string GROUP_CAND = "Config » HARSI Candles"
i_lenHARSI  = input( 14,            "Length",               input.integer,  group = GROUP_CAND,
                  minval = 1, tooltip = TT_HARSI )
i_smoothing = input( 6,             "Open Smoothing",       input.integer,  group = GROUP_CAND,
                  minval = 1, maxval = 100, tooltip = TT_PBIAS )
string INLINE_COL = "Colour Pallette"
i_colUp     = input( color.teal,    "Colour Pallette  ",    input.color,    group = GROUP_CAND, inline = INLINE_COL )
i_colDown   = input( color.red,     " ",                    input.color,    group = GROUP_CAND, inline = INLINE_COL )
i_colWick   = input( color.gray,    " ",                    input.color,    group = GROUP_CAND, inline = INLINE_COL )

// -- RSI plot config

string GROUP_PLOT = "Config » RSI Plot"
i_source    = input( ohlc4,         "Source",               input.source,   group = GROUP_PLOT )
i_lenRSI    = input( 7,             "Length",               input.integer,  group = GROUP_PLOT,
                  minval = 1 )
i_mode      = input( true,          "Smoothed Mode RSI?",   input.bool,     group = GROUP_PLOT,
                  tooltip = TT_SMRSI )
i_showPlot  = input( true,          "Show RSI Plot?",       input.bool,     group = GROUP_PLOT )
i_showHist  = input( true,          "Show RSI Histogram?",  input.bool,     group = GROUP_PLOT )

// -- Stochastic RSI plots config

string GROUP_STOCH = "Config » Stochastic RSI Plot"
string INLINE_STDS = "Stoch Draw States"
i_showStoch = input( false,         "Show Stochastic? ",    input.bool,     group = GROUP_STOCH, inline = INLINE_STDS,
                  tooltip = TT_STOCH )
i_ribbon    = input( true,          "Ribbon?",              input.bool,     group = GROUP_STOCH, inline = INLINE_STDS )
i_smoothK   = input( 3,             "Smoothing K",          input.integer,  group = GROUP_STOCH,
                  minval = 1 )
i_smoothD   = input( 3,             "Smoothing D",          input.integer,  group = GROUP_STOCH,
                  minval = 1 )
i_stochLen  = input( 14,            "Stochastic Length",    input.integer,  group = GROUP_STOCH,
                  minval = 1 )
i_stochFit  = input( 80,            "Stoch Scaling %",      input.integer,  group = GROUP_STOCH,
                  minval = 1, maxval = 100, tooltip = TT_STFIT )

// -- Channel OB/OS config

string GROUP_CHAN = "Config » OB/OS Boundaries"
i_upper     = input( 20,            "OB",                   input.integer,  group = GROUP_CHAN, inline = "OB",
                  minval = 1, maxval = 50 )
i_upperx    = input( 40,            "OB Extreme",           input.integer,  group = GROUP_CHAN, inline = "OB",
                  minval = 1, maxval = 50 )

i_lower     = input( -20,           "OS",                   input.integer,  group = GROUP_CHAN, inline = "OS",
                  minval = -50, maxval = -1 )
i_lowerx    = input( -40,           "OS Extreme",           input.integer,  group = GROUP_CHAN, inline = "OS",
                  minval = -50, maxval = -1 )

////////////////////////////////////////////////////////////////////////////////
//                                                                            //
//                          ====== FUNCTIONS ======                           //
//                                                                            //
////////////////////////////////////////////////////////////////////////////////

//  zero median rsi helper function, just subtracts 50.
f_zrsi( _source, _length ) => rsi( _source, _length ) - 50

//  zero median stoch helper function, subtracts 50 and includes % scaling
f_zstoch( _source, _length, _smooth, _scale ) =>
    float _zstoch   = stoch( _source, _source, _source, _length) - 50
    float _smoothed = sma( _zstoch, _smooth )
    float _scaled   = ( _smoothed / 100 ) * _scale

//  mode selectable rsi function for standard, or smoothed output
f_rsi( _source, _length, _mode ) =>

    //  get base rsi
    float _zrsi = f_zrsi( _source, _length )

    //  smoothing in a manner similar to HA open, but rather using the realtime
    //  rsi in place of the prior close value.
    var float _smoothed = na
    _smoothed := na( _smoothed[1] ) ? _zrsi : ( _smoothed[1] + _zrsi ) / 2

    //  return the requested mode
    _mode ? _smoothed : _zrsi

//  RSI Heikin-Ashi generation function
f_rsiHeikinAshi( _length ) =>

    //  get close rsi
    float _closeRSI = f_zrsi( close, _length )

    //  emulate "open" simply by taking the previous close rsi value
    float _openRSI  = nz( _closeRSI[1], _closeRSI )

    //  the high and low are tricky, because unlike "high" and "low" by
    //  themselves, the RSI results can overlap each other. So first we just go
    //  ahead and get the raw results for high and low, and then..
    float _highRSI_raw  = f_zrsi( high, _length )
    float _lowRSI_raw   = f_zrsi( low, _length )
    //  ..make sure we use the highest for high, and lowest for low
    float _highRSI  = max( _highRSI_raw, _lowRSI_raw )
    float _lowRSI   = min( _highRSI_raw, _lowRSI_raw )

    //  ha calculation for close
    float _close    = ( _openRSI + _highRSI + _lowRSI + _closeRSI ) / 4

    //  ha calculation for open, standard, and smoothed/lagged
    var float _open = na
    _open  := na( _open[ i_smoothing ] ) ? ( _openRSI + _closeRSI ) / 2 :
              ( ( _open[1] * i_smoothing ) + _close[1] ) / ( i_smoothing + 1 )

    //  ha high and low min-max selections
    float _high     = max( _highRSI, max( _open, _close ) )
    float _low      = min( _lowRSI,  min( _open, _close ) )

    //  return the OHLC values
    [ _open, _high, _low, _close ]

////////////////////////////////////////////////////////////////////////////////
//                                                                            //
//                   ====== SERIES, LINES and LABELS ======                   //
//                                                                            //
////////////////////////////////////////////////////////////////////////////////

//  standard, or ha smoothed rsi for the line plot and/or histogram
float RSI = f_rsi( i_source, i_lenRSI, i_mode )

//  stoch stuff
float StochK = f_zstoch( RSI, i_stochLen, i_smoothK, i_stochFit )
float StochD = sma( StochK, i_smoothD )

//  get OHLC values to use in the plotcandle()
[ O, H, L, C ] = f_rsiHeikinAshi( i_lenHARSI )

//  candle body colouring
color bodyColour    = C > O ? i_colUp : i_colDown
color wickColour    = i_colWick

//  shadow, invisible
color colShadow     = color.rgb( 0, 0, 0, 20 )
color colNone       = color.rgb( 0, 0, 0, 100 )

//  rsi color
color colRSI        = color.rgb( 250, 200, 50, 0 )

//  stoch ribbon fill
color colStochK     = color.new( #0094FF, 0 )
color colStochD     = color.new( #FF6A00, 0 )
color colStochFill  = StochK >= StochD ? color.new( colStochK, 50 ) : color.new( colStochD, 50 )

////////////////////////////////////////////////////////////////////////////////
//                                                                            //
//                     ====== DRAWING and PLOTTING ======                     //
//                                                                            //
////////////////////////////////////////////////////////////////////////////////

//  zero median RSI channel hlines
upperx  = hline( i_upperx,  "OB Extreme",   color.new( color.silver, 60 ) )
upper   = hline( i_upper,   "OB",           color.new( color.silver, 80 ) )
median  = hline( 0,         "Median",       color.orange, hline.style_dotted )
lower   = hline( i_lower,   "OS",           color.new( color.silver, 80 ) )
lowerx  = hline( i_lowerx,  "OS Extreme",   color.new( color.silver, 60 ) )

//  channel fill
fill( upper, upperx, color.new( color.red, 90 ),    title = "Background Fill OB" )
fill( upper, lower,  color.new( color.blue, 90 ),   title = "Background Channel" )
fill( lower, lowerx, color.new( color.green, 90 ),  title = "Background Fill OS" )


//  make our HA rsi candles
plotcandle( O, H, L, C, "HARSI", bodyColour, wickColour, bordercolor = bodyColour )

//  RSI overlay plot
plot( i_showPlot ? RSI : na,                    "RSI Shadow",       colShadow,  3 )
plot_rsi    = plot( i_showPlot ? RSI : na,      "RSI Overlay",      colRSI,     1 )

buy = C < O and O > 18 and RSI > i_upper and falling(RSI,1)
sell = C > O and O < -18 and RSI < i_lower and rising(RSI,1)

buy1 = C > O and C < -7 and rising(RSI,2)
sell2 = C < O and C > 7 and falling(RSI,2)


plotshape(sell, style=shape.circle, size=size.tiny, color=color.lime, location =location.bottom)
plotshape(buy, style=shape.circle, size=size.tiny, color=color.red, location =location.top)

plotshape(buy1, style=shape.circle, size=size.tiny, color=color.orange, location =location.bottom)
plotshape(sell2, style=shape.circle, size=size.tiny, color=color.orange, location =location.top)


alertcondition(sell, "Buy")
alertcondition(buy, "Sell")

alertcondition(buy1, "Close Short")
alertcondition(sell2, "Close Long")


// -- PEANUT
Yanıtlandı
1
Derecelendirme
Projeler
22
23%
Arabuluculuk
5
40%
/
60%
Süresi dolmuş
2
9%
Çalışıyor
2
Derecelendirme
Projeler
499
67%
Arabuluculuk
5
40%
/
0%
Süresi dolmuş
4
1%
Serbest
Yayınlandı: 8 kod
3
Derecelendirme
Projeler
603
34%
Arabuluculuk
65
22%
/
57%
Süresi dolmuş
147
24%
Çalışıyor
Yayınlandı: 1 makale, 22 kod
4
Derecelendirme
Projeler
239
77%
Arabuluculuk
0
Süresi dolmuş
0
Serbest
5
Derecelendirme
Projeler
178
39%
Arabuluculuk
4
25%
/
50%
Süresi dolmuş
14
8%
Serbest
6
Derecelendirme
Projeler
102
23%
Arabuluculuk
12
25%
/
17%
Süresi dolmuş
13
13%
Serbest
7
Derecelendirme
Projeler
945
47%
Arabuluculuk
309
58%
/
27%
Süresi dolmuş
125
13%
Serbest
Benzer siparişler
Maximas e Minimas + Super Trend
35+ USD
Indicador Maximas e Minimas + Super Trend O Indicador MAX/MIN é um indicador de análise técnica para o MetaTrader 5 , desenvolvido para ajudar você a identificar regiões importantes de preço e possíveis oportunidades de compra e venda. O que ele faz MAX/MIN: identifica máximas e mínimas relevantes do mercado e mostra os preços no gráfico. HH / HL / LH / LL: ajuda a visualizar a estrutura do mercado, mostrando quando
Hello Traders, Have a trading strategy or idea you want to automate? I specialize exclusively in MQL5 development, helping traders turn their concepts into professional trading solutions. Custom Expert Advisors — automate your strategy and reduce manual execution Custom Indicators — transform your market ideas into powerful trading tools Fix & Debug — identify errors and get your existing code working properly
I DO NOT need any programming or strategy development. I already have a working NinjaTrader 8 automated strategy based on a 3/5 EMA crossover. I need you to run my existing strategy through NinjaTrader Strategy Analyzer/Optimizer, test the existing adjustable parameters, and find robust settings with the best profit factor and lowest reasonable drawdown. I will provide the existing NinjaScript ZIP. I do not want the
I'm looking for an experienced developer to create an automated gold trading bot. The bot should be compatible with MetaTrader 4/5 and TradingView. Key Requirements: - Automated trading bot - Compatible with MetaTrader 4/5 and TradingView - Implement scalping and swing trading strategies Ideal Skills and Experience: - Proficiency in trading algorithms - Experience with gold trading - Familiarity with MetaTrader and
I need a robust optimization of my MT5 EA, mainly for XAUUSD (Gold). Please optimize the existing adjustable parameters such as entry/exit settings, SL/TP, trailing/break-even settings, and any other strategy parameters that are appropriate. I want the optimization focused on stable profitability, low/moderate drawdown, and robustness rather than simply the highest possible profit. Please use out-of-sample testing
NinjaTrader 8 / NinjaScript Phase 1 build: convert an existing Auction Market Theory (AMT) strategy into objective, alert-only decision-support logic. Not a bot, no auto-execution — trades stay manual. Covers NQ/MNQ, ES, CL, MGC using 30-min TPO/Volume Profile context with 5-min confirmation: one 5-min close outside VAH/VAL = acceptance, close back inside = rejection. Dashboard shows bias, auction state, location
Hello, I need a custom NON-REPAINT MT5 indicator that gives sell/buy arrow signals 1–2 candlesticks before a spike on Crash and boom indices respectively occurs. Requirements: Works perfectly on MT5 Shows arrows before the spike (1–2 candles earlier). Non-repaint – once the arrow appears, it must stay. Should be accurate, not quantity — only quality signals. Must work on both demo and live accounts. I want the
Trading view to thinkorswim
30+ USD
Hello, I saw an indicator on TradingView and would like to know if you will be able to convert it for use on Thinkorswim platform? Thanks. if anyone can help me with it kindly do well to bid it urgent thanks looking forward too see you
Simthandile sim new indicator
40 - 300 USD
calcVolume( void ) { //--- MqlRates rates[]; if ( CopyRates ( _Symbol , PERIOD_CURRENT , startTime, endTime, rates) > 0 ) { double rangeHigh = rates[ 0 ].high, rangeLow = rates[ 0 ].low; int count = MathAbs ( iBarShift ( _Symbol , PERIOD_CURRENT , startTime) - iBarShift ( _Symbol , PERIOD_CURRENT , endTime)) + 1 ; //---VERTICAL PRICE RANGE for ( int b = 0
Gold HFT Signal Pro
30+ USD
Create an MT5 Expert Advisor (EA) for trading Gold (XAUUSD). The EA should provide BUY and SELL signals based on trend direction, market momentum, and price action. It should automatically place trades only when the entry conditions are met. Risk management: Use a small adjustable lot size. Include Stop Loss (SL) and Take Profit (TP). Include a maximum daily loss limit. Include a maximum number of open trades. Do not
Proje bilgisi
Bütçe
30+ USD
Son teslim tarihi
to 1 gün