 全部订单
 规则
类别中的新订单:
500+ USD
250 - 500 USD
30+ USD
30 - 50 USD
工作已完成
执行时间3 小时

员工反馈
Very nice working experience
客户反馈
Great dev, delivered fast + good communication
指定
Link to External Description:
Here is the Pinescript code below:
Key Task is to convert from the standard RSI indicator:
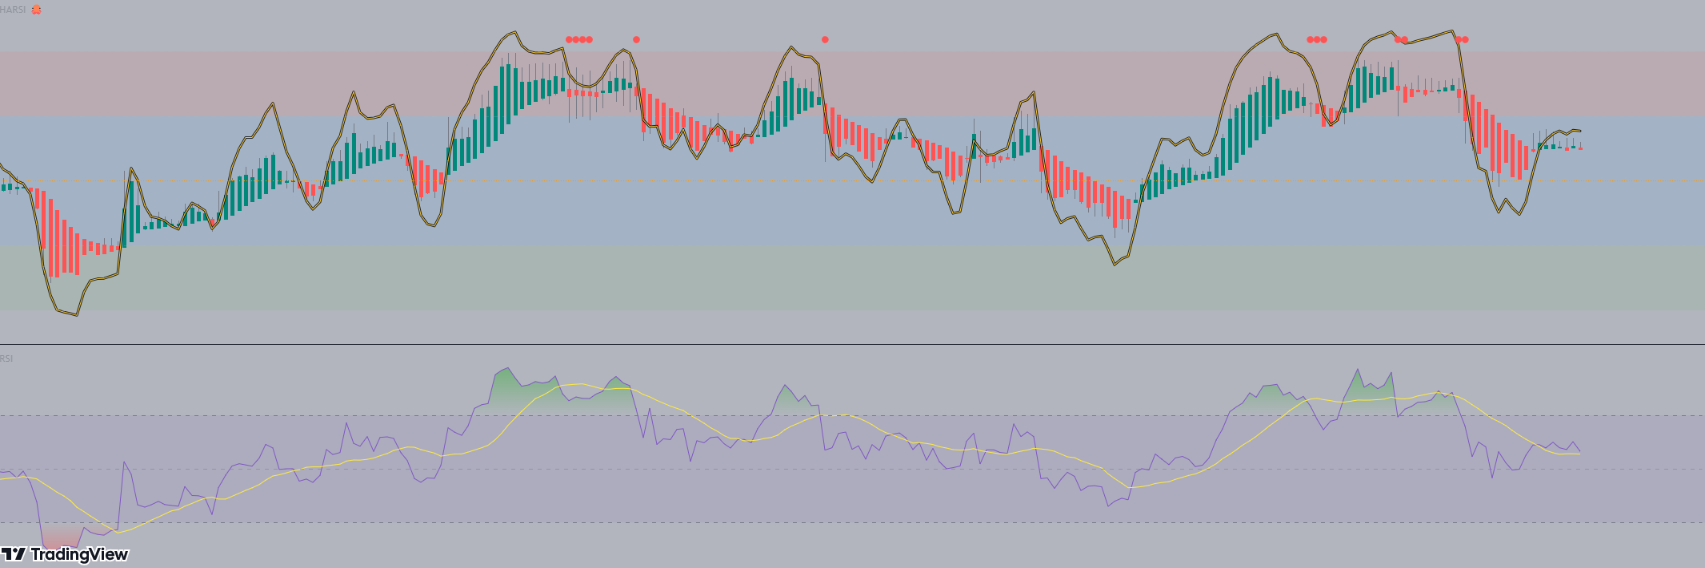
Steps:
1) Deliver in a quick timeframe - should be straight forward (within 24 - 48 hrs max)
2) May extend to add it in an EA (after the source code is shown). But for now it is just making the indicator the same as the Pinescript version
See the code below:
// This source code is free to use, copy, and alter in any way you choose.
// ...but credit is always nice :)

//@version=4
//@author=JayRogers

study( "HARSI", "HARSI 🐙", false, format.price, 2 )

////////////////////////////////////////////////////////////////////////////////
//                                                                            //
// ====== ABOUT THIS INDICATOR                                                //
//                                                                            //
//  - RSI based Heikin Ashi candle oscillator                                 //
//                                                                            //
// ====== ARTICLES and FURTHER READING                                        //
//                                                                            //
//  - https://www.investopedia.com/terms/h/heikinashi.asp                     //
//                                                                            //
//    "Heikin-Ashi is a candlestick pattern technique that aims to reduce     //
//    some of the market noise, creating a chart that highlights trend        //
//    direction better than typical candlestick charts"                       //
//                                                                            //
// ====== REASON FOR STUDY                                                    //
//                                                                            //
//  - Mostly experimental. I wanted to see if I could translate RSI into a    //
//    Heikin Ashi function and retain it's oscillating nature. That goal      //
//    was met more easily than I anticipated with quite delightful results.   //
//                                                                            //
// ====== DISCLAIMER                                                          //
//                                                                            //
//    Any trade decisions you make are entirely your own responsibility.      //
//    I've made an effort to squash all the bugs, but you never know!         //
//                                                                            //
////////////////////////////////////////////////////////////////////////////////

////////////////////////////////////////////////////////////////////////////////
//                                                                            //
//                           ====== TOOLTIPS ======                           //
//                                                                            //
////////////////////////////////////////////////////////////////////////////////

string TT_HARSI = "Period for the RSI calculations used to generate the"        +
                  "candles. This seperate from the RSI plot/histogram length."

string TT_PBIAS = "Smoothing feature for the OPEN of the HARSI candles."        +
                  "\n\nIncreases bias toward the prior open value which can"    +
                  " help provide better visualisation of trend strength."       +
                  "\n\n** By changing the Open values, High and Low can also"   +
                  " be distorted - however Close will remain unchanged."

string TT_SMRSI = "This option smoothes the RSI in a manner similar to HA"      +
                  " open, but uses the realtime rsi rather than the prior"      +
                  " close value."

string TT_STOCH = "Uses the RSI generated by the above settings, and as such"   +
                  " will be affected by the smoothing option."

string TT_STFIT = "Adjusts the vertical scaling of the stochastic, can help"    +
                  " to prevent distortion of other data in the channel."        +
                  "\n\nHas no impact cross conditions."

////////////////////////////////////////////////////////////////////////////////
//                                                                            //
//                            ====== INPUTS ======                            //
//                                                                            //
////////////////////////////////////////////////////////////////////////////////

// -- Candle config

string GROUP_CAND = "Config » HARSI Candles"
i_lenHARSI  = input( 14,            "Length",               input.integer,  group = GROUP_CAND,
                  minval = 1, tooltip = TT_HARSI )
i_smoothing = input( 6,             "Open Smoothing",       input.integer,  group = GROUP_CAND,
                  minval = 1, maxval = 100, tooltip = TT_PBIAS )
string INLINE_COL = "Colour Pallette"
i_colUp     = input( color.teal,    "Colour Pallette  ",    input.color,    group = GROUP_CAND, inline = INLINE_COL )
i_colDown   = input( color.red,     " ",                    input.color,    group = GROUP_CAND, inline = INLINE_COL )
i_colWick   = input( color.gray,    " ",                    input.color,    group = GROUP_CAND, inline = INLINE_COL )

// -- RSI plot config

string GROUP_PLOT = "Config » RSI Plot"
i_source    = input( ohlc4,         "Source",               input.source,   group = GROUP_PLOT )
i_lenRSI    = input( 7,             "Length",               input.integer,  group = GROUP_PLOT,
                  minval = 1 )
i_mode      = input( true,          "Smoothed Mode RSI?",   input.bool,     group = GROUP_PLOT,
                  tooltip = TT_SMRSI )
i_showPlot  = input( true,          "Show RSI Plot?",       input.bool,     group = GROUP_PLOT )
i_showHist  = input( true,          "Show RSI Histogram?",  input.bool,     group = GROUP_PLOT )

// -- Stochastic RSI plots config

string GROUP_STOCH = "Config » Stochastic RSI Plot"
string INLINE_STDS = "Stoch Draw States"
i_showStoch = input( false,         "Show Stochastic? ",    input.bool,     group = GROUP_STOCH, inline = INLINE_STDS,
                  tooltip = TT_STOCH )
i_ribbon    = input( true,          "Ribbon?",              input.bool,     group = GROUP_STOCH, inline = INLINE_STDS )
i_smoothK   = input( 3,             "Smoothing K",          input.integer,  group = GROUP_STOCH,
                  minval = 1 )
i_smoothD   = input( 3,             "Smoothing D",          input.integer,  group = GROUP_STOCH,
                  minval = 1 )
i_stochLen  = input( 14,            "Stochastic Length",    input.integer,  group = GROUP_STOCH,
                  minval = 1 )
i_stochFit  = input( 80,            "Stoch Scaling %",      input.integer,  group = GROUP_STOCH,
                  minval = 1, maxval = 100, tooltip = TT_STFIT )

// -- Channel OB/OS config

string GROUP_CHAN = "Config » OB/OS Boundaries"
i_upper     = input( 20,            "OB",                   input.integer,  group = GROUP_CHAN, inline = "OB",
                  minval = 1, maxval = 50 )
i_upperx    = input( 40,            "OB Extreme",           input.integer,  group = GROUP_CHAN, inline = "OB",
                  minval = 1, maxval = 50 )

i_lower     = input( -20,           "OS",                   input.integer,  group = GROUP_CHAN, inline = "OS",
                  minval = -50, maxval = -1 )
i_lowerx    = input( -40,           "OS Extreme",           input.integer,  group = GROUP_CHAN, inline = "OS",
                  minval = -50, maxval = -1 )

////////////////////////////////////////////////////////////////////////////////
//                                                                            //
//                          ====== FUNCTIONS ======                           //
//                                                                            //
////////////////////////////////////////////////////////////////////////////////

//  zero median rsi helper function, just subtracts 50.
f_zrsi( _source, _length ) => rsi( _source, _length ) - 50

//  zero median stoch helper function, subtracts 50 and includes % scaling
f_zstoch( _source, _length, _smooth, _scale ) =>
    float _zstoch   = stoch( _source, _source, _source, _length) - 50
    float _smoothed = sma( _zstoch, _smooth )
    float _scaled   = ( _smoothed / 100 ) * _scale

//  mode selectable rsi function for standard, or smoothed output
f_rsi( _source, _length, _mode ) =>

    //  get base rsi
    float _zrsi = f_zrsi( _source, _length )

    //  smoothing in a manner similar to HA open, but rather using the realtime
    //  rsi in place of the prior close value.
    var float _smoothed = na
    _smoothed := na( _smoothed[1] ) ? _zrsi : ( _smoothed[1] + _zrsi ) / 2

    //  return the requested mode
    _mode ? _smoothed : _zrsi

//  RSI Heikin-Ashi generation function
f_rsiHeikinAshi( _length ) =>

    //  get close rsi
    float _closeRSI = f_zrsi( close, _length )

    //  emulate "open" simply by taking the previous close rsi value
    float _openRSI  = nz( _closeRSI[1], _closeRSI )

    //  the high and low are tricky, because unlike "high" and "low" by
    //  themselves, the RSI results can overlap each other. So first we just go
    //  ahead and get the raw results for high and low, and then..
    float _highRSI_raw  = f_zrsi( high, _length )
    float _lowRSI_raw   = f_zrsi( low, _length )
    //  ..make sure we use the highest for high, and lowest for low
    float _highRSI  = max( _highRSI_raw, _lowRSI_raw )
    float _lowRSI   = min( _highRSI_raw, _lowRSI_raw )

    //  ha calculation for close
    float _close    = ( _openRSI + _highRSI + _lowRSI + _closeRSI ) / 4

    //  ha calculation for open, standard, and smoothed/lagged
    var float _open = na
    _open  := na( _open[ i_smoothing ] ) ? ( _openRSI + _closeRSI ) / 2 :
              ( ( _open[1] * i_smoothing ) + _close[1] ) / ( i_smoothing + 1 )

    //  ha high and low min-max selections
    float _high     = max( _highRSI, max( _open, _close ) )
    float _low      = min( _lowRSI,  min( _open, _close ) )

    //  return the OHLC values
    [ _open, _high, _low, _close ]

////////////////////////////////////////////////////////////////////////////////
//                                                                            //
//                   ====== SERIES, LINES and LABELS ======                   //
//                                                                            //
////////////////////////////////////////////////////////////////////////////////

//  standard, or ha smoothed rsi for the line plot and/or histogram
float RSI = f_rsi( i_source, i_lenRSI, i_mode )

//  stoch stuff
float StochK = f_zstoch( RSI, i_stochLen, i_smoothK, i_stochFit )
float StochD = sma( StochK, i_smoothD )

//  get OHLC values to use in the plotcandle()
[ O, H, L, C ] = f_rsiHeikinAshi( i_lenHARSI )

//  candle body colouring
color bodyColour    = C > O ? i_colUp : i_colDown
color wickColour    = i_colWick

//  shadow, invisible
color colShadow     = color.rgb( 0, 0, 0, 20 )
color colNone       = color.rgb( 0, 0, 0, 100 )

//  rsi color
color colRSI        = color.rgb( 250, 200, 50, 0 )

//  stoch ribbon fill
color colStochK     = color.new( #0094FF, 0 )
color colStochD     = color.new( #FF6A00, 0 )
color colStochFill  = StochK >= StochD ? color.new( colStochK, 50 ) : color.new( colStochD, 50 )

////////////////////////////////////////////////////////////////////////////////
//                                                                            //
//                     ====== DRAWING and PLOTTING ======                     //
//                                                                            //
////////////////////////////////////////////////////////////////////////////////

//  zero median RSI channel hlines
upperx  = hline( i_upperx,  "OB Extreme",   color.new( color.silver, 60 ) )
upper   = hline( i_upper,   "OB",           color.new( color.silver, 80 ) )
median  = hline( 0,         "Median",       color.orange, hline.style_dotted )
lower   = hline( i_lower,   "OS",           color.new( color.silver, 80 ) )
lowerx  = hline( i_lowerx,  "OS Extreme",   color.new( color.silver, 60 ) )

//  channel fill
fill( upper, upperx, color.new( color.red, 90 ),    title = "Background Fill OB" )
fill( upper, lower,  color.new( color.blue, 90 ),   title = "Background Channel" )
fill( lower, lowerx, color.new( color.green, 90 ),  title = "Background Fill OS" )


//  make our HA rsi candles
plotcandle( O, H, L, C, "HARSI", bodyColour, wickColour, bordercolor = bodyColour )

//  RSI overlay plot
plot( i_showPlot ? RSI : na,                    "RSI Shadow",       colShadow,  3 )
plot_rsi    = plot( i_showPlot ? RSI : na,      "RSI Overlay",      colRSI,     1 )

buy = C < O and O > 18 and RSI > i_upper and falling(RSI,1)
sell = C > O and O < -18 and RSI < i_lower and rising(RSI,1)

buy1 = C > O and C < -7 and rising(RSI,2)
sell2 = C < O and C > 7 and falling(RSI,2)


plotshape(sell, style=shape.circle, size=size.tiny, color=color.lime, location =location.bottom)
plotshape(buy, style=shape.circle, size=size.tiny, color=color.red, location =location.top)

plotshape(buy1, style=shape.circle, size=size.tiny, color=color.orange, location =location.bottom)
plotshape(sell2, style=shape.circle, size=size.tiny, color=color.orange, location =location.top)


alertcondition(sell, "Buy")
alertcondition(buy, "Sell")

alertcondition(buy1, "Close Short")
alertcondition(sell2, "Close Long")


// -- PEANUT
反馈
1
等级
项目
22
23%
仲裁
5
40%
/
60%
逾期
2
9%
工作中
2
等级
项目
499
67%
仲裁
5
40%
/
0%
逾期
4
1%
空闲
发布者: 8 代码
3
等级
项目
603
34%
仲裁
65
22%
/
57%
逾期
146
24%
工作中
发布者: 1 文章, 22 代码
4
等级
项目
252
79%
仲裁
0
逾期
0
空闲
5
等级
项目
178
39%
仲裁
4
25%
/
50%
逾期
14
8%
空闲
6
等级
项目
102
23%
仲裁
12
25%
/
17%
逾期
13
13%
空闲
7
等级
项目
945
47%
仲裁
309
58%
/
27%
逾期
125
13%
空闲
相似订单
Convert TradingView Indicator to MT4
30 - 40 USD
Project: Convert TradingView Indicator to MT4 We are looking for an experienced MQL4 developer to convert a high-quality TradingView indicator into a MetaTrader 4 (MT4) indicator. Indicator Details: The TradingView indicator generates buy and sell arrows for trade entries. It is non-repainting, has no lag, and is highly reliable. Arrows appear only after the candle closes and remain visible permanently. Requirements
Ninjascript strategy tester
30+ USD
Hi, I need NinjaTrader 8 Strategy Analyzer backtests on two of my strategies, each over 1 year AND 3 years of data. Please quote the full job. Common settings: NT8 Strategy Analyzer, MCL (Micro WTI Crude Oil) continuous front-month contract (MCL ##-##), 5-minute bars, 1yr + 3yr of the most recent data, $2.50 round-turn commission per contract. Deliverables per run: full Strategy Analyzer summary (net profit, profit
Project Overview: I am looking for an experienced MQL5 developer to convert a suite of 6 custom MT4 indicators into native, fully optimized MQL5 (.mq5) indicators. I will provide the uncompiled .mq4 source files for all seven tools upon hiring. The indicators must compile cleanly in MetaEditor for MT5 without errors or critical warnings, function correctly together on a multi-timeframe chart setup (specifically
Custom MT5 Expert Advisor (EA) Development | MQL5 Automation Turn Your Trading Strategy into a Powerful Automated Trading System! Are you looking for a professional MT5 Expert Advisor developer to automate your trading strategy? I specialize in developing custom MetaTrader 5 (MT5) Expert Advisors and indicators using MQL5 , tailored to your trading rules, risk management preferences, and trading goals. Whether you
I am looking for an experienced MQL5 developer or development team to build a scalable Telegram-to-MT5 copy trading system. The main purpose of the system is to monitor trading signals from my Telegram channel and automatically execute those signals on connected client MT5 accounts. Core Requirements Receive and parse trading signals from Telegram Automatically execute trades on connected MT5 accounts Support more
Thana ram
30 - 200 USD
Hello, I want to develop a custom MT5 Expert Advisor (EA) for XAUUSD Gold. IMPORTANT: I want a proper rule-based automated trading EA, NOT a martingale, grid or guaranteed-profit bot. 1. MARKET & TIMEFRAME - Platform: MT5 - Symbol: XAUUSD only - Main trend timeframe: M15 - Entry timeframe: M5 - Must support broker suffixes such as XAUUSDm, XAUUSD., etc. 2. TREND RULE BUY trend: - M15 price above EMA 50 - EMA 50 above
I need a TradingView Pine Script (v6) indicator that gives BUY and SELL signals in real time on the live chart. MAIN REQUIREMENT – NO REPAINTING: 1. Signals must appear only when the candle closes (barstate.isconfirmed). Example: on 1-min chart, signal for the 10:35 candle must appear at 10:36 and never disappear or move. 2. Signals on historical bars must look exactly the same as they looked live. 3. No lookahead
Description I am looking for a highly skilled MQL5 Developer & Trader with strong experience in EA optimization, stress testing, and forward validation. The EA is already coded and running. What I need now is: 1.Simple code editing, code adjustment/upgrading and code tamplates inserting, 2.Parameter Optimization & Re-Validation – Find the best stable settings for XAUUSD (not overfitted). 3.Robustness / Stress Testing
مطلوب موشر قوية لتداول الذهب يحقق
100 - 200 USD
المطلوب موشر لتداول الذهب مجرب وقوية يعطي اشاره قوية فقط مع وقف خساره ومختبر ومجرب في حال الموافقه علي لموشر بعد التجربه لمدة ٣ ايام يتم الشراء دايم مبلغ ٢٠٠ دولار
Strategy
40 - 60 USD
yo i have a strategy i would really like to turn into a signal bot basically please this is very technical and serious to me the strategy needs more time 1 time frame and the bot most be 100% accurate
项目信息
预算
30+ USD
截止日期
到 1 天