 Alle Aufträge
 Regeln
Wie man einen Handelsroboter schnell bestellen kann
Lesen Sie bitte zuerst die Regeln durch
Wie man einen Handelsroboter in MQL5 und MQL4 in Auftrag gibt
Hier ist das Muster einer Anforderungsspezifikation, um einen Roboter zu bestellen
Neuer Aufträge in dieser Kategorie:
30+ USD
100+ USD
100+ USD
50 - 150 USD
1000 - 2000 USD
100 - 150 USD
30 - 50 USD
30 - 500 USD
30 - 1000 USD
Auftrag beendet
Ausführungszeit 3 Stunden

Bewertung des Kunden
Great dev, delivered fast + good communication
Bewertung des Entwicklers
Very nice working experience
Spezifikation
Link to External Description:
Here is the Pinescript code below:
Key Task is to convert from the standard RSI indicator:
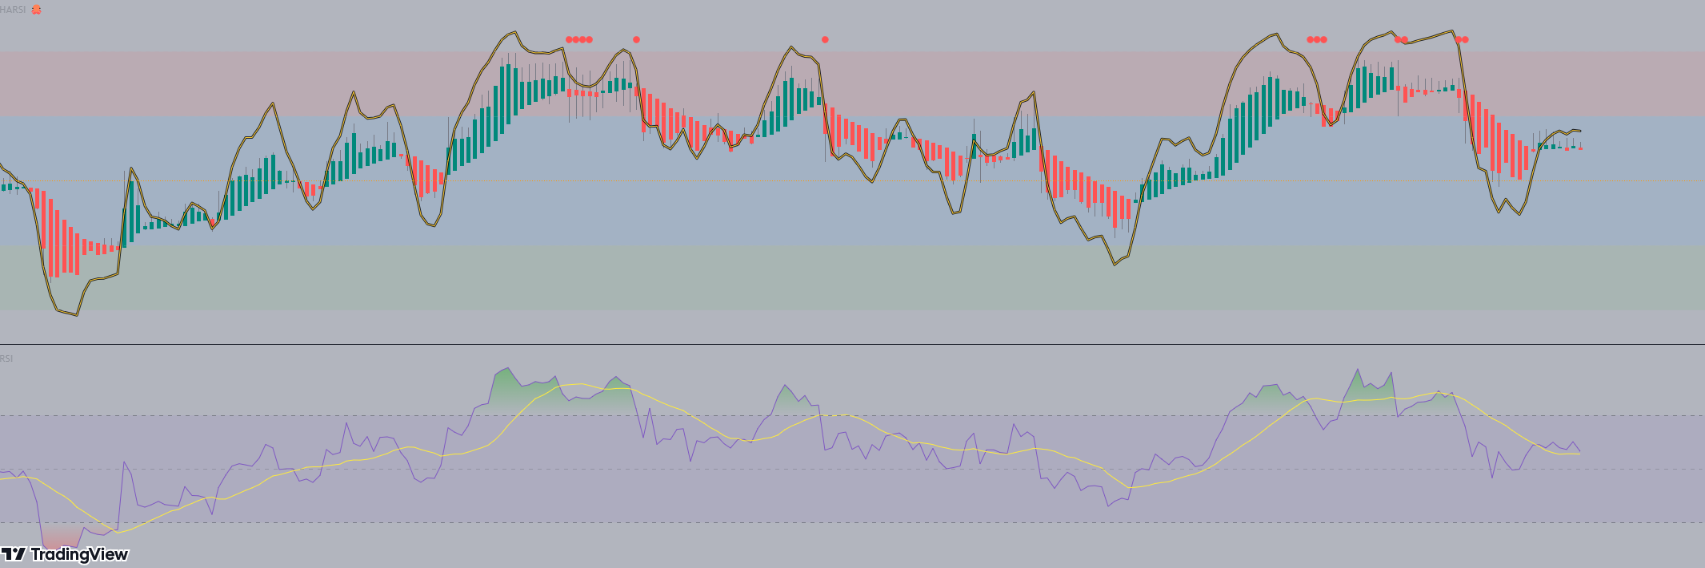
Steps:
1) Deliver in a quick timeframe - should be straight forward (within 24 - 48 hrs max)
2) May extend to add it in an EA (after the source code is shown). But for now it is just making the indicator the same as the Pinescript version
See the code below:
// This source code is free to use, copy, and alter in any way you choose.
// ...but credit is always nice :)

//@version=4
//@author=JayRogers

study( "HARSI", "HARSI 🐙", false, format.price, 2 )

////////////////////////////////////////////////////////////////////////////////
//                                                                            //
// ====== ABOUT THIS INDICATOR                                                //
//                                                                            //
//  - RSI based Heikin Ashi candle oscillator                                 //
//                                                                            //
// ====== ARTICLES and FURTHER READING                                        //
//                                                                            //
//  - https://www.investopedia.com/terms/h/heikinashi.asp                     //
//                                                                            //
//    "Heikin-Ashi is a candlestick pattern technique that aims to reduce     //
//    some of the market noise, creating a chart that highlights trend        //
//    direction better than typical candlestick charts"                       //
//                                                                            //
// ====== REASON FOR STUDY                                                    //
//                                                                            //
//  - Mostly experimental. I wanted to see if I could translate RSI into a    //
//    Heikin Ashi function and retain it's oscillating nature. That goal      //
//    was met more easily than I anticipated with quite delightful results.   //
//                                                                            //
// ====== DISCLAIMER                                                          //
//                                                                            //
//    Any trade decisions you make are entirely your own responsibility.      //
//    I've made an effort to squash all the bugs, but you never know!         //
//                                                                            //
////////////////////////////////////////////////////////////////////////////////

////////////////////////////////////////////////////////////////////////////////
//                                                                            //
//                           ====== TOOLTIPS ======                           //
//                                                                            //
////////////////////////////////////////////////////////////////////////////////

string TT_HARSI = "Period for the RSI calculations used to generate the"        +
                  "candles. This seperate from the RSI plot/histogram length."

string TT_PBIAS = "Smoothing feature for the OPEN of the HARSI candles."        +
                  "\n\nIncreases bias toward the prior open value which can"    +
                  " help provide better visualisation of trend strength."       +
                  "\n\n** By changing the Open values, High and Low can also"   +
                  " be distorted - however Close will remain unchanged."

string TT_SMRSI = "This option smoothes the RSI in a manner similar to HA"      +
                  " open, but uses the realtime rsi rather than the prior"      +
                  " close value."

string TT_STOCH = "Uses the RSI generated by the above settings, and as such"   +
                  " will be affected by the smoothing option."

string TT_STFIT = "Adjusts the vertical scaling of the stochastic, can help"    +
                  " to prevent distortion of other data in the channel."        +
                  "\n\nHas no impact cross conditions."

////////////////////////////////////////////////////////////////////////////////
//                                                                            //
//                            ====== INPUTS ======                            //
//                                                                            //
////////////////////////////////////////////////////////////////////////////////

// -- Candle config

string GROUP_CAND = "Config » HARSI Candles"
i_lenHARSI  = input( 14,            "Length",               input.integer,  group = GROUP_CAND,
                  minval = 1, tooltip = TT_HARSI )
i_smoothing = input( 6,             "Open Smoothing",       input.integer,  group = GROUP_CAND,
                  minval = 1, maxval = 100, tooltip = TT_PBIAS )
string INLINE_COL = "Colour Pallette"
i_colUp     = input( color.teal,    "Colour Pallette  ",    input.color,    group = GROUP_CAND, inline = INLINE_COL )
i_colDown   = input( color.red,     " ",                    input.color,    group = GROUP_CAND, inline = INLINE_COL )
i_colWick   = input( color.gray,    " ",                    input.color,    group = GROUP_CAND, inline = INLINE_COL )

// -- RSI plot config

string GROUP_PLOT = "Config » RSI Plot"
i_source    = input( ohlc4,         "Source",               input.source,   group = GROUP_PLOT )
i_lenRSI    = input( 7,             "Length",               input.integer,  group = GROUP_PLOT,
                  minval = 1 )
i_mode      = input( true,          "Smoothed Mode RSI?",   input.bool,     group = GROUP_PLOT,
                  tooltip = TT_SMRSI )
i_showPlot  = input( true,          "Show RSI Plot?",       input.bool,     group = GROUP_PLOT )
i_showHist  = input( true,          "Show RSI Histogram?",  input.bool,     group = GROUP_PLOT )

// -- Stochastic RSI plots config

string GROUP_STOCH = "Config » Stochastic RSI Plot"
string INLINE_STDS = "Stoch Draw States"
i_showStoch = input( false,         "Show Stochastic? ",    input.bool,     group = GROUP_STOCH, inline = INLINE_STDS,
                  tooltip = TT_STOCH )
i_ribbon    = input( true,          "Ribbon?",              input.bool,     group = GROUP_STOCH, inline = INLINE_STDS )
i_smoothK   = input( 3,             "Smoothing K",          input.integer,  group = GROUP_STOCH,
                  minval = 1 )
i_smoothD   = input( 3,             "Smoothing D",          input.integer,  group = GROUP_STOCH,
                  minval = 1 )
i_stochLen  = input( 14,            "Stochastic Length",    input.integer,  group = GROUP_STOCH,
                  minval = 1 )
i_stochFit  = input( 80,            "Stoch Scaling %",      input.integer,  group = GROUP_STOCH,
                  minval = 1, maxval = 100, tooltip = TT_STFIT )

// -- Channel OB/OS config

string GROUP_CHAN = "Config » OB/OS Boundaries"
i_upper     = input( 20,            "OB",                   input.integer,  group = GROUP_CHAN, inline = "OB",
                  minval = 1, maxval = 50 )
i_upperx    = input( 40,            "OB Extreme",           input.integer,  group = GROUP_CHAN, inline = "OB",
                  minval = 1, maxval = 50 )

i_lower     = input( -20,           "OS",                   input.integer,  group = GROUP_CHAN, inline = "OS",
                  minval = -50, maxval = -1 )
i_lowerx    = input( -40,           "OS Extreme",           input.integer,  group = GROUP_CHAN, inline = "OS",
                  minval = -50, maxval = -1 )

////////////////////////////////////////////////////////////////////////////////
//                                                                            //
//                          ====== FUNCTIONS ======                           //
//                                                                            //
////////////////////////////////////////////////////////////////////////////////

//  zero median rsi helper function, just subtracts 50.
f_zrsi( _source, _length ) => rsi( _source, _length ) - 50

//  zero median stoch helper function, subtracts 50 and includes % scaling
f_zstoch( _source, _length, _smooth, _scale ) =>
    float _zstoch   = stoch( _source, _source, _source, _length) - 50
    float _smoothed = sma( _zstoch, _smooth )
    float _scaled   = ( _smoothed / 100 ) * _scale

//  mode selectable rsi function for standard, or smoothed output
f_rsi( _source, _length, _mode ) =>

    //  get base rsi
    float _zrsi = f_zrsi( _source, _length )

    //  smoothing in a manner similar to HA open, but rather using the realtime
    //  rsi in place of the prior close value.
    var float _smoothed = na
    _smoothed := na( _smoothed[1] ) ? _zrsi : ( _smoothed[1] + _zrsi ) / 2

    //  return the requested mode
    _mode ? _smoothed : _zrsi

//  RSI Heikin-Ashi generation function
f_rsiHeikinAshi( _length ) =>

    //  get close rsi
    float _closeRSI = f_zrsi( close, _length )

    //  emulate "open" simply by taking the previous close rsi value
    float _openRSI  = nz( _closeRSI[1], _closeRSI )

    //  the high and low are tricky, because unlike "high" and "low" by
    //  themselves, the RSI results can overlap each other. So first we just go
    //  ahead and get the raw results for high and low, and then..
    float _highRSI_raw  = f_zrsi( high, _length )
    float _lowRSI_raw   = f_zrsi( low, _length )
    //  ..make sure we use the highest for high, and lowest for low
    float _highRSI  = max( _highRSI_raw, _lowRSI_raw )
    float _lowRSI   = min( _highRSI_raw, _lowRSI_raw )

    //  ha calculation for close
    float _close    = ( _openRSI + _highRSI + _lowRSI + _closeRSI ) / 4

    //  ha calculation for open, standard, and smoothed/lagged
    var float _open = na
    _open  := na( _open[ i_smoothing ] ) ? ( _openRSI + _closeRSI ) / 2 :
              ( ( _open[1] * i_smoothing ) + _close[1] ) / ( i_smoothing + 1 )

    //  ha high and low min-max selections
    float _high     = max( _highRSI, max( _open, _close ) )
    float _low      = min( _lowRSI,  min( _open, _close ) )

    //  return the OHLC values
    [ _open, _high, _low, _close ]

////////////////////////////////////////////////////////////////////////////////
//                                                                            //
//                   ====== SERIES, LINES and LABELS ======                   //
//                                                                            //
////////////////////////////////////////////////////////////////////////////////

//  standard, or ha smoothed rsi for the line plot and/or histogram
float RSI = f_rsi( i_source, i_lenRSI, i_mode )

//  stoch stuff
float StochK = f_zstoch( RSI, i_stochLen, i_smoothK, i_stochFit )
float StochD = sma( StochK, i_smoothD )

//  get OHLC values to use in the plotcandle()
[ O, H, L, C ] = f_rsiHeikinAshi( i_lenHARSI )

//  candle body colouring
color bodyColour    = C > O ? i_colUp : i_colDown
color wickColour    = i_colWick

//  shadow, invisible
color colShadow     = color.rgb( 0, 0, 0, 20 )
color colNone       = color.rgb( 0, 0, 0, 100 )

//  rsi color
color colRSI        = color.rgb( 250, 200, 50, 0 )

//  stoch ribbon fill
color colStochK     = color.new( #0094FF, 0 )
color colStochD     = color.new( #FF6A00, 0 )
color colStochFill  = StochK >= StochD ? color.new( colStochK, 50 ) : color.new( colStochD, 50 )

////////////////////////////////////////////////////////////////////////////////
//                                                                            //
//                     ====== DRAWING and PLOTTING ======                     //
//                                                                            //
////////////////////////////////////////////////////////////////////////////////

//  zero median RSI channel hlines
upperx  = hline( i_upperx,  "OB Extreme",   color.new( color.silver, 60 ) )
upper   = hline( i_upper,   "OB",           color.new( color.silver, 80 ) )
median  = hline( 0,         "Median",       color.orange, hline.style_dotted )
lower   = hline( i_lower,   "OS",           color.new( color.silver, 80 ) )
lowerx  = hline( i_lowerx,  "OS Extreme",   color.new( color.silver, 60 ) )

//  channel fill
fill( upper, upperx, color.new( color.red, 90 ),    title = "Background Fill OB" )
fill( upper, lower,  color.new( color.blue, 90 ),   title = "Background Channel" )
fill( lower, lowerx, color.new( color.green, 90 ),  title = "Background Fill OS" )


//  make our HA rsi candles
plotcandle( O, H, L, C, "HARSI", bodyColour, wickColour, bordercolor = bodyColour )

//  RSI overlay plot
plot( i_showPlot ? RSI : na,                    "RSI Shadow",       colShadow,  3 )
plot_rsi    = plot( i_showPlot ? RSI : na,      "RSI Overlay",      colRSI,     1 )

buy = C < O and O > 18 and RSI > i_upper and falling(RSI,1)
sell = C > O and O < -18 and RSI < i_lower and rising(RSI,1)

buy1 = C > O and C < -7 and rising(RSI,2)
sell2 = C < O and C > 7 and falling(RSI,2)


plotshape(sell, style=shape.circle, size=size.tiny, color=color.lime, location =location.bottom)
plotshape(buy, style=shape.circle, size=size.tiny, color=color.red, location =location.top)

plotshape(buy1, style=shape.circle, size=size.tiny, color=color.orange, location =location.bottom)
plotshape(sell2, style=shape.circle, size=size.tiny, color=color.orange, location =location.top)


alertcondition(sell, "Buy")
alertcondition(buy, "Sell")

alertcondition(buy1, "Close Short")
alertcondition(sell2, "Close Long")


// -- PEANUT
Bewerbungen
1
Bewertung
Projekte
22
23%
Schlichtung
5
40%
/
60%
Frist nicht eingehalten
2
9%
Arbeitet
2
Bewertung
Projekte
499
67%
Schlichtung
5
40%
/
0%
Frist nicht eingehalten
4
1%
Frei
Veröffentlicht: 8 Beispiele
3
Bewertung
Projekte
603
34%
Schlichtung
65
22%
/
57%
Frist nicht eingehalten
147
24%
Arbeitet
Veröffentlicht: 1 Artikel, 22 Beispiele
4
Bewertung
Projekte
239
77%
Schlichtung
0
Frist nicht eingehalten
0
Frei
5
Bewertung
Projekte
178
39%
Schlichtung
4
25%
/
50%
Frist nicht eingehalten
14
8%
Frei
6
Bewertung
Projekte
102
23%
Schlichtung
12
25%
/
17%
Frist nicht eingehalten
13
13%
Frei
7
Bewertung
Projekte
945
47%
Schlichtung
309
58%
/
27%
Frist nicht eingehalten
125
13%
Frei
Ähnliche Aufträge
2 types of strategies must be added to a EA
30 - 40 USD
Hi In my current EA, you have to modify this robot in Instagram & Facebook. Select option 1 and 2 to create robots. My old Robot Pentang Order is designed to put only in order so you will be easy to change. 2 in 1 I have my existing EA like this in which you have to modify this robot in Instagram & Facebook 2 videos must create robots with the select option 1&2 my video link is attached rar file and is clearly
I am looking for an experienced MQL5 developer to create a fully automatic MT5 Expert Advisor (EA) for frequent small-profit trades. My current manual strategy is simple: I watch short-term price movement, enter when price starts moving strongly up or down, and close once a small profit is achieved. I want an EA that can identify these movements and automatically repeat this process throughout the day. Main
EA-Gann_Reversal_Confluence_V6
30 - 50 USD
Code the indicator to MT5 EA, include all the inputs variables and values Allow live trading Allow demo trading Allow strategy tester Bar shift 0 adjustable Allow indicator to show on strategy tester Lot size adjustable Max spread in points (0=disable) Use stop loss circle true or false Stop loss circle in points adjustable Use stop loss true or false Stop loss in points (adjustable) Take profit true or false Use
Ready to use scalping EA MT5
30 - 100 USD
Hi All, Looking for a ready to TEST and USE EA which makes $20 per day with initial deposit of $100 only with controlled drawdown and no trades during news time. Please note: Budget is fixed and no trial and hit error for testing and developing EA as I do not have time. I will select the developer only after the TEST is successful only, do not force to select and make the payment and payment will be done once I am
Ndugelo Ravhengani Bot
30+ USD
Create a bot that can trade and read indicators easy to read for first time users. Bot that can be used on a phone and connect to MT5. It should be easy to install or use on any device especially phone and laptop, preferably the bot that can run over night and controllable when needed
Need Grid + Martingale Type Averaging EA
30 - 50 USD
Need Grid + Martingale Type Averaging EA ( Directional Buy or Sell entry then uses grid/martingale for Recovery if need ) * Must Work Buy + Sell Both Side ( Do not Open Buy or Sell at Once Let the Previous Order Close ) * Min Lot size 0.01 * Max Lot Size 1 ( Can be Edited to maximum ) * Auto TP Shift * Auto Averaging Position also Auto Shift TP as per Averaging * After Averaging Close the Trade in Maximum Profit (
C'est un Expert Advisor (EA) MQL5 pour MetaTrader 5, conçu pour l' XAUUSD , combinant un filtre de tendance et une grille adaptative avec gestion de panier ("basket") et protections contre le drawdown. Version 1.00. Logique de trading Filtre de tendance (H4 par défaut) • EMA rapide (50) vs EMA lente (200) pour déterminer la direction (UP/DOWN) • Filtre ADX (période 14, seuil 18) pour éviter de trader en
I have 2 trading view indicators by GainzAlgo that I want code to mt5 , could u advise? I need you to give me response if you can convert This
Mt5 account sl system override
34 - 68 USD
Looking for an MT4/MT5 independent risk-management service or system that can monitor and automatically close trades opened and managed by another trader’s EA. The existing EA continuously removes/overrides manually added Stop Losses and may also override SLs placed by another EA. I need a solution that does not rely on modifying the existing trade or placing a Stop Loss. Instead, it should independently monitor each
I currently sell a white-label XAUUSD EA, but the existing supplier owns the source code. I now need a new, independently developed EA and licensing system that my company fully owns and controls. I am not requesting decompilation or copying of proprietary code. Existing settings, presets and trading examples will be provided as reference. The developer must first identify any missing strategy rules before
Projektdetails
Budget
30+ USD
Ausführungsfristen
bis 1 Tag(e)