Fan sayfamıza katılın
Öyleyse bir link gönderin -
başkalarının da faydalanmasını sağlayın
- Görüntülemeler:
- 183
- Derecelendirme:
- Yayınlandı:
-
Bu koda dayalı bir robota veya göstergeye mi ihtiyacınız var? Freelance üzerinden sipariş edin Freelance'e git
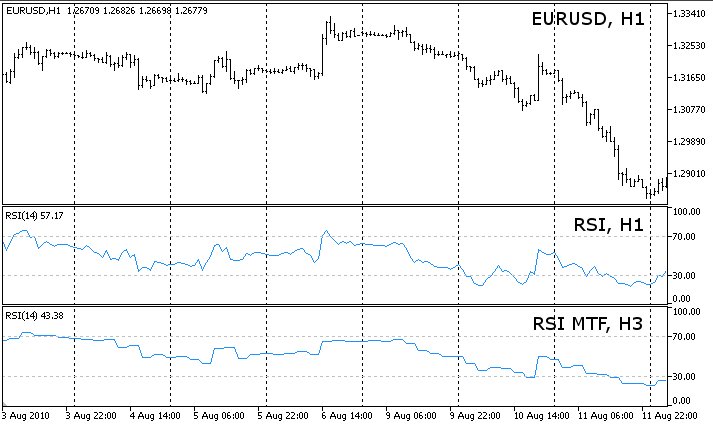
Bu RSI(Göreceli Güç Endeksi) göstergesi, mevcut grafiğin zaman diliminden daha yüksek veya daha düşük herhangi bir zaman dilimine uygulanabilir.
NOT: Kendi çoklu zaman dilimi göstergelerinizi oluşturmak istiyorsanız, bu RSI MTF göstergesi iyi bir örnektir. Yalnızca bir tamponu vardır, bu nedenle kod daha az karmaşıktır ve birçok tamponu olan diğer çoklu zaman dilimi göstergelerine göre anlaşılması daha kolaydır.
Yerleşik iRSI göstergesinin tüm olağan parametrelerini kullanabilirsiniz, tek ekstra ayar hesaplamalar için girdi olarak kullanılan ikinci zaman dilimidir.
Gösterge, mevcut grafiğin zaman çerçevesinden daha düşük bir zaman çerçevesine uygulandığında, tüm değerleri görüntülemek mümkün değildir. Bu durumda, seçilen fiyat türüne bağlı olarak, en uygun değeri vermek için farklı bir yaklaşım kullanacaktır.
İki örnek:
- timeframe_1=5 dakika, timeframe_2=1 dakika, Kapanış fiyat serisine dayalı hesaplamalar:
Zaman çerçevesi_1'deki herhangi bir çubuk için gösterge, zaman çerçevesi_1'deki çubuğun Kapanış saatinden önce veya Kapanış saatinde olan zaman çerçevesi_2'nin en son çubuğunu gösterecektir. Bu, kapatılmış çubukların yanı sıra hala açık olan mevcut çubuk için de geçerlidir.
- timeframe_1=5 dakika, timeframe_2=1 dakika, hesaplamalar Açık fiyat serisine dayanır:
Zaman çerçevesi_1'deki herhangi bir çubuk için gösterge, zaman çerçevesi_1'deki çubuğun Açılış saatinden önce veya Açılış saatinde bir açılış saati ile zaman çerçevesi_2'nin en son çubuğunu gösterecektir. Bu, kapatılmış çubukların yanı sıra hala açık olan mevcut çubuk için de geçerlidir. Buradaki mantık, göstergelerinizi bir çubuğun Açılış saatinde hesaplamayı seçerseniz, muhtemelen yeni bir çubuk açıldığında da işlem yapacaksınız. Bu durumda, yeni bir 5 dakikalık çubuğun Açılışında, yalnızca onun bir parçası olan beş 1 dakikalık çubuğun ilkinin Açılışını bileceksiniz. Bu nedenle, ikinci ila beşinci 1 dakikalık çubukların Açılışı hesaplamalarda göz ardı edilir.
Senkronize olmasalar bile herhangi bir zaman çerçevesini başka bir zaman çerçevesiyle karıştırabilirsiniz, örneğin timeframe_1 = 5 dakika ve timeframe_2 = 12 dakika. Gösterge senkronize kalmalarını sağlayacaktır. Bunun çalışma şekli yukarıdaki örneklere benzer.
Bir excel sayfasında daha görsel bir açıklama için MACD Histogram MTF MC göstergesine bakın.
Zaman dilimleri arasında geçiş yaparken, fiyat verilerinin yüklenmesi için biraz zaman (birkaç saniye) bekleyin. Gösterge görüntülenmiyorsa, grafiği manuel olarak yenileyin.
Hata mesajlarını açmak/kapatmak için kaynağa bakın:
bool ShowErrorMessages=false; // hata ayıklama için hata mesajlarını aç/kapat

Güncelleme geçmişi:
2010 09 26: v04
- Grafiğin zaman diliminden daha küçük zaman dilimlerindeki değerlerin görüntülenmesi iyileştirildi;
- Tamponları 0 yerine EMPTY_VALUE olarak ayarlayın: if(convertedTime<tempTimeArray_TF2[0]);
- Kod optimizasyonu;
- PLOT_DRAW_BEGIN OnInit()'ten kaldırıldı - tek zaman dilimi göstergesinden miras alındı;
- Tamponların ve dizilerin ArraySetAsSeries'i OnInit() içine taşındı;
2010 09 06: v02
- Göstergenin yanlış çizilmesine neden olan Time[] dizisi ile ilgili hata düzeltildi;
2010 08 25: v01
- Gösterge ilk yayınlandı;
MetaQuotes Ltd tarafından İngilizceden çevrilmiştir.
Orijinal kod: https://www.mql5.com/en/code/178
 Functions to simplify work with orders
Tek istediğimiz algoritmalar ve yöntemler hakkında düşünmek, sözdizimi ve emirlerin nasıl verileceği hakkında değil. Burada MQL5'te pozisyonları yönetmek için basit fonksiyonlara sahipsiniz.
 Download all ticks of a symbol's history
Piyasa saatindeki tüm semboller için aracınızdan tüm tik'leri indirin. Varsa tüm geçmişi veya geçmişteki belirli bir tarihe kadar indirin.
![Stochastic multi-timeframe [v04]](https://c.mql5.com/i/code/indicator.png) Stochastic multi-timeframe [v04]
Stochastic multi-timeframe [v04]
Stokastik gösterge, herhangi bir zaman dilimine uygulanabilir (mevcut grafiğin zaman diliminden daha yüksek veya daha düşük).
 Useful #define statements
Bunlar, EA'nızdaki işlemleri gerçekleştirmek için yararlı olan bazı #define deyimleridir. Sadece değişkenlerinizin adını dosyanın başına atamanız ve ardından diğer #define deyimlerinin işi yapmasına izin vermeniz gerekir. Bu dosyayı kullanmak için, EA dosyanızdaki ilk satıra #include <DEFINE_statements.mqh> ekleyin.